- Trang chủ >>
- Khoa Học Tự Nhiên >>
- Vật lý
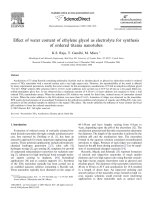
effect of water content of ethylene glycol as electrolyte for synthesis
Bạn đang xem bản rút gọn của tài liệu. Xem và tải ngay bản đầy đủ của tài liệu tại đây (724.56 KB, 8 trang )
Effect of water content of ethylene glycol as electrolyte for synthesis
of ordered titania nanotubes
K.S. Raja, T. Gandhi, M. Misra
*
Metallurgical and Materials Engineering, Mail Stop 388, University of Nevada, Reno, NV 89557, United States
Received 4 December 2006; received in revised form 13 December 2006; accepted 19 December 2006
Available online 28 December 2006
Abstract
Anodization of Ti using fluoride containing polyhydric alcohols such as ethylene glycol or glycerol as electrolyte results in ordered
arrays of TiO
2
nanotubes with a smooth surface and a very high aspect ratio. However, the reproducibility of the result is affected
by many experimental parameters, notably the water content. In this investigation, anodizations of Ti foil in anhydrous ethylene glycol
+0.2 wt% NH
4
F solution (EG solution) with 0–1.0 wt% water additions were carried out at 20 V for 45 min in a dry-argon filled con-
trolled-atmosphere glove box. It was observed that a minimum amount of 0.18 wt% of water addition was required to form a well
ordered TiO
2
nanotubular arrays. When the anhydrous EG solution was reused for third time, ordered arrays of nanotubes started
to form. When the water addition to the EG solution was more than 0.5 wt%, formation of ridges was observed on the nanotubes.
XPS results showed presence of un-anodized Ti element in the anhydrous condition and presence of organic and (NH
4
)
2
TiF
6
type com-
pounds in all the anodized samples in addition to the regular TiO
2
phase. The results underline the influence of water content and local
pH condition to form the ordered nanotubular arrays.
Ó 2007 Elsevier B.V. All rights reserved.
Keywords: Nanotubular TiO
2
; Anodization; Ethylene glycol; Oxide film
1. Introduction
Formation of ordered arrays of vertically oriented tita-
nium dioxide nanotubes through a simple anodization pro-
cess, first reported by Zwelling et al. [1], has been an
attractive approach for many important engineering appli-
cations. These potential applications include photoelectro-
chemical hydrogen generation [2,3], solar cells [4],
hydrogen storage [5], gas sensing [6], templates for growth
of compound semiconductor nanowires for radiation sens-
ing [7], substrate for high interfacial bond strength hydro-
xyl apatite coating in implants, [8,9] biomedical
applications [10] and as catalyst supports [11]. Synthesis
of the TiO
2
nanotubes typically has been carried out in
an acidified aqueous solution containing a fluoride salt.
These nanotubes typically have diameters in the range of
60–150 nm and have lengths varying from 0.4 lmto
4 lm, depending upon the pH of the electrolyte [12]. The
anodization potential and fluoride concentration determine
the diameter. The length of the nanotubes is tailored by the
solution pH and the anodization time. The nanotubes
formed in the aqueous solution contained circumferential
serrations or ridges. Presence of such ridges was explained
based on the pH burst during anodization [13] or by repul-
sion of accumulated charged vacancies [14].
Recently, Macak and Schmuki [15] reported formation
of smooth and ridges-free nanotubes of much smaller
diameter and very high aspect ratio using fluoride contain-
ing high viscous organic elect rolytes such as glycerol and
ethylene glycol. The diameter of the nanotubes varied from
40 nm to 60 nm at 20 V and anodization for 18 h resulted
in a length of about 6lm. An improved ordering and
smooth surface of the nanotube arrays formed in high vis-
cous organic solutions could provide more interesting
applications to these nanotubes such as optical wave
1388-2481/$ - see front matter Ó 2007 Elsevier B.V. All rights reserved.
doi:10.1016/j.elecom.2006.12.024
*
Corresponding author. Tel.: +1 775 784 1603; fax: +1 775 327 5059.
E-mail address: (M. Misra).
www.elsevier.com/locate/elecom
Electrochemistry Communications 9 (2007) 1069–1076
guides. Recently, Paulose et al. [16] reported 134 lm long
nanotubular arrays by anodizing in various non-aqueous
organic polar electrolytes such as ethylene glycol, dimethyl
sulfoxide, formamide etc. When the TiO
2
nanotubes
formed in the organic solutions were annealed at 500–
650 °C, the adsorbed carbon species during the anodization
process modified the tubes as TiO
2Àx
C
x
after annealing by
internal diffusion of carbon into the lattice [17]. This pro-
cess resulted in an improved photo-activity during photo-
electrochemical generation of hydrogen, which was
similar to the behavior of carbon modified TiO
2
prepared
by flame pyrolysis [18] or a chemical vapor deposition
method [19–21].
Because of the interesting morphology and the potential
applications, the formation of smooth TiO
2
nanotubes
using the protic non-aqueous organic media could be a
process for further research. It was observed that the repro-
ducibility of the formation of well ordered nanotubular
arrays using a two-electrode configuration was affected
by the experimental conditions, especially water content
of the electrolyte. This aspect has not been addressed in
the available reports mainly because a three electrode con-
figuration with a 1 M KCl Luggin capillary Ag/AgCl refer-
ence electrode was emp loyed in the majority of those
studies, which could have introduced unspecified amount
of water in the electrolyte. Further, anodization for a pro-
longed periods of time >15 h in open-to-laboratory–air
conditions could have resulted in absorption of the mois-
ture leading to nanotube formation. When the anodization
was carried out for a shorte r time in anhydrous polyh ydric
alcohols (water content <0.03 wt %), as no external source
of water could be introduced by using a conventional two-
electrode configuration, the end product varied consider-
ably. The formation of the ordered TiO
2
nanotubes with
smooth surface (ripple free) was affected by the initial water
content of the polyhydric alcohol, relative hum idity, expo-
sure time of the electro lyte to the atmosphere and anodiza-
tion duration. Therefore, initial water content of the
electrolyte was considered to be an issue in getting repro-
ducible results. Furthermore, Macak and Schmuki [11]
reported 12 V as the limiting anodization potential in eth-
ylene glycol; whereas, Paulose et al. [12] anodized at 60 V
using anhyd rous ethylene glycol. These different observa-
tions also could be related to the effect of the water content.
In a very recent communication, Albu et al. [22] reported
growth of 250 lm long TiO
2
nanotubes in ethylene glycol
+0.2 M HF solution at 120 V. The formation of longer
nanotubes at higher voltage without dielectric breakdown
could be attributed to controlled fluoride and water con-
tents. Addition of 0.2 M of 48% HF acted as a source of
water.
As the nanotubes formation was not uniform in the
<300 ppm of water containing ethylene glycol in our preli-
minary investigations, the major focus of this study was to
understand the role of water content in the formation of
ordered TiO
2
nanotubes and to estimate the minimum
amount of water required for obtaining reproducible
results. However, no attempt was made to experiment with
totally water free electrolytes. It should be quickly pointed
out that the anhydrous EG solution would have higher
resistivity than the EG solutions containing water. In
three-electrode configurations, the potential loss due to
IR drop across the cell will be less as the reference electrode
is placed closer to the Ti specimen. On the other hand, the
IR drop will be more in the two-electrode configuration as
the distance between the anode and cathode is relatively
larger and can result in variations of the end products in
the anhydrous solution.
2. Experimental
Sixteen millimeter diameter discs were punched out from
a commercial purity Ti foil (0.2 mm thick). After washing
with soap water, tap water, distilled water and isopropyl
alcohol, these discs were sonicated in acetone for 2 min
and dried before loading on to a PEEK specimen holder.
Anodization was carried out using a two-electrode config-
uration. The electrolytes were: (a) 0.2 wt% NH
4
F dissolved
in anhydrous ethylene glycol (Sigm a–Aldrich, initial water
content <0.03 wt%) with 0, 0.05, 0.13, 0.18, 0.5 and
1.0 wt% water addition. The anode was the Ti disc with
an exposed surface area of 0.7 cm
2
. A Pt flag with
7.5 cm
2
area acted as a cathode. The distance between
the anode and the cathode was maintained at 1 cm. A
DC power source (Agilent Technologies, USA, Model E
3649A) supplied the required potential, typically 20 V, for
anodization. The anodization current was measured using
a multimeter (Hewlett Packard, model 3468 A). The elec-
trolyte has higher affinity to water. In order to minimize
the atmospheric moisture adsorption by the electrolytes,
all the anodization operations (including preparation of
the electrolytes) were carried out inside a dry glove box.
The atmosphere inside the glove box was controlled by
purging with dry argon. The moisture and oxygen level
was maintained at less than 10 ppm. This was ensured by
burning a 25 W incandescent bulb with a pierced glass
envelop (exposing the filament to the glove box atmo-
sphere) for more than 2 h inside the glove box. Care was
taken to ensure that no external water was added during
the experiments . In effect, the salt, glass wares and the elec-
trodes were vacuum dried before use. However, vacuum
drying did not remove the water of crystallization of the
salt. Therefor e, residual amount of water was always avail-
able in the salt as well as in the as-received anhydrous EG.
No extra distillation was carried out to remove the residual
water from the chemicals. It was noted that such residual
water content did not result in the formation of TiO
2
nano-
tubes as described in the following sections. The anodiza-
tion period was rest ricted to only 45 min, which was a
typical time observed in a pH 2.0 aqueous fluoride solution
for growth of $400 nm long TiO
2
nanotubes. Initially, the
anodization runs were carried out by two different poten-
tial application methods, viz, 1. potential stepping method
(wherein the anodization potential of 20 V was applied in a
1070 K.S. Raja et al. / Electrochemistry Communications 9 (2007) 1069–1076
single step (without ramping) and the an odic current was
recorded), and 2. potential sweeping method (where the
potential was scanned from 0 V to 20 V at a rate of
0.1 V/s and the potential was kept constant at 20 V for
45 min). There was no significant difference in the results
(morphology of the nanotubes) observed between these
two potential application techniques. Almost similar
results were observed for anodization of Ti and W in the
aqueous solutions also in our laborat ory. Therefore, only
potential stepping method was followed for all the experi-
ments in this investigation. Three samples were anodized
using the same solution. The anodized specimens were
washed with acetone and ultrasonicated in isopropyl alco-
hol for about 5 min. The dried samples were observed
under a FESEM (S-4700, Hitachi) to record the surface
morphology. Glancing angle X-Ray Diffraction (Philips-
12045 B/3 diffractometer, Cu target (k = 0.154 nm)) and
X-ray photoelectron spectroscopic (XPS; surface science
instruments, Al K a X-ray source) studies were carried
out on a selected group of samples.
3. Results
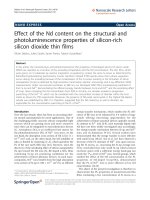
Fig. 1a shows the current transients recorded during
anodization of Ti samples at 20 V in a freshly prepared eth-
ylene glycol solution with addition of different amounts of
water. This experiment is identified as the ‘first-run’. The
initial current density recorded was the highest in anhy-
drous ethylene glycol solution and it decreased with the
addition of water. The behavior of the current transient
in this solution was different from the transient observed
in aqu eous acid fluoride solutions. The typical initial decay
and rise before reaching a steady state value observed in
the aqueous solutions was absent in the ethylene glycol
(EG) + fluoride solutions (hereafter referred to as EG solu-
tions). The anodic current continuously decayed as shown
in the inset of the Fig. 1a. When the current transient was
plotted in log–log scale, three different slopes of current
decay could be observed, presumably denoting different
stages of the anodic oxide layer formation. The initial shal-
low (stage I) current decay of the anhydrous condition
extended for a longer time as compared to the water added
conditions. This indicated faster kinetics of a corrosion
resistant barrier layer formation with water addition. The
current transients were similar when the EG solutions con-
tained more than 0.13 wt% water addition, where a third
stage of cu rrent transient with a slightly shallower slope
of current decay was observed. Typically the initial
slope of the current decay was about À0.1 and the second
stage of the current transient showed a slope of À0.9 to
À1.2. The slope of the third stage of EG solutions with
higher water contents was about À0.3. The EG solutions
with 0–0.13 wt% water addition showed a slightly increas-
ing stage III current transient (as against decaying tran-
sient) after about 35 min of anodization. The current
density at the end of 45 min of anodization at 20 V was
about 1 mA/cm
2
in the case of anhydrous EG solution
and 0.54–0.68 mA/cm
2
with addition of water. These
trends were highly reproducible in the freshly prepared
EG solutions inside the dry glove box.
When the anodization was continued in the same solu-
tion (that has been already used for anodization of one
specimen) with a fresh Ti sample, a slightly different but
distinguishable current trans ient behavior could be noted.
This set of experiments is identified as ‘second run’.
Fig. 1b shows the current transients recorded during the
second run. When the anhydrous EG solution was reused
for anodization, the length of the first stage of the current
transient was similar to that of EG solutions with water
addition. There was no significant difference in the initial
and final current densities between the anhydrous and
water containing EG solutions during the second run.
The third run of the experiments (anodization of the third
0
1
2
3
4
5
6
7
8
9
10
Time, minutes
Current density, mA/cm
2
no-water
0.13w t% water
0.18w t% water
0.5w t% water
1w t% water
log Time
log Current density
I
II
III
01020
30
40
50
Fig. 1a. Current transients during anodization of Ti at 20 V in a freshly
prepared ethylene glycol (EG) + 0.2 wt% NH
4
F solution with different
amounts of water (First run). The inset shows the current transient in log–
log scale.
0
1
2
3
4
5
6
Time, minutes
Current density, mA/cm
2
No water sample 2
0.13% water sample 2
0.18% water sample 2
log Time
log Current density
01020
30
40
50
Fig. 1b. Current transients during anodization of Ti at 20 V in ethylene
glycol (EG) + 0.2 wt% NH
4
F solution with different amounts of water
(Second run). Anodization was carried out in the already used solution of
the experiment shown in Fig. 1a. The inset shows the current transient in
log–log scale.
K.S. Raja et al. / Electrochemistry Communications 9 (2007) 1069–1076 1071
specimen in the electrolyte which has been used for ano diz-
ing two specimens) showed similar current transients irre-
spective of the initial water content of the EG solution.
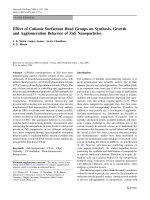
Fig. 2a–f show the surface morphology of the TiO
2
formed during anodization in different conditions. The first
anodization run in a fresh anhydrous EG solution resulted
in an oxide layer of 150–200 nm thick. The surface con-
tained irregular features and no ordered nanopores could
be discernable (Fig. 2a). The second sample anodized in
the same solution showed discrete nanoporous layer; how-
ever there was no complete coverage of the anodized sur-
face with the oxide layer as seen in Fig. 2b. Addition of
0.13 wt% water to the anhydrous EG solution resulted in
formation of ordered nanoporous structure in the first
run as shown in Fig. 2c. As observed from the figure, the
formation of the nanotubes was not uniform throughout
the anodized surface. The second run of anodization in
the 0.13 wt% water content showed well ordered nanotubu-
lar arrays (Fig. 2d). The length of the nanotubes was
around 500–600 nm (not shown in the figure). When the
water content was increased to 0.18 wt%, ordered na no-
tubes could be observed in the first run itself as observed
in Fig. 2e. There was no significant difference in the mor-
phology of the nanotubular arrays between the first and
second anodization runs with 0.18 wt% water content
(Fig. 2 f). Overall, the results of the current transients and
Fig. 2. FESEM images of the TiO
2
nanotubular arrays formed by anodization at 20 V for 45 min in anhydrous ethylene glycol +0.2 wt% NH
4
F solution
with different water contents. The insets are the magnified views of the surfaces.
1072 K.S. Raja et al. / Electrochemistry Communications 9 (2007) 1069–1076
morphological observations showed that a minimum con-
centration of about 0.18 wt% was required to form ordered
nanotubular arrays in the ethylene glycol +0.2 wt% NH
4
F
solution. Reusing the EG solution which was electrolyzed
by previous anodization run resulted in a better nanotubu-
lar morphology than the morphology observed using fresh
EG solution with less than 0.18 wt% water addition. In
fact, a third run of anodization in the initial anhydrous
EG solution showed results similar to those observed with
first run of 0.13 wt% water content. The above results
clearly indicated that the extent of electrolysis of the EG
solution played a significant role in the formation of nano-
tubular TiO
2
arrays. Better reproducibility of the results
with extended anodization period ($16 h) could be associ-
ated with this feature in addition to the possible increase in
the water content due to moisture absorption from the
atmosphere. When the water addition was more than
0.18 wt%, there was no significant change in the morphol-
ogy of the nanotubes. However, the nanotubes formed in
higher water content (>0.5 wt%) showed ridges on the wall
surface and the number of ridges increased with increase in
the water content (not shown here).
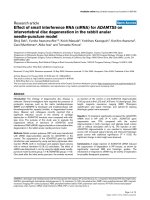
Figs. 3a, 3b and 3c show the high resolution Ti 2p, O 1 s
and F 1 s XPS spectra of samples anodized in the EG solu-
tion with and without water addition. Elemental Ti peak
(453.9 eV) was observed in the sample anodized without
water addition. The anodization was complete with the
addition of 0.18 wt% water (no elemental Ti was observed).
There is a possibility that the elemental Ti peak could have
originated from the substrate because of the possible cracks
in the oxide film. Whatever be the reason, the Ti
0
peak was
observed only in the samples anodized in anhydrous EG
solution indicating that the surface was not fully covered
with an oxide layer. Whereas, specimens anodized in the
EG solution with water addition did not show such Ti
0
peaks. The O 1 s spectra (Fig. 3b) showed a sharp peak
at 530 eV associated with TiO
2
and a shoulder at
531.8 eV. This shoulder was more predominant in the sam-
ple anodized without water addition. The additional shoul-
der could be related to the presence of organic compo unds
with CAOorC@O bonds, possibly (RCOO)
4
Ti type
products. This aspect will be discussed later. Fig. 3c shows
the F 1 s spectra. Two peaks were observed at 684.9 eV and
688.9, s. The peak at 684.8 eV could be related to Ti–F type
compounds, possibly (NH
4
)
2
TiF
6
. Nitrogen peak was also
observed in the XPS spectra (not shown in figures), which
supported the possibility of the above compound. Glancing
angle XRD results poorly matched with the peaks of
ammonium titanium hexafluoride. The second F 1 s peak
at 688.9 eV could be assigned to (CF
2
)
x
type compounds.
The fluoride content of the anodized sample was more in
the anhydrous (no water addition) condition than in the
water added condition. Recently, Macak et al. [23] showed
that the fluoride content could be minimiz ed by thermal
annealing at 450 °C for 3 h.
Ti-2p
0
500
1000
1500
2000
2500
3000
440445450455460465470475
Binding Energy, eV
Counts
no water
0.18% water
2p 3/2
2p 1/2
Ti 453.9
Fig. 3a. Ti 2p XPS high resolution spectrum of the surfaces anodized in 0
and 0.18 wt% water addition in EG + 0.2 wt% NH
4
F solution. The peak
at 458.7 eV is associated with Ti
4+
ions. A small peak at 453.9 eV indicates
presence of unoxidized Ti metal in the sample anodized in the EG solution
without water addition.
O 1s
0
500
1000
1500
2000
2500
3000
3500
4000
4500
520525530535540545
Binding Energy, eV
Counts
no water
0.18wt%
Fig. 3b. O 1 s XPS high resolution spectrum of the surfaces anodized in 0
and 0.18 wt% water addition in EG + 0.2 wt% NH
4
F solution. The peak
at 530 eV is attributed to TiO
2
. A wider shoulder starting at 531.8 eV
could be related to CAOorC@O bonds.
F 1s
3000
3500
4000
4500
5000
5500
675680685690695700
Binding Energy, eV
Counts
No wa te r
0.18wt% water
Fig. 3c. F 1 s XPS high resolution spectrum of the surfaces anodized in 0
and 0.18 wt% water addition in EG + 0.2 wt% NH
4
F solution. The peak
at 684.8 eV could be associated with Ti–F compounds. The second peak at
around 688.3 eV could be related possibly to (CF
2
)
x
compounds.
K.S. Raja et al. / Electrochemistry Communications 9 (2007) 1069–1076 1073
4. Discussion
The electrochemical oxidation of ethylene glycol in
acidic and basic media has been investigated widely [24–
26]. In the aqueous solution, the oxidation of ethylene gly-
col involves the following reaction steps: [25]
Ethylene Glycol ! Glycolaldehyde
! Glyox al or Glycolic acid
! Glyox ylic Acid ! Oxalic acid
! Car bon dioxide: ð1Þ
In acid media, predominant formation of glycolaldehyde
(CH
2
OH–CHO) and glycolic acid (CH
2
OH–COOH) inter-
mediates has been observed by in situ IR spectroscopy [25].
However, in water free conditions the oxidation mecha-
nism could be different depending on the supporting elec-
trolyte and the electrode surface. Addition of water,
which is considered as a nucleophile, increases the reaction
rate during electrochemical oxidation. Fig. 4, cyclic vol-
tammograms of EG + 0.2 wt% NH
4
F solution carried
out using two platinum electrodes at different water con-
tents also supported this. The oxidation potentials de-
creased with increase in the water content. The potentials
were measured with reference to a Pt wire. Wieland et al.
[25] observed a substantial amount of production of gly-
colic acid during the oxidation of ethylene glycol (with
0.1 M HClO
4
supporting electrolyte) at 0.3 V vs. SCE.
The increase in the anodic current above 0.8 V
Pt
in the case
of 0.18 wt% water addition of this investigation could be
associated with such oxidation process (Fig. 4). A signifi-
cant anodic current was observed only above 1.5 V in the
anhydrous condition. The cyclic voltammograms of EG
solution with water addition revealed a minor cathodic cur-
rent wave at around 0.5 V during the reverse scan. Such a
cathodic wave was absent in the anhydrous EG solution.
The cathodic peak could be attributed to desorption of
the hydroxyl species from the Pt surface following the
reaction:
Pt=OH þ H
þ
þ e
À
! Pt þ H
2
O ð2Þ
Presence of such reduction wave indicated availability of
H
+
ions closer to the electrode surface. The CV result in
the anhydrous EG (no water addition) underlined the
importance of the water addition to create local acidified
condition. A critical concentration of H
+
ions has been
considered a requirement for the formation of the TiO
2
nanotubes [14,15]. Similarly, availability of oxygen also is
an important consideration for the formation of an anodic
oxide layer.
In the aqueous solutions, the hydroxyl ions are consid-
ered source of the oxygen for oxide formation according
to the reactions:
H
2
O ! H
þ
þ OH
À
ð3aÞ
2OH
À
! O
2À
þ H
2
O ð3bÞ
M ! M
nþ
þ ne
À
ð3cÞ
M
nþ
þ 0:5nO
2À
! MO ð3dÞ
Availability of the oxygen from organic solutions has been
considered difficult because it is strongly bound to the car-
bon atom by a double bond. Removal of the oxygen from
carbon to react with the metal surface is considered unli-
kely [27]. On the other hand, Ue et al. [28] observed organic
anion acted as source of oxygen. These au thors anodized
aluminum in anhydrous triethylmethylammonium hydro-
gen maleate/c-butyrolactone solution and their surface
analysis revealed maleate anion as the source of oxygen
to form a composite aluminum oxide film. Tajima et al.
[29] also observed an organic anion (HCONH
À
) partici-
pated in the formation of an organo-metallic type interme-
diate which eventually resulted in an oxide film during
anodization of aluminum in boric acid–formamide
solution.
In a salt-containing non-aqueous solution, passivation
of metal has been considered to occur either by a re-precip-
itated salt layer composed of dissolved metal cation and
anion of the salt or by a monolayer of the oxidized species
of the solvent molecule chemisorbed on to the surface [27].
For example, in acetonitrile/anhydrous HF media, nickel
was passivated by a thick layer of NiF
2
[30]. Trace levels
of water increased the passivity, especially in the acidified
organic solutions [31]. Presence of water, in the acidified
organic solutions has been considered to form an oxide film
in addition to the salt layer.
In this investigation, the focus was on the formation
of nanotubular titanium dioxide arrays and not on the
passivation of Ti by a salt layer or an oxide film mecha-
nism. The important point that required to be clarified
was, whether water addition was an absolute necessity
-1.0E-03
0.0E+00
1.0E-03
2.0E-03
3.0E-03
4.0E-03
5.0E-03
-2024681012
Potential, V
(Pt)
Current, A
no-water
0.13%H2O
0.18% H2O
Fig. 4. Results of cyclic voltammetry (CV) conducted on two equal area
platinum electrodes in ethylene glycol +0.2 wt% NH4F solutions with
different water contents inside a dry argon filled glove box. The scan rate
was 10 mV/sec. The inset shows the zoomed in view of the CV at lower
potentials where a reduction peak was not observed in the anhydrous EG
solution.
1074 K.S. Raja et al. / Electrochemistry Communications 9 (2007) 1069–1076
to form TiO
2
nanotubes or the oxidized products of eth-
ylene glycol was sufficient to form TiO
2
. The analyses of
the results of this investigation indicated that a minimum
of 0.18 wt% water addition was required to form an
ordered nanotubular TiO
2
arrays. Similar nanotubular
formation could be obtained without water addition, if
the anhydrous EG is electrolyzed at 20 V for >2 h using
Ti anode (longer anodization times). Therefore, without
water addition, the predominant oxide forming mecha-
nism could be consumption of the air form ed film of
Ti as the oxygen source according to the anodic reactions
(4a)–(4c) and (4d):
2ðCH
2
OHÞ
2
þ TiO
2
ðair formed film Þ
! Ti=2ðCOOH À CH
2
OHÞþ4H
þ
þ 4e
À
ð4aÞ
COOH À R !ðR À COOÞ
À
þ H
þ
þ e
À
ð4bÞ
Ti þ 4ðR À COOÞ
À
!ðRCOOÞ
4
Ti þ 4e
À
ð4cÞ
ðRCOOÞ
4
Ti ! TiO
2
þ CO
2
þ nH
þ
þ ne
À
ð4dÞ
Presence of elemental Ti in the anhydrous condition
(Fig. 3a implying incomplete reaction steps) and an extra
shoulder in the O 1 s XPS spectra support the above reac-
tion steps. More analyses should be carried out to unde r-
stand the complete mechanism. Preliminary ex situ FTIR
and GA-XRD analyses did not yield any useful informa-
tion. More of in situ analytical experiments need to be
performed. Formation of the ordered nanotubes during
the ‘third run’ of anodization indicated the influ ence of lo-
cal acidic conditions (formation of glycol ic acid). Presence
of RCOO
À
, which was also a nucleophile like water [26],
could facilitate oxidation reactions. Macak and Schmuki
[15] illustrated the necessity of localized low pH condition
for growth of longer nanotubes in the viscous organic
solutions. When the pH of the bulk fluoride containing
solution was low (for example in phosphoric acid, acetic
acid, oxalic acid etc.), the dissolution rate of TiO
2
was re-
ported to be high [32] and therefore could limit the steady
state length of the nanotubes. In the EG solution, the
walls of the nanotubes were considered to be in the pas-
sive state. The concentration of the H
+
ions was higher
only at the bottom of the nanotubes causing controlled
dissolution. In this investigation, the dissolution was as-
sumed to be electric field assisted, so that the negatively
charged cation vacancies created by the dissolution moved
with the field and reached the metal/oxide inter face. These
cation vacancies were consumed at the metal/oxide inter-
face to form new oxide lattices according to the point de-
fect model [33]. Therefore, dissolution of the bottom of
the nanotubes (barrier layer) resulted in movement of
the metal/oxide interface into the metal substrate and pas-
sive walls of the nanotubes manifested into vertical growth
of the nanotubes. Almost similar results were obtained in
the glycerol +0.2 wt% NH
4
F solutions. In this solution
also 0.18 wt% water addition was found to give reproduc-
ible result of formation of TiO
2
ordered nanotubular
arrays.
5. Conclusions
Anodizations of Ti foil in the anhydrous ethylene glycol
+0.2 wt% NH
4
F solution (EG solution) with 0–1 wt% water
additions were carried out at 20 V for 45 min in a dry-argon
filled controlled atmosphere glove box. Bas ed on the exper-
imental results, the following conclusions are drawn:
A minimum amount of 0.18 wt% of water addition was
required to form a well ordered TiO
2
nanotubular
arrays.
When the anhydrous EG solution was reused for third
time, ordered arrays of nanotubes started to form.
Increase in the water content of the EG solution
(>0.5 wt%) showed increased amount of ridges on the
circumference of the nanotubes.
XPS results showed presence of un-anodized Ti element
in the anhydrous condition and presence of organic and
(NH
4
)
2
TiF
6
type compounds in all the anodized samples
in addition to the regular TiO
2
phase.
The results underline the influence of water content and
local pH condition to form the ordered nanotubular
arrays.
Acknowledgement
This work was supported by US Department of Energy
through the co ntract No. DE-FC 52-98NV13492 and DE-
FC-36-06G086066.
References
[1] V. Zwilling, M. Aucouturier, E. Darque-Ceretti, Electrochim. Acta 45
(1999) 921.
[2] K.S. Raja, M. Misra, V.K. Mahajan, T. Gandhi, P. Pillai, S.K.
Mohapatra, J. Power Sources 161 (2006) 1450–1457.
[3] K.S. Raja, V.K. Mahajan, M. Misra, J. Power Sources 159 (2006)
1258–1265.
[4] J.M. Macak, H. Tsuchiya, A. Ghicov, P. Schmuki, Electrochem.
Commun. 7 (2005) 1138.
[5] P. Pillai, K.S. Raja, M. Misra, J. Power Sources 161 (2006) 524–530.
[6] M. Paulose, O.K. Varghese, G.K. Mor, C.A. Grimes, Nanotechnol-
ogy 17 (2006) 398.
[7] T. Gandhi, K.S. Raja, M. Misra, Electrochim. Acta 51 (2006) 5932–
5942.
[8] K.S. Raja, M. Misra, K. Paramguru, Mater. Lett. 59 (2005) 2137–
2141.
[9] A. Kar, K.S. Raja, M. Misra, Surf. Coat. Technol. 201 (2006) 3723–
3731.
[10] J.M. Macak, H. Tsuchiya, L. Taveria, A. Ghicov, P. Schmuki, J.
Biomed. Mater. Res. 75A (2005) 928.
[11] J.M. Macak, H. Tsuchiya, S. Bauer, A. Ghicov, P. Schmuki, P.J.
Barczuk, M.Z. Nowakowska, M. Chojak, P.J. Kulesza, Electrochem.
Commun. 7 (2005) 1417.
[12] A. Ghicov, H. Tsuchiya, J.M. Macak, P. Schmuki, Electrochem.
Commun. 7 (2005) 505–509.
[13] J.M. Macak, H. Tsuchiya, L. Taveira, S. Aldabergerova, P. Schmuki,
Angew. Chem., Int. Ed. 44 (2005) 7463–7465.
[14] K.S. Raja, M. Misra, K. Paramguru, Electrochim. Acta 51 (2005)
154–165.
K.S. Raja et al. / Electrochemistry Communications 9 (2007) 1069–1076 1075
[15] J.M. Macak, P. Schmuki, Electrochim. Acta 52 (2006) 1258–1264.
[16] M. Paulose, K. Shankar, S. Yoria, H.E. Prakasam, O.K. Varghese,
G.K. Mor, T.A. Latempa, A. Fitzgerald, C.A. Grimes, J. Phys.
Chem. B 110 (2006) 16179–16184.
[17] S.K. Mohapatra, M. Misra, V.K. Mahajan, K.S. Raja, J. Catal., in
press.
[18] S.U.M. Khan, M. Al-Shahry, M. Ingler, Science 297 (2002) 2243–
2245.
[19] M. Misra, K.S. Raja, V.K. Mahajan, S.K. Mohapatra, In solar
hydrogen and nanotechnology, in: Lionel Vayssieres (Ed.),
Proceedings of the SPIE Conference, vol. 6340, 2006, Paper:
6340-OI.
[20] A. Ghicov, J.M. Macak, H. Tsuchiya, J. Kunze, V. Haeublein, L.
Frey, P. Schmuki, Nanoletters 6 (2006) 1080.
[21] J.H. Park, S. Kim, A. Bard, Nanoletters 6 (2006) 24.
[22] S.P. Albu, A. Ghicov, J.M. Macak, P. Schmuki, Phys. Stat. Sol.
(RRL) 1 (2007) R65–R67.
[23] J.M. Macak, S. Aldabergerova, A. Ghicov, P. Schmuki, Phys. Stat.
Sol. 203 (2006) R67–R69.
[24] K. Matsuoka, Y. Iriama, T. Abe, M. Matsuoka, Z. Ogumi, J.
Electrochem. Soc. 152 (2005) A729–A731.
[25] B. Wieland, J.P. Lancaster, C.S. Hoaglund, P. Holota, W.J. Torn-
quist, Langmuir 12 (1996) 2594–2601.
[26] O. Hammerich, B. Svensmark, in: H. Lund, M.M. Baizer (Eds.),
Organic Electrochemistry, Marcel Dekker Inc., New York, 1991, pp.
638–641.
[27] R.G. Kelly, P.J. Moran, J. Kruger, C. Zollman, E. Gileadi, J.
Electrochem. Soc. 136 (1989) 3262–3269.
[28] M. Ue, H. Asahina, S. Mori, J. Electrochem. Soc. 142 (1995) 2266–
2271.
[29] S. Tajima, N. Baba, T. Mori, Electrocim. Acta 9 (1964) 1509–
1519.
[30] M. Noel, S. Chidambaram, J. Fluorine Chem. 68 (1994) 121–129.
[31] N. Hackerman, E.S. Snavely, L.D. Fiel, Electrochim. Acta 12 (1967)
535.
[32] Y. Fovet, J Y. Gal, F. Toumelin-Chemla, Talanta 53 (2001) 1053–
1063.
[33] D.D. Macdonald, J. Electrochem. Soc. 139 (1992) 3434.
1076 K.S. Raja et al. / Electrochemistry Communications 9 (2007) 1069–1076