- Trang chủ >>
- Khoa Học Tự Nhiên >>
- Vật lý
effects of dimensions on the sensitivity of a conducting polymer microwire sensor
Bạn đang xem bản rút gọn của tài liệu. Xem và tải ngay bản đầy đủ của tài liệu tại đây (516.32 KB, 9 trang )
Effects of dimensions on the sensitivity of a conducting polymer
microwire sensor
Cheng Luo
Ã
, Anirban Chakraborty
a
Institute for Micromanufacturing, Louisiana Tech University, 911 Hergot Avenue, Ruston, LA 71272, USA
article info
Article history:
Received 26 August 2008
Received in revised form
20 November 2008
Accepted 24 November 2008
Keywords:
Conducting polymers
Microwire sensors
Surface-to-volume ratio
Sensitivity
Intermediate-layer lithography
abstract
It is commonly considered that the sensitivity of a microsensor increases with its increasing surface -to-
volume ratio. However, it is not exactly clear how the surface-to-volume ratio affects the sensitivity of a
conducting polymer microsensor. The change in any of the three geometrical dimensions (i.e., length,
width and thickness) of a microsensor changes the surface-to-volume ratio. In designing a microsensor
of desired sensitivity, it is important to know the effect of each dimension on the sensitivity for properly
defining the sizes and shapes of the microsensor. As such, in this work, we have investigated the effects
of each individual dimension on the sensitivity of a conducting polymer microwire sensor. Polypyrrole
(PPy) and Poly (3,4-dimethlydioxythiophene) poly(styrenesulfonate) (PEDOT–PSS) microwire sensors of
different dimensions were fabricated using an intermediate-layer lithography (ILL) method. They were
further employed to detect methanol and acetone vapors at concentrations in the range of 0.6–7.1 parts
per thousand (ppt). The corresponding three relationships between the three geometrical dimensions
and the sensitivities were found using a statistical program, SAS. From the point view of surface-to-
volume ratio, the thickness should affect the sensitivity much more than the other two dimensions.
However, the th ree relationships indicate that the effects of the three geometrical dimensions on the
sensitivity of a microwire sensor vary with the conducting polymer materials and the targets to detect.
In other words, which dimension has more effects on sen sitivity is case-dependent. Results presented in
this work can be potentially used to aid in the design of conducting polymer microwire sensors of high
sensitivity.
& 2008 Elsevier Ltd. All rights reserved.
1. Introduction
Conducting polymers have received much attention since their
discovery in 1977. Applications of conducting polymer micro-
systems span from electronic devices to biological and chemical
sensors. Conducting polymers offer some unique advantages like
low weight, easy tailoring of properties and a wide spectrum of
applications [1–3]. The conducting polymers produce changes in
color, mass, work function and conductivity when exposed
to different chemicals [4]. A commonly used sensing mechanism
is through conductivity measurements of an exposed polymer
film [5]. The corresponding operating principle is the resistance
change of a conducting polymer film upon exposure to a
particular chemical analyte. Most conducting polymers respond
to the exposure of an analyte with a unique change in
conductivity. This response is reversible with original behavior
recovered as soon as the exposure is stopped. The adsorption/
desorption-related conductivity changes normally occur at
room temperature. These so-called ‘‘chemiresistors’’ are easier to
implement experimentally [6–9]. Two of the most commonly
used conducting polymers are Polypyrrole (PPy) [8,10–18]
and Poly (3,4-dimethlydioxythiophene) poly(styrenesulfonate)
(PEDOT–PSS) [5,7,9,19]. These polymers have been used to sense
for various chemical analytes including water vapor [5,9,10,18],
volatile organic gases [5,7,8,11–13,16,18,19] (such as methanol,
acetone, alcohol, and ethanol), industrial gases [14] (such as
ammonia, NO
x
,CO
x
,SO
2
,H
2
S, O
2
and H
2
), glucose [15], and
antigens [17].
Compared to film sensors, microsensors generally have
exhibited higher sensitivity in detecting analytes of low concen-
trations. It is normally considered that the higher sensitivity is
induced by the higher surface-to-volume ratio of the micropat-
terns. However, it is not exactly clear how the surface-to-volume
ratio affects the sensitivity of a conducting polymer microsensor.
A recently developed intermediate-layer lithography (ILL) enables
us to properly fabricate conducting polymer microsensors. There-
fore, in this work, PPy and PEDOT–PSS microwires of different
dimensions have been fabricated using the ILL method and
subsequently applied to detect methanol and acetone vapors of
concentrations in the range of 0.6–7.1 parts per thousand (ppt).
ARTICLE IN PRESS
Contents lists available at ScienceDirect
journal homepage: www.elsevier.com/locate/mejo
Microelectronics Journal
0026-2692/$ -see front matter & 2008 Elsevier Ltd. All rights reserved.
doi:10.1016/j.mejo.2008.11.064
Ã
Corresponding author. Current address: Department of Mechanical and
Aerospace Engineering, University of Texas at Arlington, 500 W First Street,
Arlington, TX 76019, USA. Tel.: +1817 272 7366; fax: +1817 272 5010.
E-mail address: (C. Luo).
Microelectronics Journal ] (]]]]) ]]]–]]]
Please cite this article as: C. Luo, A. Chakraborty, Effects of dimensions on the sensitivity of a conducting polymer microwire ,
Microelectron. J (2009), doi:10.1016/j.mejo.2008.11.064
The microwire response was also compared with the response of a
square film (1 cm  1 cm). The corresponding relationships
between the three geometrical dimensions and the sensitivities
were found using a statistical program, SAS, to find the effects of
each individual dimension.
The outline of this work is as follows. Section 2 discusses the
detection principle of the conducting polymer film and microwire
sensors. In Section 3, the fabrication of the conducting polymer
microwires of various dimensions is detailed with experimental
results. The experimental setup for detecting methanol and
acetone vapors is presented in Section 4. Section 5 compares the
sensing results of conducting polymer film and microwire sensors.
In Section 6, the effects of each individual dimension of a sensor
on the sensitivity are addressed. This work is finally summarized
and concluded in Section 7.
2. Sensing principles
In this section, we first show that the sensitivity of a
conducting polymer microsensor actually depends on the
sensitivity of a unit block, and then discuss ways to increase the
sensitivity of the unit block. As what has been done by many
researchers [8,10–13,17,18], the sensitivity index (SI) is defined as
(R
exposure
ÀR
Base
)/R
Base
, where R
Base
and R
exposure
represent the
resistances of a sensor before and after exposure to a target,
respectively. The SI indicates how large the sensor response is
to a particular concentration, and is used as a measure of the
sensitivity of the corresponding sensor.
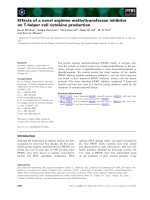
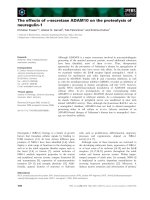
Geometrically, the sensing area of a film sensor can be
modeled to be made up of multiple microwires of unit width,
connected in parallel between the opposite edges at the electro-
des. These microwires may be further divided into blocks of unit
top area along the entire length (Fig. 1). These blocks of unit area
may be regarded as individual ‘‘chemiresistor’’ elements with the
base resistance r
Base
i;j
, which respond to the various concentrations
of analytes with unique changes in conductivity. These ‘‘chemir-
esistor’’ blocks may be treated to be electrically connected in a
serial fashion between the opposite electrodes. Let the resistance
of the block be r
0
i,j
upon exposure to an analyte. Therefore, the SI
for this block would be (r
0
i,j
Àr
Base
i;j
)/r
Base
i;j
. If the microwire is divided
into ‘‘n’’ identical blocks, the total base resistance of a single
microwire would be n  r
Base
i;j
. Upon exposure to analyte, the
resistance would be n  r
0
i,j
. As there are ‘‘m’’ identical microwires
connected in parallel, the overall base resistance would be
(n/m) Â r
Base
i;j
and the resistance upon exposure to analyte would
be (n/m) Â r
0
i,j
. The SI for the film sensor would be
ð
D
R=RÞ
Total
¼ f½ðn=mÞÂr
0
i;j
Àðn=mÞÂr
Base
i;j
=½ðn=mÞÂr
Base
i;j
g
¼ð
D
R=RÞ
Block
. (1)
It is observed from Eq. (1) that the SI of a film sensor equals that
of a single unit block, which does not depend on how many unit
blocks this film sensor has.
In deriving Eq. (1) for a film sensor, it is assumed that the unit
blocks have the same sensitivity. This assumption holds when the
top surface of the film is much larger than the side surfaces.
During the detection, a film sensor has five surfaces exposed to a
target: the top and four side surfaces. The bottom surface
interfaces with the substrate, and is not exposed to a target.
Since the top surface is much larger than the four exposed side
surfaces, most of the unit blocks only get exposed to a target
through their top surfaces of unit area. That is, most blocks get the
same exposure to a target. Furthermore, these unit blocks have
the same geometry. Therefore, Eq. (1) is reasonably true. In the
case of, for example, microwire sensors, the sizes of the top
surface may be comparable with those of the side surfaces. Unit
blocks located at the edges of the sensors get more exposure to a
target than those in the central area of the sensor. The unit bocks
may have different sensitivities. Accordingly, the assumption in
deriving Eq. (1) may not hold. In this case, the surface-to-volume
ratio should be considered to address the average sensitivities of
the unit blocks. This ratio means that how much surface of a
block, which has a unit volume, is exposed to a target. In principle,
more exposed surface implies that the block should be more
affected, having higher sensitivity.
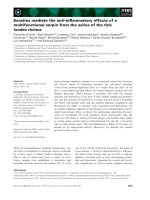
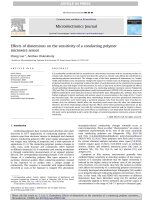
Consider a rectangular pattern, which has a length a, a width b,
and a thickness t (Fig. 2). The sensing surface area is
(a  b+2  a  t+2  b  t). The volume of the film is (a  b  t).
Therefore, the surface-to-volume ratio is (1/t+2/a+2/b). It can be
seen that this ratio increases with decrease in length, width and
thickness. For a microsensor fabricated out of thin films, which
normally have thicknesses ranging from tens of nanometers to
several microns, the width and length are generally above 10
m
m
and much larger than the thickness. As such, 1/t is much larger
than 2/a and 2/b. In other words, the changes of a and b do not
affect the ratio much for a fixed t. For example, when t ¼ 1
m
m,
a ¼ 10
m
m and b ¼ 10
m
m, the ratio is 1.4
m
m
À1
. The reduction of
both a and b by half yields a new ratio of 1.8
m
m
À1
, while the
reduction of t by half leads to a new ratio of 2.4
m
m
À1
. In short, the
thickness is the most important dimension among the three in
affecting surface-to-volume ratio. In this work, we explored the
effects of the surface-to-volume ratio on the sensitivity of a
microsensor. We further examined the effects of each individual
dimension on the sensitivity of a microsensor. We particularly
ARTICLE IN PRESS
Base
r
i, j
Contacts
Sensin
g
area
1 i2
n
Unit block
m
2
3
1
j
Microwire
Fig. 1. Schematic view of the relationship between a film sensor and individual unit blocks.
a
b
t
Fig. 2. The dimensions of a micropattern.
C. Luo, A. Chakraborty / Microelectronics Journal ] (]]]]) ]]]–]]]2
Please cite this article as: C. Luo, A. Chakraborty, Effects of dimensions on the sensitivity of a conducting polymer microwire ,
Microelectron. J (2009), doi:10.1016/j.mejo.2008.11.064
studied microwire sensors, whose lengths were much larger than
the widths. A microsensor may also have a rectangular shape, i.e.,
the length is about the same as the width. If the length is large, the
corresponding surface-to-volume ratio is larger than that of a
microwire sensor. When the length is small, it is not easy to make
a contact to the sensor. As such, microwire sensors became the
focus of this work.
3. Fabrication of PPy and PEDOT–PSS microwires
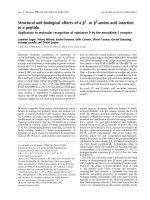
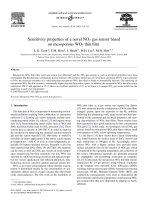
Conducting polymer micropatterns were generated using the
ILL method [20–22] as follows (Fig. 3): (i) a layer of multiple
conducting polymer coatings and a layer of a non-conducting
polymer polymethyl methacrylate (PMMA) are heated up to the
printing temperature, which is above the glass transition
temperatures (T
g
) of all polymers (Fig. 3a), (ii) a Si mold of
desired patterns and the substrate are brought into physical
contact by applied pressure, followed by subsequent cooling
(Fig. 3b), and (iii) they are separated when their temperatures
are below the lowest T
g
of all polymer materials, completing the
pattern transfer from the mold to the conducting polymer
layer (Fig. 3c). The three-step patterning process of the ILL is
identical to that of the hot-embossing process [23]. The critical
difference is that the substrate in the hot-embossing process has
only the layer of the material to be printed, while the substrate in
the ILL approach involves an additional intermediate layer
of a non-conducting polymer. As a result of this difference,
the conducting polymer patterns would be electrically isolated
over the insulating intermediate layer, and patterns would be
imprinted on the conducting polymer layer even if there were
height differences existing between the features of the mold
[20–22].
PMMA was chosen as the intermediate-layer material, because
it is a good hot-embossing material. The PMMA has small thermal
expansion coefficient of $5.0 Â 10
À5
1C
À1
and a small pressure
shrinkage coefficient of $3.8 Â 10
À7
psi
À1
[24]. Its T
g
is around
105 1C. PPy (Sigma Aldrich Co.) and PEDOT–PSS (Baytron Co.) were
used as received (5 wt% PPy in water and 1–1.4 wt% PEDOT–PPS in
water) from the manufacturers. Their thin layers were generated
by spin-coating the corresponding solutions on the PMMA sheet.
Before coating the conducting polymers over the PMMA, all
polymer solutions were kept in an ultrasonic bath for 1 h to
remove any aggregate formation in solution from prolonged
storage. The top surface of PMMA was treated with O
2
plasma (at
300 W watts for 45 s) to make it hydrophilic such that the water
soluble conducting polymer solutions could be spin-coated over
it. The key fabrication parameters in ILL are imprinting tempera-
ture, imprinting force and imprinting time. The imprinting
temperature was chosen to be higher than T
g
of PMMA and lower
than T
g
of PPy and PEDOT–PSS in order to reduce thermal effects
on these conducting polymers. The mold was slowly inserted into
the substrate to avoid the dynamic effects in the embossed
polymer. The silicon molds were fabricated using conventional
ultraviolet lithography and deep reactive ion etch. The embossing
temperature and pressure were 150 1C and 50 MPa, respectively.
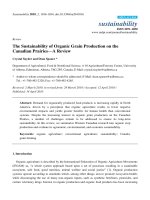
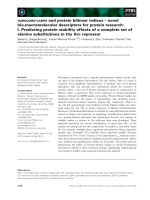
Fig. 4 shows a representative set of generated PPy microwires
which have been used for sensing. Every sensor comprised six PPy
or PEDOT–PSS microwires which were connected in parallel.
Ag epoxy was placed at the two ends of these microwires as
contact pads for electrical connection. The dimensions of micro-
wires were changed to vary the surface-to-volume ratios of the
microwires. One type of film and five types of microwire sensors
were fabricated using the ILL method for either conducting
polymer. Tables 1 and 2 give the corresponding dimensions of
these sensors.
ARTICLE IN PRESS
Si mold
Conducting
polymer layer
Intermediate polymer
layer
PMMA substrate
Convex mold
structure
Concave mold
structure
Fig. 3. The three-step procedures to fabricate polymeric patterns using the proposed ILL method: (a) heating of the substrate, (b) insertion of the mold into the two polymer
layers, and (c) separation of the mold and the substrate.
Overall embossed area
100µm
PMMA substrate
PPy
Fig. 4. (a) Perspective and (b) close-up (optical) views of PPy sensors generated on a PMMA sheet. Each PPy microwire has a width of 50
m
m and a length of 2000
m
m.
C. Luo, A. Chakraborty / Microelectronics Journal ] (]]]]) ]]]–]]] 3
Please cite this article as: C. Luo, A. Chakraborty, Effects of dimensions on the sensitivity of a conducting polymer microwire ,
Microelectron. J (2009), doi:10.1016/j.mejo.2008.11.064
4. Experimental setup for detection
The experimental setup (Fig. 5) consisted of an air-tight
chamber. All the tested sensors were placed at the same location
inside the chamber, and the two contact wires for each sensor
were taken out and connected to a Keithley probe station for
I–V measurements. The humidity and temperature of the chamber
were maintained at the room level and kept constant. After the
chamber was closed, the sensor current was measured at 10 V to
determine the base resistance. PPy and PEDOT–PSS microwires
were exposed to methanol and acetone vapors, respectively, since
they were sensitive to these two vapors, respectively. Methanol of
a known volume was introduced into the chamber in a liquid form
(as a droplet) using a micro-liter syringe. The same applied to
acetone. The methanol droplet evaporated in 5–10 s. After the
methanol droplets had evaporated completely, the current of a
sensor was measured at 10 V continuously for 180s. Similarly,
when acetone was introduced in the experimental chamber as a
droplet, it evaporated in 2–4 s. After the methanol droplet had
evaporated completely, the sensor current was monitored con-
tinuously for 120 s. The observation time was reduced from 180 s
for methanol to 120 s for acetone, since according to preliminary
tests the PEDOT–PSS sensors responded to acetone exposure
within 120 s. After a test, the chamber was purged by nitrogen and
vented. For the next round of testing, the chamber was closed and
the above procedure was repeated for detecting vapors of different
concentrations.
The masses of methanol and acetone were calculated from
their known volumes (i.e., the evaporated volumes) and their
densities at room temperature. The mass of air was calculated
from the known volume (i.e., the volume of the chamber) and the
density of air at room temperature. The concentration of the
methanol was calculated from the ratio between the mass of
methanol and that of air inside the test chamber. The same
applied to acetone. The concentrations of methanol vapor ranged
from 1.3 to 6.4 ppt. This range of methanol concentrations was
about the same as the one reported in [8], which varied from
about 1.5–5.0 ppt. The detection of methanol of lower concentra-
tions (0.049–1.059 ppt) was reported in [13]. The acetone
concentration of this work was varied from 0.6 to 5.8 ppt, which
was lower than the concentration of 12.7 ppt considered in [7]
(that is, 5% of acetone vapor pressure at 21 1C) and below the
range of 104–416 ppt in [19].
5. Sensing results
5.1. Exposure of PPy sensors to methanol vapor
When the PPy film and microwire sensors were exposed to
methanol vapor, response currents at 10 V varied with time in a
wave-like form (Fig. 6). For the microwire sensors of different
surface-to-volume ratios, the peak currents were reached be-
tween 60 and 120 s after the methanol droplet had evaporated,
and the response current varied between 1.5 Â 10
À7
and
1.65Â 10
À7
A(Fig. 6a). Accordingly, the resistances varied between
6.67 Â 10
7
and 5.99 Â 10
7
O
. Such a resistance included Ag–PPy–Ag
contact resistance and intrinsic resistance of PPy wire. As
indicated in [8], Ag–PPy–Ag contact was ohmic. The measured
contact resistance was 1.21 Â10
5
O
. Therefore, the contact resis-
tance could be neglected, and the intrinsic resistance of the PPy
wire dominated the detected resistance. The same applied to the
case of PPy films. In addition, as examined in [25], the Ag–PEDOT/
PSS–Ag contact was also ohmic. The measured contact resistance
ARTICLE IN PRESS
Table 1
Dimensions of the PPy sensors used in the tests.
PPy Width
(
m
m)
Length
(
m
m)
Thickness of
PPy layer
(
m
m)
Surface-to-
volume ratio
(
m
m
À1
)
Film 10,000 10,000 0.19 5.155
Microwire Type I 300 5000 0.19 5.162
Microwire Type II 100 5000 0.19 5.175
Microwire Type III 100 2000 0.19 5.176
Microwire Type IV 100 2000 0.13 7.655
Microwire Type V 100 2000 0.25 3.974
Table 2
Dimensions of the PEDOT–PSS sensors using in the tests.
PEDOT–PSS Width
(
m
m)
Length
(
m
m)
Thickness of
PEDOT–PSS
layer (
m
m)
Surface-to-
volume ratio
(
m
m
À1
)
Film 10,000 10,000 0.30 3.334
Microwire Type I 300 5000 0.30 3.340
Microwire Type II 100 5000 0.30 3.353
Microwire Type III 100 2000 0.30 3.354
Microwire Type IV 100 2000 0.21 4.783
Microwire Type V 100 2000 1.15 0.890
N
2
inlet
N
2
outlet
Test
chamber
µL
syringe
Keithley probe station
N
2
outlet
N
2
inlet
Microwire
sensor
Fig. 5. Experimental setup to determine the sensitivity of PPy and PEDOT–PSS sensors in detecting methanol and acetone, respectively.
C. Luo, A. Chakraborty / Microelectronics Journal ] (]]]]) ]]]–]]]4
Please cite this article as: C. Luo, A. Chakraborty, Effects of dimensions on the sensitivity of a conducting polymer microwire ,
Microelectron. J (2009), doi:10.1016/j.mejo.2008.11.064
was 5.00 Â10
3
O
. Hence, the effect of contact resistance was also
neglected in considering the PEDOT/PSS sensors. For the PPy
film sensor, the response current reached a peak between 120
and 160 s, and the response current varied between 5 Â10
À7
and
5.29 Â10
À7
A(Fig. 6b). The corresponding resistances varied
between 2.00 Â10
7
and 1.89 Â 10
7
O
. The transient nature of the
response current was due to the fact that the methanol molecules
were not stationary on the sensor causing the peak in the current.
After the methanol droplet evaporated, it diffused inside the
chamber and reached the sensors dynamically. The response
current first increased and then decreased. The reason for this
increase in response current may be attributed to the fact that
methanol is a polar molecule which helps in interchain electron
transfer in PPy. Also, the small size of the methanol molecules
helped it to diffuse into the polymer chain more effectively, thus
aiding conduction. The whole behavior was similar to the PPy
response to humidity [18]. As the response current reached a
maximum, the methanol vapor diffused out of PPy, since the
methanol concentration in the PPy microwires was higher than
that in the environment. This caused the decrease in the current.
The time to reach the peak current was defined as the response
time. Accordingly, microwire sensors have a shorter response time
than film sensors. The same transient phenomenon of the
response current was also found, for example, in [8] during the
initial exposure of PPy films to methonal. The current had a rapid
increase of more than two orders of magnitudes during the first
20 s of exposure and reached to a maximum value after 60 s [8].
The current settled down to a steady value below the maximum.
Methanol was continuously supplied to a PPy sensor in [8]. This
made the concentration of the methanol around the sensor was
higher than that of our case, which did not provide continuous
supply of the methanol. Therefore, the steady current obtained in
[8] was much higher than the original current, while in our case
the steady value was just a little higher than the original value.
Therefore, the peak current was used in this work to calculate
R
exposure
in determining the corresponding SI, since this gave a
much larger SI compared with the case of adopting the steady
current to calculate R
exposure
.
Except for Type V microwires, the sensitivity increased in the
order: FilmoType IoType IIoType IIIoType IV (Fig. 7). For the
lowest methanol concentration of 1.3 ppt, the sensitivity of PPy
film sensor was 1.6% for a surface-to-volume ratio of 5.155
m
m
À1
,
as compared to PPy microwire Type IV with sensitivity of 36.44%
for a surface-to-volume ratio of 7.655
m
m
À1
. Similarly, at the
highest acetone concentration of 6.4 ppt, the PPy film sensitivity
was 10.4% and Type IV microwire was 55.6%. These results
indicate that in general the sensitivities of these sensors increase
with the increasing surface-to-volume ratios.
PPy film and microwires of Types I, II and III had the same
thickness of 0.194
m
m(Table 1). The sensitivities of the PPy film
and microwire sensors had an approximately linear relationship
with increasing methanol concentrations (Fig. 7). At the lowest
methanol concentration of 1.3 ppt, the sensitivities of PPy film
sensor were 1.6% and Type III microwire sensor was 8.2%. At the
ARTICLE IN PRESS
Time (s)
5.30
5.23
5.17
5.10
5.03
4.97
Time (s)
1.68
1.64
1.60
1.56
1.52
1.48
PPy microwire sensors
PPy film sensor
Response current (10
-7
A)
Response current (10
-7
A)
Fig. 6. Representative current responses of PPy (a) microwire and (b) film sensors during the 180-s exposure to methanol at a concentration of 3.8 ppt.
C. Luo, A. Chakraborty / Microelectronics Journal ] (]]]]) ]]]–]]] 5
Please cite this article as: C. Luo, A. Chakraborty, Effects of dimensions on the sensitivity of a conducting polymer microwire ,
Microelectron. J (2009), doi:10.1016/j.mejo.2008.11.064
highest methanol concentration of 6.4 ppt, the sensitivities of the
film and Type III microwire sensors were 10.4% and 17.5%,
respectively.
The PPy thicknesses were varied for Types III, IV and
V microwire sensors with their lengths and widths kept constant.
This was done to study the effects of the PPy thicknesses on the
sensitivity responses of the microwires. The thicknesses of the
PPy layers were 0.131 and 0.253
m
m for Types IV and
V microwires, respectively. When the PPy thicknesses were varied,
there were large variations in the surface-to-volume ratios.
Type IV microwires had the highest surface-to-volume ratio and
the highest sensitivities at all the methanol concentration levels
(Fig. 7). The sensitivity of Type IV microwires at the lowest
methanol concentration was 36.4% and at the highest concentra-
tion was 55.6%. These results imply that for the PPy microwires
their thicknesses may have larger effects on sensitivity than the
length and width.
It is also worth pointing out that, although the width of Type I
wires was three times as large as that of Type II wires (they have
the same length and width), their surface-to-volume ratios only
differed by 0.013. Similarly, the 2.5-times difference in the widths
between Types II and III led to only 0.001 difference in their
surface-to-volume ratios. These two comparisons support the
point raised in Section 2. That is, the changes of the length and
width do not cause much change in the surface-to-volume ratio of
a microsensor. However, it is interesting to see from Fig. 7 that
these three types of microwires still had several percents of
difference in their sensitivities of detecting methanol.
It is noted that PPy sensors that other researchers used have
demonstrated different sensitivities. For example, as indicated in
[8], when exposed to 5 ppt of methanol, PPy films generated by
inkjet printing [8] and dip-coating [12] have SI’s of 88% and 23%,
respectively. For this concentration, the SI’s of our five types of
sensors ranged from about 7–48%. The PPy films used to generate
our sensors were spin-coated on substrates. Naturally, the
sensitivity of a sensor should be affected by the sensing material
used in the sensor. In addition to this, as indicated in [8], the way
to make the film may also affect the sensitivity of a sensor.
Manufacturing approaches affected the surface morphologies of
generated films and subsequently the sensitivities of these films.
For example, the inkjet-printed PPy film in [8] consisted of
interconnected islands of average size 25
m
m, while the spin-
coated films have relatively flat surfaces. According to Eq. (1), the
SI of the inkjet-printed PPy films may approximately equal that of
the islands if each island is considered as a unit block of the film.
Compared to a large film of flat surfaces, these small islands of the
same thickness as the film have a higher surface-to-volume ratio.
Therefore, their SI (and consequently the SI of the inkjet-printed
film) should be higher than that of a spin-coated film. On the
other hand, microstructures can be further generated in spin-
coated films, functioning as sensing components and yielding
higher sensitivities. This is implied by the different sensor
responses of our five types of sensors. Thus, essentially, it should
be feature sizes and shapes that affected the sensitivity of a sensor
in addition to the sensing materials.
5.2. Exposure of PEDOT–PSS sensors to acetone vapor
Fig. 8 shows the wave-like variation of the response current in
detecting acetone using PEDOT–PSS sensors. The response current
first decreased and then increased back to a steady value a little
lower than its original value. At the initial stage, exposure of
PEDOT–PSS to acetone reduced the conductivity of the PEDOT–PSS
microwires. According to Ruangchuay et al. [26], acetone being a
polar molecule, it dispersed inside the PPy matrix by hydrogen
bonding. This mechanism disrupted the ordered structure and
hence reduced the conductivity of PPy. A similar mechanism may
be playing a role in reducing the conductivity of the PEDOT–PSS
microwires in our case. Alternatively, acetone molecules diffused
inside PEDOT–PSS, expanding the matrix, hindering the flow of
charge carriers and thereby reducing conductivity of the micro-
wires. As the response current reached a minimum, the acetone
vapor diffused out of the PEDOT–PSS due to the fact that the
acetone concentration in the PEDOT–PSS was higher than that in
the environment. This caused the increase in the current. The
sensing response of the PEDOT–PSS to acetone was different from
that in the case when PPy sensors were used to detect methanol.
The sensor current decreased to a minimum after about 90 s of
exposure. The response times of film and microwire sensors were
about the same. The same transient phenomenon was also found,
for example, in [5] when the PEDOT–PSS sensors were employed
to detect methanol and ethanol. However, due to the same reason
addressed in Section 5.1, their steady currents were much
different from the original currents, while in our case the steady
value was just a little lower than the original value. Thus, the
minimum current was used in this work to calculate R
exposure
in
determining the corresponding SI, since this gave a much larger SI
compared with the case of adopting the steady current to
calculate R
exposure
.
Except for Type V, the sensitivity of these sensors increased in
the order: FilmoType IoType IIoType IIIoType IV. For the
lowest acetone concentration of 0.64 ppt, the sensitivity of the
film sensor was 0.05% for a surface-to-volume ratio of 3.33
m
m
À1
,
as compared to Type IV microwires with sensitivity of 2.27% for a
surface-to-volume ratio of 4.78
m
m
À1
. Similarly, at the highest
acetone concentration of 5.8 ppt, the PEDOT–PSS film sensitivity
was 0.5% and Type IV microwires was 20.6%. These results
indicate that in general the sensitivities of these sensors increase
with the increasing surface-to-volume ratios. On the other hand,
as what we observed from the case of PPy detection, the large
changes in widths and lengths among Types I, II and III microwires
made only small changes in their surface-to-volume ratios.
However, it can be seen from Fig. 9 that these three types of
microwires also had several percents of difference in their
sensitivities of detecting acetone.
The thickness of the PEDOT–PSS layer for the film and Type I, II
and III microwires was 0.3
m
m(Table 2). The responses of the
PEDOT–PSS microwires were more closely placed in the sensitiv-
ity scale than the PPy microwires, while the overall trend was
similar. For the PEDOT–PSS microwires (Fig. 9), the sensitivity
increased from 0.05% for film sensor to 3% for Type III microwires,
ARTICLE IN PRESS
60
55
50
45
40
35
30
25
20
15
10
5
0
1234567
Methanol concentration (ppth)
Sensitivity (%)
Type III
Type II
Type IV
Type I;
Type V
Film
Fig. 7. Sensitivity responses of the PPy sensors at various concentrations of
methanol exposure.
C. Luo, A. Chakraborty / Microelectronics Journal ] (]]]]) ]]]–]]]6
Please cite this article as: C. Luo, A. Chakraborty, Effects of dimensions on the sensitivity of a conducting polymer microwire ,
Microelectron. J (2009), doi:10.1016/j.mejo.2008.11.064
at a concentration of 0.68 ppt and from 0.5% for film sensor to
20.7% for Type III microwires at a concentration of 5.8 ppt.
The thickness of the PEDOT–PSS layer was varied with the
length and width kept constant, similar to that in the PPy
microwires. The thicknesses of the PEDOT–PSS layers were
0.21
m
m and 1.15
m
m for Types IV and V microwires, respectively.
The sensitivity of Type IV microwires varied from 2.2% at 0.6 ppt
to 20.6% at 5.8 ppt of acetone (Fig. 9). The sensitivities of Type III
microwires were more than Type V and less than Type IV
microwires. This trend is aligned with the increasing surface-to-
volume ratios in order from Type V to III to IV.
The sensitivities of these five types of sensors ranged from
0.05% to 20.7% when they were exposed to 0.6–5.8 ppt of acetone.
Generally, they are higher than those (0.5–9.4%) reported in [7],
which detected 12.7 ppt of acetone using 2.5-mm-wide composite
films. The composite films consisted of PEDOT–PSS/insulating
polymers or carbon black/insulating polymers. The difference in
the sensitivities implies that both feature sizes and sensing
materials affected the sensitivities.
It is noted that gold–PEDOT/PSS–gold nanowires (8
m
min
length and 220 nm in diameter) were employed in [19] as sensors
to detect acetone, whose concentrations ranged from 104 to
416 ppt. The corresponding sensitivities varied from 3% to 9%. The
nanowires were synthesized using anodic aluminum oxide
membranes. These results imply that our sensors also generally
have higher sensitivities than the nanowire sensors. It has been
indicated in [19] that, compared with film sensors, these nanowire
sensors do not show higher sensitivities. They considered this was
due to the impact of substrate roughness during film formation of
the film sensors. In other words, different manufacturing
approaches generate different features, making sensors have
different sensitivities, as discussed in Section 5.1. In this work,
ARTICLE IN PRESS
Response current (10
-3
A)
0.60
0.58
0.56
0.52
0.48
0.50
0.66
0.64
0.62
Time (s)
0.54
PEDOT-PSS microwire sensors
Response current (10
-3
A)
3.477
3.480
3.504
3.501
3.498
Time (s)
3.495
PEDOT-PSS film sensors
3.492
3.489
3.486
3.483
Fig. 8. Representative current responses of PEDOT–PSS (a) microwire and (b) film sensors during the 120-s exposure to acetone at a concentration of 5.8 ppt.
25
20
15
10
5
0
0.5 1.5 2.5 3.5 4.5 5.5
Acetone concentration (ppth)
Sensitivity (%)
Type IV
Type III
Type V
Type II
Type I
Film
Fig. 9. Sensitivity responses of the PEDOT–PSS sensors at various concentrations
of acetone.
C. Luo, A. Chakraborty / Microelectronics Journal ] (]]]]) ]]]–]]] 7
Please cite this article as: C. Luo, A. Chakraborty, Effects of dimensions on the sensitivity of a conducting polymer microwire ,
Microelectron. J (2009), doi:10.1016/j.mejo.2008.11.064
the same manufacturing approach (as well as the same sensing
material) has been used to generate the five types of sensors.
Therefore, the manufacturing effect (as well as the sensing
material) is not a concern here in comparing the sensitivities of
these five types of sensors.
6. Statistical analysis of sensing data
Based on the method of least square [27], a statistical program
SAS has been run to fit the data points for further analyzing the
sensing results and examining the effects of each individual
dimension. We intended to find the relationship of the SI with the
three geometrical dimensions and the vapor concentration. It was
noticed that surface-to-volume ratio is a linear combination
of the inverse of the three geometrical dimensions, and that the
sensitivity should increase as this ratio increases. Therefore, we
assumed that the SI was related with the inverse of these three
dimensions. In addition, it was found from Figs. 7 and 9 that the
SI had an approximately linear relationship with the vapor con-
centration. Therefore, the SI was assumed to be directly related to
the vapor concentration, instead of its higher orders. Let x
1
, x
2
, and
x
3
represent the inverse of the length, the inverse of the width,
and the inverse of the thickness of a microwire, respectively. Set x
4
to be the vapor concentration. y stood for the SI. Then, based on a
linear aggregation model [28] and according to the dataset
obtained in detecting methanol using PPy sensors, we got
y ¼ 26479:7x
1
þ 268:7x
2
þ 9:9x
3
þ 1:9x
4
À 55:2. (2)
The corresponding r
2
was 0.94. r
2
is the so-called coefficient of
determination [26], and indicates how good the fitting is. It ranges
from 0 to 1. The fitting is better as r
2
is closer to 1. In view of the
dataset obtained in detecting acetone using PEDOT–PSS sensors,
the following equation was found:
y ¼ 17459:2x
1
þ 114:5x
2
þ 1:2x
3
þ 1:7x
4
À 10:8. (3)
The related r
2
was 0.76. To see clearly the effects of each
individual dimension on the sensitivity from the above two
equations, let’s consider an example. In designing a conducting
polymer microwire sensor, the initially chosen dimensions could
be 1000
m
m  100
m
m  0.1
m
m. Based on these dimensions, next
we considered how the changes in these three dimensions affect
the sensitivity. Let alternative length, width and thickness be
1000m,100n, and 0.1 l, respectively, where m, n and l were three
positive constants and their values determine the final values of
the three dimensions. Substituting the inverse of these three
dimensions into Eqs. (2) and (3) for x
1
, x
2
, and x
3
, we had
y ¼ 26:5=m þ 2:7=n þ 99=l þ 1:9x
4
À 55:2,
y ¼ 17:5=m þ 1:1=n þ 12=l þ 1:7x
4
À 10:8. (4)
Eq. (4) indicates that, for the detection of methanol using PPy
microwire sensors, the change in thickness had more effects than
the change in length on the sensitivity, while the latter had more
effects than the change in width. For example, y increased by
13.25, 1.35, and 45.5, respectively, when we respectively set m, n
and l to be 0.5. According to Eq. (4)
2
, the effects on the sensitivities
of the PEDOT–PSS microwire sensors in detecting acetone were
ordered from the highest to the lowest as: the change in length,
the change in thickness, and the change in width. For example,
y increased by 8.65, 0.55, and 6, respectively, when we
respectively set m, n and l to be 0.5. As could be seen from these
two relationships, the changes in the dimensions had more effects
on the sensitivities of PPy microwire sensors than those on the
sensitivities of PEDOT–PSS microwire sensors. Also, the degree of
influence of each individual dimension might vary with different
conducting polymer microwire sensors.
As discussed in Section 2, the thickness affected surface-to-
volume ratio much more than the length and the width. Also, in
principle the sensitivity increased with the increasing surface-to-
volume ratio. However, the two relationships given in Eq. (4)
indicate that the length had the same order of effects as the
thickness on the sensitivity. Therefore, in addition to the
thickness, it is also important to reduce the length of a microwire
for increasing the sensitivity. These two relationships also imply
that the length had more effects than the width. To see this
clearly, we compared the effects of the length with those of the
width via the detection of acetone using PPy sensors. PPy film and
Types I, II and IIII microwire sensors were chosen to detect
acetone vapors, whose concentrations were 1.3, 3.2, 4.5, 5.8, and
7.1 ppt (Fig. 10). The same setup and testing procedure as
described in Section 4 were used. The overall trend of the sensor
responses was similar to what has been found in the previous two
sets of experiments (Figs. 7 and 9). The sensitivity increased from
3.6% for film sensor to 13.0% for Type III microwires at a
concentration of 1.3 ppt and from 10.1% for film sensor to 29.0%
for Type III microwires at a concentration of 7.1 ppt. For a
particular concentration, the sensitivity increased in the order:
FilmoType IoType IIoType III. Since these sensors had the same
thickness of 0.194
m
m, we could directly compare the effects of the
length and width. The corresponding fitting result was
y ¼ 19301:5x
1
þ 920:0x
2
þ 2:1x
4
À 5:0. (5)
The related r
2
is 0.94. Following the same line of reasoning that
was used to obtain Eq. (4) from Eqs. (2) and (3), by Eq. (5) we had
y ¼ 19:3=m þ 9:2=n þ 2:1x
4
À 5:0. (6)
This equation indicates that, for the detection of acetone using
PPy microwire sensors, the change in length had the same order of
effects as the change in width. For example, y increased by 8.15
and 4.6, respectively when we, respectively, set m and n to be 0.5.
The exact mechanism that caused the different effects of
dimensions on the sensitivities is not clear. We speculate that it is
related to the internal structures and orientations of PPy and
PEDOT–PSS. For example, if the internal structure of a polymer is
orientated upward, then its width should have more effect than
the thickness, while the thickness of another polymer should be
more important than the width in detection when its internal
structure is pointed horizontally. We leave this to future
investigation.
7. Summary and conclusions
In this work, microwires of PPy and PEDOT–PSS were
fabricated using the ILL technique. The microwires had different
dimensions for achieving different surface-to-volume ratios. For
PPy, the surface-to-volume ratio varied from 3.974 to 7.655
m
m
À1
.
ARTICLE IN PRESS
0
5
10
15
20
25
30
35
1.3
Acetone cencentration (
pp
th)
Sensitivity (%)
Type III
Type II
Type I
Film
3.2 4.5 5.8 7.1
Fig. 10. Sensitivity responses of the PPy sensors at various concentrations of
acetone.
C. Luo, A. Chakraborty / Microelectronics Journal ] (]]]]) ]]]–]]]8
Please cite this article as: C. Luo, A. Chakraborty, Effects of dimensions on the sensitivity of a conducting polymer microwire ,
Microelectron. J (2009), doi:10.1016/j.mejo.2008.11.064
For PEDOT–PSS, the surface-to-volume ratio varied from 0.890 to
4.873
m
m
À1
. The PPy film and microwire sensors were exposed to
methanol vapor whose concentrations ranged from 1.3 to 6.4 ppt.
Methanol exposure increased the response current of the PPy
sensors. The PEDOT–PSS film and microwire sensors were
exposed to acetone vapor whose concentrations ranged from 0.6
to 5.8 ppt. The response current of the sensors was reduced upon
exposure to acetone vapor. In general, the sensitivities of the
sensors were found to increase with increasing surface-to-volume
ratios at various concentrations of the methanol and acetone
vapors. The sensitivity data obtained from experiments were
analyzed with the aid of a statistical program, SAS. From the point
view of surface-to-volume ratio, the thickness should affect the
sensitivity much more than the other two dimensions. However,
the three relationships obtained from three sets of experiments,
respectively, indicate that the effects of the three geometrical
dimensions on the sensitivity of a microwire sensor vary with the
conducting polymer materials and the targets to detect. In other
words, which dimension has more effects on sensitivity is case-
dependent. Results presented in this work can be potentially used
to aid in the design of conducting polymer microwire sensors of
high sensitivity.
Acknowledgements
This work was supported in part through NSF–DMI-0508454,
NSF/LEQSF(2006)-Pfund-53 and NSF-ECS-0529104 Grants.
References
[1] L. Rupprecht, Conductive Polymers and Plastics in Industrial Applications,
Plastic Design Library, 1999.
[2] B. Adhikari, S. Majumdar, Polymers in sensor applications, Progress in
Polymer Science 29 (2004) 699–766.
[3] S.T. McGovern, G.M. Spinks, G.G. Wallace, Micro-humidity sensors based on a
processable polyaniline blend, Sensors and Actuators B 107 (2005) 657–665.
[4] J.W. Gardner, P.N. Bartlett, A brief history of electronic noses, Sensors and
Actuators B 18–19 (1994) 210–211.
[5] M.F. Mabrook, C. Pearson, M.C. Petty, Inkjet-printed polymer films for the
detection of organic vapors, IEEE Sensors Journal 6 (2006) 1435–1444.
[6] S.V. Patel, M.W. Jenkins, R.C. Hughes, W.G. Yelton, A.J. Ricco, Differentiation of
chemical components in a binary solvent vapor mixture using carbon/
polymer composite-based chemiresistor, Analytical Chemistry 72 (2000)
1532–1542.
[7] G.A. Sotzing, S.M. Briglin, R.H. Grubbs, N.S. Lewis, Preparation and properties
of vapor detector arrays formed from Poly(3,4-ethylenedioxy)thiophene-
Poly(styrenesulphonate)/Insulating polymer composites, Analytical Chemis-
try 72 (2000) 3181–3190.
[8] M.F. Marbrook, C. Pearson, M.C. Petty, Inkjet printed PPy thin films for vapor
sensing, Sensors and Actuators B 115 (2006) 547–551.
[9] W.A. Daoud, J.H. Xin, Y.S. Szeto, Polyethylenedioxythiophene coatings for
humidity, temperature and strain sensing polyamide fibers, Sensors and
Actuators B 109 (2005) 329–333.
[10] J.H. Cho, J.B. Yu, J.S. Kim, S.O. Sohn, D.D. Lee, J.S. Huh, Sensing behaviors of
polypyrrole sensor under humidity condition, Sensors and Actuators B 108
(2005) 389–392.
[11] C.P. de Melo, B.B. Neto, E.G. de Lima, L.F. B de Lira, J.E.C. de Souza, Use of
conducting Polypyrrole blends as gas sensors, Sensors and Actuators B 109
(2005) 34 8–354.
[12] H.K. Jun, Y.S. Huh, B.S. Lee, S.T. Lee, J.O. Lim, D.D. Lee, J.S. Huh, Electrical
properties of polypyrrole gas sensors fabricated under various pre-treatment
conditions, Sensors and Actuators B 96 (2003) 576–581.
[13] L. Jiang, H.K. Jun, Y.S. Huh, J.O. Lim, D.D. Lee, J.S. Hoh, Sensing characteristics
of polypyrrole-poly(vinyl alcohol) methanol sensors prepared by in situ vapor
state polymerization, Sensors and Actuators B 105 (2005) 132–137.
[14] Q. Ameer, S. Adeloju, Polypyrrole-based electronic noses for environmental
and industrial analysis, Sensors and Actuators B 106 (2005) 541–552.
[15] T. Yamauchi, K. Kojima, K. Oshima, M. Shimomura, S. Miyauchi, Glucose-
sensing characteristics of conducting polymer bound with glucose oxidase,
Synthetic Metals 102 (1999) 1320.
[16] L. Ruangchuay, A. Sirivat, J. Schwank, Electrical conductivity response of
polypyrrole to acetone vapor: effect of dopant anions and interaction
mechanisms, Synthetic Metals 140 (2004) 15–21.
[17] L.M. Torres-Rodriguez, M. Billon, A. Roget, G. Bidan, A Polypyrrole-biotin
based biosensor: elaboration and characterization, Synthetic Metals 102
(1999) 1328–1329.
[18] K. Suri, S. Annapoorni, A.K. Sarkar, R.P. Tandon, Gas and humidity sensors
based on iron oxide-polypyrrole nanocomposites, Sensors and Actuators B 81
(2002) 277–282.
[19] Y. Dan, Y. Cao, T.E. Mallouk, A.T. Johnson, S. Evoy, Dielectrophoretically
assembled polymer nanowires for gas sensing, Sensors and Actuators B 125
(2007) 55–59.
[20] C. Luo, R. Poddar, X. Liu, Innovative approach for replicating micropatterns in
a conducting polymer, Journal of Vacuum Science and Technology B 24
(2006) L19–L22.
[21] A. Chakraborty, X. Liu, C. Luo, An intermediate-layer lithography method for
generating multiple microstructures made of different conducting polymers,
Microsystem Technologies 13 (2007) 1175–1184.
[22] X. Liu, A. Chakraborty, C. Luo, Generation of all-polymeric diodes and
capacitors using an innovative intermediate-layer lithography, in: J.P.
Martingale (Ed.), Progress in Solid State Electronics Research, Nova Science
Publishers, Inc., 2007, pp. 127–139.
[23] M. Hecklele, W. Bacher, K.D. Mu
¨
ller, Hot embossing-the molding technique
for plastic microstructures, Microsystem Technologies 4 (1998) 122–124.
[24] S.Y. Chou, P.R. Krauss, P.J. Renstorm, Nanoimprint Lithography, Journal of
Vacuum Science and Technology B 14 (1996) 4129–4133.
[25] Z. Liu, Y. Su, K. Varahramyan, Inkjet-printed silver conductors using silver
nitrate ink and their electrical contacts with conducting polymers, Thin Solid
Films 478 (2005) 275–279.
[26] L. Ruangchuay, A. Sirivat, J. Schwank, Electrical conductivity response of
polypyrrole to acetone vapor: effect of dopant anions and interaction
mechanisms, Synthetic Metals 140 (2004) 15–21.
[27] R.L. Plackett, The discovery of the method of least squares, Biometrika 59
(1972) 239–251.
[28] E.F. Fama, J.D. MacBeth, Risk, return and equilibrium: empirical tests, Journal
of Political Economy 71 (1973) 607–636.
ARTICLE IN PRESS
C. Luo, A. Chakraborty / Microelectronics Journal ] (]]]]) ]]]–]]] 9
Please cite this article as: C. Luo, A. Chakraborty, Effects of dimensions on the sensitivity of a conducting polymer microwire ,
Microelectron. J (2009), doi:10.1016/j.mejo.2008.11.064