- Trang chủ >>
- Khoa Học Tự Nhiên >>
- Vật lý
fabrication and characterization of anodic titanium oxide nanotube arrays of controlled
Bạn đang xem bản rút gọn của tài liệu. Xem và tải ngay bản đầy đủ của tài liệu tại đây (2.74 MB, 7 trang )
Fabrication and Characterization of Anodic Titanium Oxide Nanotube Arrays of Controlled
Length for Highly Efficient Dye-Sensitized Solar Cells
Chien-Chon Chen,
†
Hsien-Wen Chung,
†
Chin-Hsing Chen,
†
Hsueh-Pei Lu,
†
Chi-Ming Lan,
†
Si-Fan Chen,
†
Liyang Luo,
†,‡
Chen-Shiung Hung,
‡
and Eric Wei-Guang Diau*
,†
Department of Applied Chemistry and Institute of Molecular Science, National Chiao Tung UniVersity,
No. 1001, Ta Hsueh Road, Hsinchu 300, Taiwan, and and Institute of Chemistry, Academia Sinica,
Taipei 115, Taiwan
ReceiVed: July 16, 2008; ReVised Manuscript ReceiVed: September 2, 2008
The performance of dye-sensitized solar cells (DSSC), made of highly ordered anodic titanium oxide (ATO)
nanotube (NT) arrays produced directly on Ti foil, depends on the length of these arrays. We controlled these
lengths L from4to41µm while varying the concentration (0.1, 0.25, 0.5, and 0.8 wt %) of the electrolyte
(NH
4
F) in ethylene glycol in the presence of H
2
O (2 vol %) with anodization for various periods (t ) 0.5-8
h). The compact and bundle layers introduced during anodization were effectively removed upon simple
ultrasonic cleaning in deionized water containing submicrometer particles of Al
2
O
3
in a small proportion.
The photovoltaic performance of the NT-DSSC devices (NH
4
F at 0.5 wt %) made of ATO films, as prepared,
increased from 3.0% to 5.2% as L was increased from 6 µm(t ) 0.5 h) to 30 µm(t ) 8 h). After treatment
of the ATO films with TiCl
4
in a two-step annealing process, the optimized NT-DSSC device attained an
overall efficiency of 7.0% power conversion.
1. Introduction
Following the pioneering work of Gra¨tzel and co-workers,
1
dye-sensitized solar cells (DSSC) have received much attention
as an economical energy conversion device. A typical DSSC
device contains a light-harvesting layer on a working electrode
(anode) and a Pt-coated layer on a counter electrode (cathode);
both electrodes are made of a transparent conducting oxide
(TCO) substrate; an iodine-based electrolyte fills the space
between the anode and the cathode to serve as a redox mediator
in a sandwich-type structure. As a light-harvesting layer, a
photosensitizer, typically a ruthenium complex such as N3 or
N719 dye, is chemisorbed onto the surface of a nanocrystalline
thin film of TiO
2
. When this photosensitizer absorbs sunlight,
electrons are injected into the conduction band of the semicon-
ductor layer, which results in a separation of electrons (in the
TiO
2
layer) and holes (dye cations); the electrons proceed to
the anode while the holes are transported by the redox species
to the cathode to complete the photoelectrochemical cycle and
to do external work. The electron-collecting layer (anode) of a
DSSC is traditionally composed of randomly packed TiO
2
nanoparticles (NP). With sunlight irradiating the transparent
anode (front illumination), the greatest efficiency ( η) of conver-
sion into photovoltaic power of a NP-DSSC device has reached
∼11%.
2–6
A great advantage of a NP-DSSC is that nanoporous TiO
2
films have a large surface area for dye adsorption, but diffusion,
limited by traps, for electron transport in NP-DSSC impedes
the efficiency of conversion of light to electricity.
7,8
To improve
the efficiency of charge collection by promoting both more rapid
electron transport and slower charge recombination, several
methods with TiO
2
films constructed of oriented one-dimen-
sional (1D) nanostructures have been established. For instance,
DSSC based on one-dimensional TiO
2
nanowires have been
reported;
9,10
1D TiO
2
nanotubes (NT) have been synthesized
using the sol-gel method
11–13
and potentiostatic anodization.
8,14–20
Gra¨tzel and co-workers reported a back-illuminated NP-DSSC
with a cell performance η ) 7.2%.
21
Because substantial light
scattering at the Pt-coated counter electrode and light absorption
by the iodine-based electrolyte adversely affect the performance,
the back-illuminated NP-DSSC has an efficiency significantly
smaller than that of its front-illuminated counterpart (η ) 9.9%);
maximum values occur at a TiO
2
film thickness of 14 µmin
both cases.
21
For NT-DSSC, perpendicularly aligned and highly
ordered anodic titanium oxide (ATO) NT arrays are prepared
either on a TCO glass, using combined sputtering/anodization
8
or a film detachment,
20
or on a nontransparent Ti metal surface,
using direct anodization.
14–19
Front illumination is feasible for
only the former case, but poor adhesion between the ATO barrier
layer and the TCO layer limits the length of ATO NT arrays.
Although illumination from the back suffers from the
specified disadvantages, NT-DSSC with ATO NT arrays on Ti
foil as working electrodes have many important intrinsic features
that outperform conventional NP-DSSC. First, the efficiency
of charge collection of NT films has been proved to be much
better than that of NP films because of the 1D nature of the
former with a much smaller rate of charge recombination;
16
this
intrinsic advantage of NT-DSSC significantly promotes its cell
performance with increasing tube length up to 20 µm as reported
by Grimes and co-workers.
17
Second, the efficiency of light
harvesting by NT films is much better than that of NP films
because the former have a stronger light scattering effect;
16
for
a traditional, highly efficient NP-DSSC, adding an additional
TiO
2
layer of larger particles (size ∼400 nm)
2,3,21
or increasing
the haze factor
5,6
was required to increase the light scattering,
whereas this effect is a natural property of a NT-DSSC. Third,
the anode fabrication of a NT-DSSC is much simpler and
cheaper than that of a NP-DSSC. Direct anodization of a Ti
* Corresponding author. Fax: (886)-03-572-3764. E-mail: diau@
mail.nctu.edu.tw.
†
National Chiao Tung University.
‡
Academia Sinica.
J. Phys. Chem. C 2008, 112, 19151–19157 19151
10.1021/jp806281r CCC: $40.75 2008 American Chemical Society
Published on Web 11/08/2008
foil in one step produces a blank TiO
2
film ready to act as a
working electrode for a NT-DSSC, whereas making a blank
TiO
2
film for a NP-DSSC requires multiple coatingssat least
two layers of TiO
2
NP coating on an expensive TCO substrate.
Furthermore, calcination of the NT/Ti anode at a high temper-
ature makes it ready to be fabricated into a flexible NT-DSSC
device with a transparent conductive plastic cathode (ITO/PEN).
Gra¨tzel and co-workers reported an efficiency of 3.6% photo-
voltaic conversion for a flexible NT-DSSC made of ATO NT
films of thickness 14 µm with a solvent-free ionic liquid
electrolyte.
19
Even though the TiO
2
NT arrays possess the advantages of
greater efficiency of charge collection and stronger light
scattering than their NP-based counterparts,
16
producing longer
tubes on a larger area involves formation of a bundle layer in
the films, leading to cracking of films that are easily peeled
from the Ti substrate. To resolve this problem, Frank and co-
workers
22
removed solvent liquids from the mesopores of the
arrays with supercritical CO
2
, so producing NT films free of
bundles and cracks for NT-DSSC applications, but the small
length of the TiO
2
NT arrays (L ) 6.1 µm) limited the efficiency
of power conversion of the device (η ) 1.9%).
22
The greatest
reported efficiency of NT-DSSC under backside illumination
is 6.89%.
17
In the present work, we controlled the lengths of ATO NT
from4to41µm while varying the concentration of NH
4
F
electrolyte in ethylene glycol (EG) with anodization for various
periods. The unwanted surface deposits of the films introduced
during anodization were effectively removed simply upon
ultrasonic cleaning in deionized water containing Al
2
O
3
as
submicrometer particles in a small proportion. We observed a
systematic variation of the photovoltaic performance of the NT-
DSSC devices as a function of tube length. After the ATO films
were treated with TiCl
4
and annealed in two steps, we found
that, with an appropriate redox electrolyte and an improved
counter electrode, the optimized NT-DSSC device reaches an
overall efficiency of 7.0% power conversion.
2. Experimental Section
We fabricated ordered nanochannel arrays of ATO films at
25 °C on anodizing titanium (Ti) foil (Aldrich, 99.7% purity)
as circular discs (diameter ∼50 mm) at a constant voltage of
60 V.
17,23
The electrolyte solutions contained ammonium fluoride
(NH
4
F, 99.9%; 0.15, 0.25, 0.5, and 0.8 wt %) in EG in the
presence of H
2
O (2 vol %, pH ) 6.8) with anodization for varied
periods (t ) 0.5-8 h). To crystallize amorphous TiO
2
into its
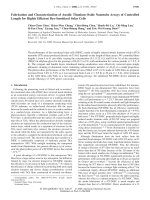
anatase phase, we annealed the samples to 450 °C. Parts a and
b of Figure 1 show SEM images of the ATO films subjected to
annealing in one and two steps, respectively. For the two-step
process, the ATO films were first rinsed with ethanol, dried in
air, and annealed at 150 °Cfor2htoremove organic solvents,
and were then crystallized at 450 °C for another3hinanair
furnace. After one-step annealing directly at 450 °C, the ATO
film suffered severe cracking that resulted in the film becoming
easily peeled from the Ti-foil substrate, as demonstrated in the
inset of Figure 1a. The inset of Figure 1b shows the satisfactory
quality of the ATO films of large area from the two-step
annealing.
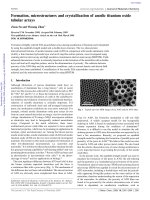
When the ATO NT were produced with the electrolyte at
large concentrations or with protracted anodization, we observed
the formation of compact layers on the surface of the ATO films
(Figure 2a); a bundle layer was observed (Figure 2b) at a smaller
anodization period, as Frank and co-workers reported.
22
Because
of the robust structure of the NT arrays and the loose structure
of the surface debris, the unwanted deposits on the ATO surface
Figure 1. SEM images of ATO films undergoing (a) a one-step annealing and (b) a two-step annealing. The insets show specimen pictures of the
corresponding ATO films: the one-step process leads to creaking of the films that easily peeled from the Ti substrate, whereas the two-step process
yields films of satisfactory quality and ready to use.
Figure 2. SEM images of ATO NT covered with (a) a compact layer and (b) a bundle layer before ultrasonic cleaning.
19152 J. Phys. Chem. C, Vol. 112, No. 48, 2008 Chen et al.
introduced during anodization can be effectively removed with
ultrasonic vibration of the ATO films in deionized water
containing a small proportion of Al
2
O
3
particles of average size
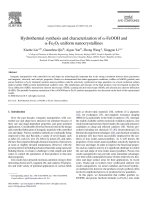
300 nm. Parts a and b of Figure 3 show top and side views of
SEM images of ATO films after ultrasonic cleaning that
completely removed the disordered clumps, but the length of
the tube decreased from 36 to 30 µm. Afterward, the samples
were again washed with ethanol, dried in air, and heated to 100
°C for 10 min followed by annealing at 450 °C for 30 min.
The surface roughness of ATO films was measured with a
surface profiler (R-step; KOSAKA, ET-4000); these films were
characterized with parameters for average roughness (Ra), root-
mean-square roughness (Rq), and average maximum height of
the profile (Rz). For a typical ATO film, these roughness
parameters before ultrasonic treatment were Ra ) 0.46 µm, Rq
) 0.53 µm, and Rz ) 2.91 µm; the parameters after that
treatment were Ra ) 0.80 µm, Rq ) 0.93 µm, and Rz ) 4.38
µm. We therefore estimate the uncertainty of the ATO film
thickness to be (2 µm according to the measured 2Rq values
(two standard errors). The morphology of the ATO films was
determined with a scanning electron microscope (SEM; JEOL
6500) and the composition with X-ray diffraction (XRD; Philips
X’Pert Pro).
To characterize the photovoltaic performance of the NT-
DSSC devices, we immersed the ATO films (typical size 1.2
× 2.0 cm
2
) in an ethanol solution containing N3 (0.5 mM,
Solaronix, Switzerland) at 50 °Cfor8htoabsorb sufficient
N3 dye for light harvesting; the N3/ATO films served as a
working electrode (anode). A fluorine-doped tin oxide (FTO;
30 Ω/sq, Sinonar, Taiwan) glass (typical size 1.0 × 2.0 cm
2
)
coated with Pt particles by sputtering served as a counter
electrode (cathode). To fabricate the NT-DSSC device, we
assembled the two electrodes into a cell of sandwich type and
sealed it with a hot-melt film (SX1170, Solaronix, thickness 25
µm); a thin layer of electrolyte was introduced into the space
between the two electrodes.
17,18
A typical redox electrolyte
contained lithium iodide (LiI, 0.1 M), diiodine (I
2,
0.01 M),
4-tert-butylpyridine (TBP, 0.5 M), butyl methyl imidazolium
iodide (BMII, 0.6 M), and guanidinium thiocyanate (GuNCS,
0.1 M) in a mixture of acetonitrile (CH
3
CN, 99.9%) and
valeronitrile (n-C
4
H
9
CN, 99.9%) (v/v ) 15/1).
The amount of N3 dye absorbed on the ATO films was
measured with a UV-visible-NIR spectrophotometer (JASCO
V-570) equipped with an integrating sphere (JASCO ISN-470).
Measurements of IV curves were made with a digital source
meter (Keithley 2400, computer-controlled) with the device
Figure 3. SEM images of ATO NT after ultrasonic cleaning: (a) top view and (b) side view. The inset of (a) shows the enlarged pattern of the
ATO NT arrays.
Figure 4. Length of ATO NT (L) as a function of anodization period
(t) at various NH
4
F concentrations (wt %) as indicated; the correspond-
ing side-view SEM images showing the L values of each datum are
given in the Supporting Information.
Figure 5. (a) Absorption spectra of ATO films sensitized with N3
dye at various tube lengths produced with NH
4
F (0.5 wt %). (b)
Current-voltage characteristics of NT-DSSC devices fabricated using
the corresponding ATO films (a) under simulated AM-1.5 solar
illumination (100 mW cm
-2
) and active area 0.28 cm
2
.
Anodic TiO
2
Nanotube Arrays for DSSC J. Phys. Chem. C, Vol. 112, No. 48, 2008 19153
under one-solar AM-1.5 irradiation from a solar simulator
(Newport-Oriel 91160) calibrated with a Si-based reference cell
(Hamamatsu S1133) containing an IR-cut filter (KG5) to correct
the spectral mismatch of the lamp.
24
The NT-DSSC devices were
operated with illumination on the back side and the transparent
counter electrode masked with a black plastic tape of the same
size with a round hole to allow the actively illuminated area,
0.28 cm
2
, for all measurements.
25
The incident monochromatic photon-to-current conversion
efficiency (IPCE) measurements were carried out with a home-
built system, which includes a Xe lamp (PTi A-1010, 150 W),
a monochromator (Dongwoo DM150i, 1200 gr/mm blazed at
500 nm), and a source meter (Keithley 2400, computer-
controlled). A standard Si photodiode (ThorLabs FDS1010) was
used as a reference to calibrate the power density of the light
source at each wavelength so that the IPCE(λ) of the NT-DSSC
device can be obtained according to the following equation
IPCE(λ) ) IPCE
ref
(λ) ·
J
DSSC
(λ)
J
ref
(λ)
(1)
where the IPCE
ref
(λ) of the Si photodiode is known from a
calibration, and the current densities of the reference cell and
the NT-DSSC device, J
ref
(λ) and J
DSSC
(λ), were measured under
the same experimental conditions (excitation beam size ∼0.08
cm
2
).
3. Results and Discussion
3.1. Growing ATO Films with Various Lengths of NT
Arrays. According to Grimes and co-workers,
14,17
the formation
of ATO NT involves fluoride ions: the lengths of these tubes
were proportional to the fluoride concentration and to the
duration of anodization. We confirmed this correlation, but the
tubes adhered more weakly to the substrate when the tubes grew
longer. To discover optimal conditions for long tubes tightly
grown on the substrate, we used NH
4
F electrolyte in EG at four
concentrations to anodize Ti foil with anodization for various
durations. Figure 4 shows the variation of length of TiO
2
NT
as a function of period of anodization (the corresponding SEM
images of each datum showing the lengths of the tubes are given
in the Supporting Information, Figures S1-S4); the length
increased with increasing duration of anodization and F
-
Figure 6. Variation of photovoltaic parameters J
SC
, V
OC
, FF, and η,
as a function of tube length (L); these data were obtained from analysis
of IV curves in Figure 5b and summarized in Table 1.
TABLE 1: Photovoltaic Performance of NT DSSC as a
Function of Tube Length (L) under AM-1.5 Illumination
(Power 100 mW cm
-2
) and Active Area 0.28 cm
2a
t/h L/µm J
SC
/mA cm
-2
V
OC
/V FF η/%
0.5 6 6.4 0.76 0.62 3.0
1 9 8.0 0.76 0.61 3.7
2 14 10.0 0.72 0.60 4.3
3 18 9.7 0.73 0.61 4.3
4 23 11.4 0.72 0.60 4.9
5 26 12.2 0.71 0.58 5.0
6 28 12.0 0.70 0.59 5.0
8 30 12.5 0.72 0.58 5.2
a
Values obtained for ATO films without TiCl
4
treatment; the
counter electrodes were not optimized.
Figure 7. SEM images of ATO NT after treatments with TiCl
4
: (a) and (c) top and side views with annealing temperature 350 °C; (b) and (d) top
and side views with annealing temperature 450 °C. The scale bars represent a length of 100 nm.
19154 J. Phys. Chem. C, Vol. 112, No. 48, 2008 Chen et al.
concentration. Our results indicate that the maximum lengths
of NT with effective adhesion to the Ti substrate are 16, 20,
30, and 41 µm for NH
4
F concentrations 0.15, 0.25, 0.5, and
0.8 wt % in EG, respectively. At small [F
-
], the cracking was
not severe, but the rate of tube growth was so small as to lead
to formation of heavier clumps on the surface of the films. At
large [F
-
], even though the rate of tube growth was much
increased, cracking also became significant, which causes poorer
adhesion of the tubes to the substrate. As a compromise, we
used ATO films grown with [NH
4
F] at 0.5 wt % for various
periods of anodization to investigate the dependence of the
photovoltaic performance of NT-DSSC devices on length.
3.2. Photovoltaic Performance of the Devices with NT
Arrays of Varied Lengths. The ability of the N3 dye
chemisorbed on ATO films was examined with absorption
spectra as shown in Figure 5a, in which the absorbance of the
dye increases upon L increasing from 6 to 18 µm but varies
insignificantly for L above 18 µm because of the saturation of
the instrument (Supporting Information, Figure S5). The absorp-
tion maximum of the dye shifts slightly from 530 nm for shorter
tubes to 536 nm for longer tubes, together with a broad shoulder
extending to greater wavelengths for the longer tubes. This
spectral feature of the increased dye loading in longer tubes
might be due to a saturation effect and/or due to the increase of
molecular interaction that results in the broader shoulder toward
the red part of the visible spectra. These N3/ATO films were
fabricated into NT-DSSC devices of which the corresponding
IV curves are shown in Figure 5b. We show the measured
photovoltaic parameters of these devices in Figure 6; the
corresponding values are summarized in Table 1, which
demonstrates that the current density at short circuit (J
SC
in mA
cm
-2
), the voltage at open circuit (V
OC
in V), the fill factor (FF),
and the efficiency of power conversion (η ) J
SC
· V
OC
· FF/P
in
with P
in
) 100 mW cm
-2
) vary with the tube length (L). The
results display a notably systematic trend for J
SC
, such that the
current density increases significantly from J
SC
) 6.4 mA cm
-2
at L ) 6 µmtoJ
SC
) 12.5 mA cm
-2
at L ) 30 µm because
longer tubes offer a larger surface area on which the dye
molecules adsorb.
Our results also show a systematic trend with both V
OC
and
FF decreasing upon increasing tube length. Because the extent
of the increase in J
SC
was much greater than the extent of the
decrease in V
OC
and FF, the overall efficiency of conversion of
photons to current exhibited a systematic increase from η )
3.0% at L ) 6 µmtoη ) 5.2% at L ) 30 µm. A negative
dependence of cell performance on length in both V
OC
and FF
is unambiguously shown in Figure 6, indicating that charge
recombination might be important at the interface between the
electrode and the electrolyte.
26,27
The source of charge recom-
bination might have been the cracking of the films (Figure 1b),
which became more significant for films of tubes of increasing
length. To remedy this problem, we further treated the ATO
films with TiCl
4
.
28,29
3.3. Photovoltaic Performance on TiCl
4
Treatments of
ATO Films. The effect of the TiCl
4
treatment on ATO films is
reported to increase the amount of dye loading and hence to
enhance the photocurrent of the device.
18
In particular, it has
been shown that the TiCl
4
treatment in a front-illuminated NT-
DSSC increases the roughness of the tube walls and thus
improves the cell performance through an increased effective
surface area for dye adsorption.
8,18,20
The dye-loading experi-
ments have confirmed that the amount of adsorbed N3 dye on
Figure 8. Current-voltage characteristics of NT-DSSC devices
fabricated using the ATO films treated with TiCl
4
as shown in Figure
7 under simulated AM-1.5 solar illumination (100 mW cm
-2
) and active
area 0.28 cm
2
. The dashed curve shows the results of an ATO film not
treated with TiCl
4
for comparison.
Figure 9. (a) Photocurrent and (b) IPCE spectra of the TiCl
4
-treated
NT-DSSC (circles) and the Si reference cell (dashed curves) measured
at the same experimental conditions.
Figure 10. Current-voltage characteristics of NT-DSSC devices
fabricated using four electrolytes: (a) electrolyte A, (b) electrolyte B,
(c) electrolyte C, and (d) electrolyte D under simulated AM-1.5 solar
illumination (100 mW cm
-2
) and active area 0.28 cm
2
. Three to four
independent measurements were conducted with the same ATO films.
The compositions of the electrolytes are summarized in Table 2.
Anodic TiO
2
Nanotube Arrays for DSSC J. Phys. Chem. C, Vol. 112, No. 48, 2008 19155
a TiCl
4
-treated ATO film is larger than that adsorbed on an
untreated ATO film (Supporting Information, Figures S6 and
S7). We further tested the effect of the TiCl
4
treatments in a
back-illuminated NT-DSSC by varying the immersion temper-
atures and periods and the annealing temperatures. According
to those tests, the best condition was to treat TiCl
4
twice at 50
°C; for the first treatment, the films were immersed in TiCl
4(aq)
(0.1 M, 1.5 h) followed by appropriate rinsing and drying (300
°C, 30 min); for the second treatment, the films were immersed
in TiCl
4(aq)
(0.1 M, 1.5 h) again and then annealed at either 350
or 450 °C for 30 min. Parts a/c and b/d of Figure 7 show top
and side views of SEM images of the TiCl
4
-treated ATO films
(L ) 19 µm) at annealing temperatures 350 and 450 °C,
respectively. The two-step treatments of the ATO films with
TiCl
4
clearly formed compact TiO
2
nanoparticles on the inner
and outer surfaces of the NT so as to increase the surface area
for dye adsorption. The TiO
2
nanoparticles produced at an
annealing temperature of 350 °C were smaller than those formed
at 450 °C.
After the ATO films treated with TiCl
4
were sensitized with
N3 dye, the N3/ATO films were fabricated into NT-DSSC
together with an improved counter electrode.
30
The effect of
TiCl
4
treatment on cell performance is shown in Figure 8; the
IV characteristic of an ATO film not treated with TiCl
4
appears
as a dashed curve (J
SC
) 13.8 mA cm
-2
; V
OC
) 0.741 V; FF )
0.58; η ) 5.9%) for comparison. After posttreatment of the ATO
films with TiCl
4
, J
SC
, V
OC
, and FF of the NT-DSSC devices
increased significantly, so improving the cell performance from
η ) 5.9% to η ) 7.0%. Both TiCl
4
-treated ATO films have
similar values of η. Although the values of V
OC
are similar, the
value of J
SC
for the film annealed at 350 °C is greater than that
for annealing at 450 °C owing to larger surface area of the
former for enhanced dye loading. A higher temperature of
annealing of the latter might aid nucleation of the nanoparticular
TiO
2
into the anatase phase for improved electron transport and
hence an increased fill factor of the device. These two effects
appeared to balance each other, such that almost the same cell
performance was obtained for the two-step TiCl
4
treatments at
two annealing temperatures.
The photocurrent action (IPCE) spectrum of the TiCl
4
-treated
NT-DSSC device was obtained from a calibrated experiment.
Figure 9a shows the photocurrents of NT-DSSC (circles) and
the Si reference cell (dashed curve), which were obtained under
the same experimental conditions. Because the IPCE
ref
(λ)of
the reference cell was known (dashed curve in Figure 9b), the
IPCE(λ) of the NT-DSSC device can be evaluated according
to eq 1, and the results are shown as circles in Figure 9b. The
IPCE spectrum exhibits a maximum around 530 nm, which is
similar to the feature of the absorption spectra of the N3/ATO
films shown in Figure 5a. Furthermore, our IPCE spectrum is
also similar to the IPCE spectrum of a back-illuminated NP-
DSSC device with η ) 7.2%.
21
It was pointed out
21
that the
IPCE values of a back-illuminated DSSC device are lower than
those of its front-illuminated counterpart owing to the absorption
of the I
3
-
electrolyte that cuts the incident light significantly
below 500 nm.
To save time in loading the dye onto the ATO films, we used
the N3 dye with immersion period 8 h, whereas Grimes and
co-workers
17
used N719 dye with immersion period 48 h, and
this leads to a lower V
OC
value being observed.
31
The duration
of growth of an ATO film with L ) 20 µm was much smaller
in our case (3-4 vs 24 h), which might be an important concern
for future commercialization of a NT-DSSC.
3.4. Effect of the Redox Electrolytes. Because sunlight is
transmitted through the redox electrolyte before being absorbed
by dye molecules in a back-illuminated NT-DSSC device, the
composition of the electrolyte might play a role in the cell
performance. For example, Grimes and co-workers reported η
) 5.44% for their back-illuminated NT-DSSC result with the
electrolyte solution composed of LiI (0.5 M), I
2
(0.05 M), TBP
(0.5 M), N-methylbenzimidazole (MBI, 0.6 M), and GuNCS
(0.1 M) in methoxypropionitrile (MPN); their device suffers
from a small FF value (0.43), which was attributed to a thick
barrier layer of the ATO film.
14
The large concentrations of LiI
and I
2
in the electrolyte might obstruct significantly the incident
light in a backside illumination device. The same group
subsequently reported η ) 6.89% for an electrolyte containing
I
2
(0.01 M), MBI (0.5 M), BMII (0.6 M), and GuNCS (0.1 M)
in MPN.
17
Our tests indicate that this electrolyte still suffers
from a small FF value, probably due to the large viscosity of
MPN; altering the MPN solvent to a cosolvent of acetonitrile
and valeronitrile with a volume ratio 15:1 (electrolyte A in Table
2) much improves the cell performance (η ) 5.9%). TBP in
the electrolyte is known to play an important role in increasing
both V
OC
and FF values through remedying the dye-uncovered
surface of the ATO films.
28
Recent investigations
32,33
show that
addition of TBP containing Li
+
ions in the electrolyte reduces
the surface positive charge, which shifts the conduction band
potential of TiO
2
toward negative and leads to the increase of
V
OC
. Furthermore, TBP suppressed the recombination between
the injected electrons and triiodide anions that leads to the
increase of V
OC
and FF.
33,34
By replacement of the MBI
component with TBP (0.5 M) and addition of LiI (0.1 M) to
increase the iodine anions, the device made of electrolyte B
produces much better cell performance than the device made
of electrolyte A (Table 2).
The IV characteristics of the NT-DSSC made of four
electrolytes (A-D), repeated three to four times, are shown in
Figure 10; the corresponding averaged photovoltaic parameters
are summarized in Table 2. Electrolyte C, adopted from Gra¨tzel
and co-workers,
21
was designed for both front- and back-
illuminated NP-DSSC devices. The large concentration of I
2
and lack of Li
+
in electrolyte C lead to the decrease in both J
SC
and V
OC
that causes device C to have a deteriorated cell
TABLE 2: Photovoltaic Performance of NT-DSSC at Four Compositions of Electrolytes under AM-1.5 Illumination (Power 100
mW cm
-2
) and Active Area 0.28 cm
2a
electrolytes
b
LiI/M I
2
/M BMII/M TBP/M J
SC
/mA cm
-2
V
OC
/V FF η/%
A 0 0.01 0.6 c 13.8 ( 0.8 0.74 ( 0.01 0.58 ( 0.04 5.9 ( 0.2
B 0.1 0.01 0.6 0.5 14.5 ( 0.6 0.76 ( 0.02 0.63 ( 0.03 6.9 ( 0.2
C 0 0.03 0.6 0.5 14.0 ( 0.5 0.72 ( 0.02 0.64 ( 0.01 6.4 ( 0.3
D 0.05 0.03 1.0 0.5 14.6 ( 0.4 0.74 ( 0.02 0.62 ( 0.04 6.8 ( 0.3
a
All photovoltaic parameters were obtained from averaging three to four sets of the IV curves shown in Figure 10; the uncertainties
represent two standard errors.
b
Additional component in electrolytes A-D contains guanidinium thiocyanate (GuNCS, 0.1 M) in a mixture of
acetonitrile and valeronitrile (volume ratio 15/1 for A and B, and 85/15 for C and D).
c
Electrolyte A contains no 4-tert-butylpyridine (TBP)
but contains N-methylbenzimidazole (MBI, 0.5 M).
19156 J. Phys. Chem. C, Vol. 112, No. 48, 2008 Chen et al.
performance relative to device B (η ) 6.4% vs η ) 6.9%).
Because the presence of Li
+
ions might increase the amount of
TBP adsorption on TiO
2
surface,
32
lack of Li
+
ions in electrolyte
C could result in lower V
OC
as we have observed (Table 2).
Increasing the concentration of I
2
increases the concentration
of triiodide anions so increasing the hole transport mobility,
but this effect is balanced in a back-illuminated device by the
attenuation of the incident light in the visible region (λ < 500
nm). However, the cell performance improved significantly with
the additions of 0.05 M LiI and 1.0 M BMII in electrolyte D,
which is a new redox electrolyte for NP-DSSC reported by
Gra¨tzel and co-workers.
35
The performance of device D is
comparable to that of device B, which gives the best cell
performance for a back-illuminated NT-DSSC device.
4. Conclusion
In summary, we fabricated dye-sensitized solar cells based
on working electrodes made of highly ordered anodic titanium
oxide nanotube arrays of varied tube length directly formed on
Ti foil. The lengths of these ATO NT were controlled from 4
to 41 µm while varying the concentrations of NH
4
F electrolyte
(0.1, 0.25, 0.5, and 0.8 wt %) in EG in the presence of H
2
O(2
vol %) for various periods (t ) 0.5-8 h) of anodization. The
unwanted surface deposits introduced during anodization were
effectively removed simply with ultrasonic cleaning. After
sensitization of the ATO film with N3 dye, the N3/ATO film
served as a working electrode to fabricate a NT-DSSC device.
We observed a systematic variation of the photovoltaic perfor-
mance of NT-DSSC devices (with NH
4
F at 0.5 wt %) increasing
from 3.0% to 5.2% as L was increased from 6 µm(t ) 0.5 h)
to 30 µm(t ) 8 h). After posttreatment of ATO films with
TiCl
4
by annealing in two steps, the cell performance of the
NT-DSSC device increased further to η ) 7.0% at L ) 19 µm.
The best electrolyte tested for a back-illuminated device contains
LiI (0.1 M), I
2
(0.01 M), BMII (0.6 M), TBP (0.5 M), and
GuNCS (0.1 M) in a mixture of acetonitrile and valeronitrile
(v/v ) 15/1). We emphasize the significance of the present work
for the growth of ATO films with longer nanotubes at much
smaller periods of anodization, which might be an important
concern for future commercialization of NT-DSSC.
Acknowledgment. The National Science Council of the
Republic of China provided financial support through project
contracts 96-2628-M-009-018-MY2 and 96-2627-M-009-005.
Support from the MOE-ATU program and Niching Industrial
Corporation are also acknowledged.
Supporting Information Available: Side-view SEM images
of the ATO films shown in Figure 4, absorption spectra of the
N3/ATO films shown in Figure 5a, absorption spectra of dye-
loading experiments, TEM images of Pt-sputtered patterns, and
transmission spectra of Pt-sputtered FTO substrates. This
information is available free of charge via the Internet at http://
pubs.acs.org.
References and Notes
(1) O’Regan, B.; Gra¨tzel, M. Nature 1991, 353, 737.
(2) Nazeeruddin, M. K.; Angelis, F. D.; Fantacci, S.; Selloni, A.;
Viscardi, G.; Liska, P.; Ito, S.; Takeru, B.; Gra¨tzel, M. J. Am. Chem. Soc.
2005, 127, 16835.
(3) Wang, Q.; Ito, S.; Gra¨tzel, M.; Fabregat-Santiago, F.; Mora-Sero´,
I.; Bisquert, J.; Bessho, T.; Imai, H. J. Phys. Chem. B 2006, 110, 25210.
(4) Wei, M.; Konishi, Y.; Zhou, H.; Yanagida, M.; Sugihara, H.;
Arakawa, H. J. Mater. Chem. 2006, 16, 1287.
(5) Koide, N.; Islam, A.; Chiba, Y.; Han, L. J. Photochem. Photobiol.,
A 2006, 182, 296.
(6) Chiba, Y.; Islam, A.; Watanabe, Y.; Komiya, R.; Koide, N.; Han,
L. Jpn. J. Appl. Phys 2006, 45, L638.
(7) Law, M.; Greene, L. E.; Johnson, J. C.; Saykally, R.; Yang, P.
Nat. Mater. 2005, 4, 455.
(8) Mor, G. K.; Shankar, K.; Paulose, M.; Varghese, O. K.; Grimes,
C. A. Nano Lett. 2006, 6, 215.
(9) Song, M. Y.; Kim, D. K.; Ihn, K. J.; Jo, S. M.; Kim, D. Y.
Nanotechnology 2004, 15, 1861.
(10) Cheung, K. Y.; Yip, C. T.; Djurisˇic´, A. B.; Leung, Y. H.; Chan,
W. K. AdV. Funct. Mater. 2007, 17, 555.
(11) Peng, T.; Hasegawa, A.; Qiu, J.; Hirao, K. Chem. Mater. 2003,
15, 2011.
(12) Adachi, M.; Murata, Y.; Okada, I.; Yoshikawa, S. J. Electrochem.
Soc. 2003, 150, G488.
(13) Ngamsinlapasathian, S.; Sakulkhaemaruethai, S.; Pavasupree, S.;
Kitiyanan, A.; Sreethawong, T.; Suzuki, Y.; Yoshikawa, S. J. Photochem.
Photobiol., A 2004, 164, 145.
(14) Mor, G. K.; Varghese, O. K.; Paulose, M.; Shankar, K.; Grimes,
C. A. Solar Energy Mater. Solar Cells 2006, 90, 2011. and related references
therein.
(15) Wang, H.; Yip, C. T.; Cheung, K. Y.; Djurisˇic´, A. B.; Xie, M. H.;
Leung, Y. H.; Chan, W. K. Appl. Phys. Lett. 2006, 89, 023508.
(16) Zhu, K.; Neale, N. R.; Miedaner, A.; Frank, A. J. Nano Lett. 2007,
7, 69.
(17) Shankar, K.; Mor, G. K.; Prakasam, H. E.; Yoriya, S.; Paulose,
M.; Varghese, O. K.; Grimes, C. A. Nanotechnology 2007, 18, 065707.
(18) Shankar, K.; Bandara, J.; Paulose, M.; Weitasch, H.; Varghese,
O. K.; Mor, G. K.; LaTempa, T. J.; Thelakkat, M.; Grimes, C. A. Nano
Lett. 2008, 8, 1654.
(19) Kuang, D.; Brillet, J.; Chen, P.; Takata, M.; Uchida, S.; Miura, H.;
Sumioka, K.; Zakeeruddin, S. M.; Gra¨tzel, M. ACS Nano. 2008, 2, 1113.
(20) Park, J. H.; Lee, T W.; Kang, M. G. Chem. Commun. 2008, 2867.
(21) Ito, S.; Ha, M. C.; Rothenberger, G.; Liska, P.; Comte, P.;
Zakeeruddin, S. M.; Pe´chy, P.; Nazeeruddin, M. K.; Gra¨tzel, M. Chem.
Commun. 2006, 4004.
(22) Zhu, K.; Vinzant, T. B.; Neale, N. R.; Miedaner, A.; Frank, A. J.
Nano Lett. 2007, 7, 3739.
(23) Paulose, M.; Shankar, K.; Yoriya, S.; Prakasam, H. E.; Varghese,
O. K.; Mor, G. K.; Latempa, T. A.; Fitzgerald, A.; Grimes, C. A. J. Phys.
Chem. B 2006, 110, 16179.
(24) Ito, S.; Matsui, H.; Okada, K.; Kusano, S.; Kitamura, T.; Wada,
Y.; Yanagida, S. Sol. Energy Mater. Sol. Cells 2004, 82, 421.
(25) Ito, S.; Nazeeruddin, M. K.; Liska, P.; Comte, P.; Charvet, R.;
Pe´chy, P.; Jirousek, M.; Kay, A.; Zakeeruddin, S. M.; Gra¨tzel, M. Prog.
PhotoVolt.: Res. Appl. 2006, 14, 589.
(26) Ito, S.; Liska, P.; Comte, P.; Charvet, R.; Pe´chy, P.; Bach, U.;
Schmidt-Mende, L.; Zakeeruddin, S. M.; Kay, A.; Nazeeruddin, M. K.;
Gra¨tzel, M. Chem. Commun. 2005, 4351.
(27) Bandaranayake, K. M. P.; Senevirathna, M. K. I.; Weligamuwa,
P. M. G. M. P.; Tennakone, K. Coord. Chem. ReV. 2004, 248, 1277.
(28) Nazeeruddin, M. K.; Kay, A.; Rodicio, I.; Humphry-Baker, R.;
Mu¨ller, E.; Liska, P.; Vlachopoulos, N.; Gra¨tzel, M. J. Am. Chem. Soc.
1993, 115, 6382.
(29) Barbe´, C. J.; Arendse, F.; Comte, P.; Jirousek, M.; Lenzmann, F.;
Shklover, V.; Gra¨tzel, M. J. Am. Ceram. Soc. 1997, 80, 3157.
(30) Because the performance of a back-illuminated NT-DSSC is very
sensitive to the quality of the counter electrode, we tested the cell
performance with the electrode made of highly transparent FTO glass
sputtered by a thin layer of platinum. We found that the active area (0.28
cm
2
) of the counter electrode of Pt sputtered for 14 s (power 10 W; target
size 81 cm
2
; distance from the target 15 cm; deposition rate 10 nm min
-1
)
would give the best result (the corresponding TEM images and transmission
spectra are given in the Supporting Information as Figures S8 and S9,
respectively). Furthermore, masking the rest of the active area by sputtering
Pt for 10 min increases the electric conductivity of the counter electrode,
which improves the cell performance significantly (Supporting Information
Figure S10).
(31) The N3 dye has a higher extinction coefficient than does N719 so
that the J
SC
of the DSSC made of N3 is larger than that made of N719.
However, N719 contains ammonium cations to remedy the TiO
2
surface
so to obtain a larger V
OC
than N3. Refer to, e.g., Horiuchi, T.; Miura, H.;
Sumioka, K.; Uchida, S. J. Am. Chem. Soc. 2004, 126, 12218.
(32) Nakade, S.; Kanzaki, T.; Kubo, W.; Kitamura, T.; Wada, Y.;
Yanagida, S. J. Phys. Chem. B 2005, 109, 3480.
(33) Boschloo, G.; Ha¨ggman, L.; Hagfeldt, A. J. Phys. Chem. B 2006,
110, 13144.
(34) Hara, K.; Dan-oh, Y.; Kasada, C.; Ohga, Y.; Shinpo, A.; Suga, S.;
Sayama, K.; Arakawa, H. Langmuir 2004, 20, 4205.
(35) Gao, F.; Wang, Y.; Zhang, J.; Shi, D.; Wang, M.; Humphry-Baker,
R.; Wang, P.; Zakeeruddin, S. M.; Gra¨tzel, M. Chem. Commun. 2008, 2635.
JP806281R
Anodic TiO
2
Nanotube Arrays for DSSC J. Phys. Chem. C, Vol. 112, No. 48, 2008 19157