- Trang chủ >>
- Khoa Học Tự Nhiên >>
- Vật lý
facile synthesis and characterization of novel nanocomposites
Bạn đang xem bản rút gọn của tài liệu. Xem và tải ngay bản đầy đủ của tài liệu tại đây (934.05 KB, 6 trang )
Materials Chemistry and Physics 100 (2006) 507–512
Facile synthesis and characterization of novel nanocomposites
of titanate nanotubes and rutile nanocrystals
Jiaguo Yu
∗
, Huogen Yu
State Key Laboratory of Advanced Technology for Materials Synthesis and Processing, Wuhan University of Technology, Wuhan 430070, China
Received 23 July 2005; received in revised form 20 January 2006; accepted 4 February 2006
Abstract
The nanocomposites of one-dimensional (1D) titanate nanotubes and 0D rutile nanocrystals were fabricated by hydrothermal treatment of bulky
rutile TiO
2
powders in a 10 M NaOH solution without using any templates and catalysts. The as-prepared samples were characterized with transmis-
sion electron microscopy (TEM), high-resolution transmission electron microscopy (HRTEM), X-ray diffraction (XRD), Brunauer–Emmett–Teller
(BET) surface area, Fourier transform infrared spectroscopy (FTIR), UV–visible spectrophotometry (UV–vis), Raman spectroscopy and X-ray
photoelectron spectroscopy (XPS). It was found that many small rutile nanocrystal particles of about 5 nm could uniformly attach to the outer
surface and in the inner of the titanate nanotubes, forming an interesting and novel nanocomposite structure. Adjusting reaction time could control
the amount of rutile nanoparticles in the nanocomposites. With increasing reaction time, the specific surface areas, porosity, pore volume, UV
absorption and band gap energies of the nanocomposites gradually increased due to the fact that rutile particles were steadily turned into the tubular
nanocomposites, finally completely formed titanate nanotubes.
© 2006 Elsevier B.V. All rights reserved.
Keywords: Nanocomposites; Nanotubes; Nanocrystals; Fabrication; Hydrothermal reaction
1. Introduction
The controlled synthesis of inorganic materials with specific
size and morphology is an important aspect in the development
of new materials in many fields such as advanced materials,
catalysis, medicine, electronics, ceramics, pigments, cosmet-
ics, etc. [1,2]. Since the discovery of carbon nanotubes in 1991
[3], one-dimensional (1D) nanostructured materials (nanotubes,
nanobelts, nanowires and nanorods) have attracted consider-
able attention due to their distinctive geometries, novel physical
and chemical properties, and potential applications in numer-
ous areas such as nanoscale electronics and photonics [4–7].
One-dimensional nanostructured TiO
2
are of great interest for
possible applications to high effect solar cell [8], photocatalysts
[9,10], gas sensor [11], molecular straws [12] and semiconduc-
tor devices and so on where the tuning of the pore size and
overall morphology are crucial. The titanium oxide nanotubes
are of particular interest, since they have larger surface area and
higher photocatalytic activity [13].TiO
2
tubes with diameters
∗
Corresponding author. Tel.: +86 2787883610; fax: +86 2787880261.
E-mail address: (J. Yu).
of 70–100 nm were produced using a sol–gel processing [14] or
porous alumina as template [15,16]. The synthesis of smaller
TiO
2
tubes with a diameter of about 8 nm were also reported by
Kasuga et al. by treating TiO
2
in the alkaline solution [17,18].
This chemical process opened a novel route to form TiO
2
nan-
otubes with the crystalline wall.
Although many methods have been used to fabricate 1D
nanostructured TiO
2
(such as nanotubes [19–21], nanobelts
[22,23] and nanowires [24,25]), including sol–gel, templates
and hydrothermal synthesis, these methods have mainly been
concentrated on monomorphic 1D nanostructures, such as nan-
otubes, nanobelts and nanowires, etc. However, the synthesis
of the nanocomposites of 1D nanostructures and 0D nanocrys-
talline remains a challenge to materials scientists [26,27].
Herein, we report that the nanocomposites of titanate nan-
otubes and rutile nanocrystals can be easily obtained by a simple
hydrothermal treatment of bulky rutile TiO
2
particles in a 10 M
NaOH solution without using any templates and catalysts.
2. Experimental
In a typical synthesis, titania powders (0.5 g, about 50–300 nm in size, pre-
pared by calcining P25 at 900
◦
C for 2 h) and an aqueous solution of NaOH
(10 M, 150 ml) were placed into a 200 ml Teflon-lined autoclave. The mixture
0254-0584/$ – see front matter © 2006 Elsevier B.V. All rights reserved.
doi:10.1016/j.matchemphys.2006.02.002
508 J. Yu, H. Yu / Materials Chemistry and Physics 100 (2006) 507–512
was stirred for 10 minto form a milk-like suspension, sealed and hydrothermally
treated at 140
◦
C for 24, 48, 96 and 144 h, respectively. The white precipitate was
collected and washed with distilled water until a pH value near 6 was reached.
The precipitate was then ground in alcohol followed by ultrasonic-assisted dis-
persion. After a second filtration and alcohol washing step, the sample was
oven-dried at 80
◦
C for more than 4 h.
An X-ray diffractometer (XRD, Bruker D8 Advance XRD with Cu K␣
radiation) was used to characterize the crystalline phase of the products. The
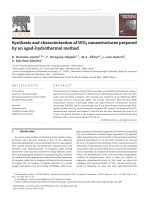
Fig. 1. TEM (a), HRTEM images (b–e) and SAED pattern (f) of the starting material (rutile) (a) and the products (b–f) prepared by a hydrothermal reactionat140
◦
C
for 48 (b), 96 (c) and 144 h (d–f).
J. Yu, H. Yu / Materials Chemistry and Physics 100 (2006) 507–512 509
accelerating voltage and the applied current were 40 and 40 mA, respectively.
X-ray photoelectron spectroscopy measurements were performed on a PHI
Quantum 2000 XPS system with a monochromatic Al K␣ source and a charge
neutralizer. The binding energies were referenced to the C1s peak of the sur-
face adventitious carbon at 284.8 eV. Transmission electron microscopy (TEM)
and high-resolution transmission electron microscopy (HRTEM) images, which
were obtained using a JEOL TEM-2010F at acceleration voltage of 200 kV, were
used to observe or determine the morphology, size and identity of nanoneedles.
Raman spectra of the powder samples on a glass slide were measured using a
Renishaw 1000 micro-Raman system. Fifty times magnification objectives were
selected. The excitation source used was an Argon ion laser operating at 514.5 nm
with an output power of 20 mW. UV–vis absorption spectra of the samples were
obtained for the dry-pressed disk samples using a UV–vis spectrophotometer
(Cary 100 Scan Spectrophotometers, Varian, U.S.A.). Infrared (IR) spectra on
pellets of the samples mixed with KBr were recorded on a Nicolet Magna 560
FTIR spectrometer at a resolution of 4 cm
−1
. The Brunauer–Emmett–Teller
(BET) surface area (S
BET
) and pore size distribution were determined using a
Micromeritics ASAP 2010 nitrogen adsorption apparatus. All the samples mea-
sured were degassed at 100
◦
C before the actual measurements.
3. Results and discussion
Fig. 1 shows the TEM, HRTEM images and SAED pattern of
the starting material (rutile) and the products. The particle size
of the starting material is from several tens to several hundreds
of nanometers (Fig. 1a). Fig. 1b and c show the TEM images
of the products obtained by a hydrothermal reaction at 140
◦
C
for 48 and 96 h, respectively. The parent long titanate nanotubes
were formed by a hydrothermal reaction of rutile TiO
2
ina10M
NaOH solution. Many rutile nanocrystals of 5–10 nm attached
to the outer surface of the titanate nanotubes and some rutile
nanocrystals of about 5 nm also existed in the inner of the nan-
otubes, forming an interesting composite structurethat possesses
both the surface properties of rutile nanocrystals and most mor-
phology and mechanical properties of titanate nanotubes. The
phase structures of the nanocomposites were confirmed by the
XRD patterns of the samples. The diffraction peaks from both
rutile and the parent titanate could be observed in the reaction
products (Fig. 2b and c). To the best of our knowledge, this is the
first time to observe this novel morphological structure of the
nanocomposites of rutile nanocrystals and titanate nanotubes.
Fig. 2. XRD patterns of the starting material (a) and the products prepared by
hydrothermal reactions at 140
◦
C for 48 (b), 96 (c) and 144 h (d).
We expect that it would be complicated and difficult to delib-
erately create such a peculiar structure of binary composition
on nanoscale. Usually, the catalytic reactions take place on the
surface of the catalyst. Catalysts with a particle size at a scale of
several nanometers should exhibit a superior activity because of
its large specific surface. However, nanoparticles have a strong
tendency to agglomerate into larger particles, resulting in an
adverse effect on catalyst performance. Furthermore, it is very
hard to recover them after the reaction, leading to a potential
difficulty in downstream separation. Continuing efforts have
been made to develop alternate approaches to synthesize the
structures that can be separated readily and have the superior per-
formance of nanocrystals. Importantly, this delicate composite
structure was achieved through a simple hydrothermal reac-
tion of common rutile TO
2
powders and a concentrated NaOH
solution.
Fig. 1d is a low magnification TEM image of the products
prepared by a hydrothermal reaction at 140
◦
C for 144 h, which
shows large quantity of tubular materials with narrow size dis-
tribution. The diameters of the tubular materials are around
8–10 nm and the lengths range from several tens to several hun-
dreds of nanometers. A typical selected area electron diffraction
pattern (SAED) taken from an area containing a large amount of
nanotubes is shown in Fig. 2f. Unlike that reported by Kasuga et
al. [17,18], we found that the electron diffraction patterns cannot
be assigned to rutile or anatse TiO
2
, but be assigned to titanate
(H
2
Ti
3
O
7
). Fig. 1e shows HRTEM images of the sample (d).
The HRTEM images clearly show that (1) the tubular structures
are well crystalline tubes with multiple shells, with an inner shell
diameter of about 8.0 nm, a shell spacing of about 0.75 nm and
an average tube diameter of about 12.0 nm; (2) the structures of
different shells are well correlated; (3) the tubes are open ended.
Further investigations showed that adjusting hydrothermal
reaction time could control the amount of rutile nanocrystals in
the nanocomposites. Fig. 2 shows the XRD patterns of the start-
ing material and the products. It can be seen that when reaction
time reaches 48 h, the diffraction peaks of titanate nanotubes
appear [20,26,27]. With increasing reaction time, the peaks of
rutile disappeared steadily and the intensity of the diffraction
peak of titanate enhanced. At 144 h, all rutile phases were com-
pletely turned into titanate nanotubes. Fig. 2d is an XRD profile
taken from the products obtained at 140
◦
C for 144 h, showing
that the phase structure of the nanotubes agreed with neither
anatase nor rutile phase of TiO
2
. XRD diffraction and SEAD
image indicated that the structure of the present tubular materi-
als was similar to that expected for a layered titanate H
2
Ti
3
O
7
[26,27].
In order to determine the chemical composition of the prod-
ucts, XPS experiments were performed on the products obtained
at different reaction time. Fig. 3 shows a typical X-ray photoelec-
tron spectroscopy (XPS) survey spectrum of the nanocomposites
obtained at 140
◦
C for 96 h. Only Ti and O peaks were observed
in Fig. 3 together with a C peak that was attributed to the adventi-
tious hydrocarbon from the XPS instrument itself. Further XPS
analysis showed that the product consisted of Ti and O in an
atomic ratio of about 1:2.3. Ignoring the possible existence of
undetectable light elements such as H in the sample, the titanium
510 J. Yu, H. Yu / Materials Chemistry and Physics 100 (2006) 507–512
Fig. 3. XPS survey spectrum of the nanocomposites prepared by hydrothermal
reaction at 140
◦
C for 96 h.
nanotube should in general be called TiO
x
nanotubes instead of
TiO
2
, and we expected that the oxygen composition deviation
from TiO
2
might play an important role in the formation of our
nanotubes. The similar results were also obtained for the nan-
otubes obtained at 140
◦
C for 48 and 144 h. Energy-dispersive
X-ray (EDX) analysis also showed that there was no sodium in
the resulting product (as shown in Fig. 4). The yield and purity
of the nanocomposites or nanotubes are estimated to be higher
than 95 and 90%, respectively, based on the TEM, XRD, XPS
and EDX results.
The tube-like structures of the products were further exam-
ined using BET analysis, FTIR, UV–vis and Laser Raman spec-
tra. Table 1 shows effect of reaction time on BET specific surface
areas and pore parameters of the products. It could be seen that
with increasing reaction time, the specific surface areas, porosity
and pore volume of the tubular materials gradually increased,
which was ascribed to the fact that rutile particles in size of
50–300 nm were steadily turned into the tubular nanocompos-
ites, finally completely formed titanate nanotubes. The pore size
of the samples was about 8–10 nm and almost kept the same
due to the diameter of the tubular materials having no obvious
change.
Fig. 5 shows the FTIR spectra of the starting material and
the product prepared at different reaction time. There is a large
amount of water and hydroxyl groups existed in the tubular
products because of the existence of a bending vibration of
H
O H at 1630 cm
−1
, and a strong stretching vibration of O H
Fig. 4. EDX spectrum of the nanocomposites prepared by hydrothermal reaction
at 140
◦
C for 96 h.
Table 1
Effect of reaction time on BET specific surface areas and pore parameters of the
tubular products
Reaction
time (h)
S
BET
a
(m
2
g
−1
)
Porosity
b
Pore volume
c
(ml g
−1
)
Pore size
d
(nm)
0 2.9 1.8 0.005 6.6
24 29.9 22.1 0.061 7.9
48 81.4 42.1 0.196 9.6
96 154.0 59.7 0.400 10.4
144 244.5 66.7 0.542 8.9
a
BET surface area calculated from the linear part of the BET plot
(P/P
0
= 0.05 − 0.3).
b
The porosity is estimated from the pore volume determined using the adsorp-
tion branch of the N
2
isotherm curve at the P/P
0
= 0.995 single point.
c
Total pore volume, taken from the volume of N
2
adsorbed at P/P
0
= 0.995.
d
Average pore diameter,estimated using the adsorption branch of the isotherm
and the Barrett–Joyner–Halenda (BJH) formula.
at 3400 cm
−1
. Notably, the amount of adsorbed water in thetubu-
lar materials increased with increasing reaction time, owing to
the increase of the specific surface areas and pore volumes.
J. Yu, H. Yu / Materials Chemistry and Physics 100 (2006) 507–512 511
Fig. 6. UV–vis absorption spectra of the starting material (a) and the product
obtained at 140
◦
C for 48 (b), 96 (c) and 144 h (d).
spectrum are due to Ti
O Ti [28]. For the product obtained at
140
◦
C for 96 (c) and 144 h (d), the peaks at 250 and 620 cm
−1
had almost disappeared and new peaks were observed near 290
and 660–760 cm
−1
. The peaks at 290 and 660–760 cm
−1
might
be suggested to be due to H
O Ti, as reported for Na
2
O–TiO
2
glass [29].
Although the exact formation mechanism for these 1D and
0D nanocomposite structures is still unclear, it is obvious that
the growth of the nanocomposite structures is not template-
directed. Since the raw materials used in our synthesis are oxides
and NaOH, it is possible that the nanocomposite structures
are formed by a simple reaction-crystallization process (RC)
[5], in which bulky TiO
2
particles gradually react with NaOH
to form water soluble Na
2
Ti
3
O
7
in solution under hydrother-
mal treatment. Na
2
Ti
3
O
7
is then turned into H
2
Ti
3
O
7
via acid
treatment. The unreacted TiO
2
particles serve as the sites for
the heterogeneous nucleation of the titanate nanotubes, which
subsequently grow into tube-shaped nanocomposite structures
through a reaction-crystallization mechanism.
Fig. 7. Laser Raman spectra of the starting material (a) and the product obtained
at 140
◦
C for 48 (b), 96 (c) and 144 h (d).
4. Conclusions
In conclusion, the nanocomposites of titanate nanotubes and
rutile nanocrystals could be easily synthesized by a simple
hydrothermal reaction of bulky rutile powders and 10 M NaOH
solution without using any templates and catalysts. The inner
and outer diameters of the nanotubes were approximately 5 and
8 nm, respectively. The amount of rutile nanocrystals (about
5–10 nm in size) in the nanocomposites could be adjusted by
changing reaction time. With increasing reaction time, the spe-
cific surface areas, porosity, pore volume, UV absorption and
band gap energies of the nanocomposites gradually increased
due to the fact that rutile particles were steadily turned into
the tubular nanocomposites, finally completely formed titanate
nanotubes.
Acknowledgments
This work was partially supported by NSFC (50272049 and
20473059), the Excellent Young Teachers Program of MOE of
China, WUT2004Z03 and project-sponsored by SRF for ROCS
of SEM of China.
References
[1] S. Mann, G.A. Ozin, Nature 382 (1996) 313.
[2] T.S. Ahmadi, Z.L. Wang, T.C. Green, A. Henglein, M.A. El-Sayed, Science
272 (1996) 1924.
[3] S. Iijima, Nature 354 (1991) 56.
[4] A.P. Alivisatos, Science 271 (1996) 933.
[5] J.G. Yu, J.C. Yu, W.K. Ho, L. Wu, X.C. Wang, J. Am. Chem. Soc. 126
(2004) 3422.
[6] C.R. Martin, Science 226 (1994) 1961.
[7] A.M. Morales, C.M. Lieber, Science 279 (1998) 208.
[8] U. Bach, D. Lupo, P. Comte, J.E. Moser, F. Welssortels, J. Scallbeck, H.
Spreitzer, M. Gratzel, Nature 395 (1998) 583.
[9] J.G. Yu, H.G. Yu, B. Cheng, X.J. Zhao, J.C. Yu, W.K. Ho, J. Phys. Chem.
B 107 (2003) 13871.
[10] J.C. Yu, J.G. Yu, W.K. Ho, Z.T. Jiang, L.Z. Zhang, Chem. Mater. 14 (2002)
3808.
[11] A.M. Taurino, M. Epifani, T. Toccoli, S. Iannotta, P. Siciliano, Thin Solid
Films 436 (2003) 52.
[12] M.R. Pederson, J.Q. Broughton, Phys. Rev. Lett. 69 (1992)
2689.
[13] M. Adachi, Y. Murata, M. Harada, Chem. Lett. 8 (2000) 942.
[14] P. Hoyer, Langmuir 12 (1996) 141.
[15] H. Imai, Y. Takei, K. Shimizu, M. Matsuda, H. Hirashima, J. Mater. Chem.
9 (1999) 2971.
[16] M. Zhang, Y. Bando, K. Wada, J. Mater. Sci. Lett. 20 (2001)
167.
[17] T. Kasuga, M. Hiramatsu, A. Hoson, T. Sekino, K. Niihara, Langmuir 14
(1998) 3160.
[18] T. Kasuga, M. Hiramatsu, A. Hoson, T. Sekino, K. Niihara, Adv. Mater. 11
(1999) 1307.
[19] G.H. Du, Q. Chen, R.C. Che, Z.Y. Yuan, L.M. Peng, Appl. Phys. Lett. 78
(2001) 3702.
[20] X.M. Sun, Y.D. Li, Chem. Eur. J. 9 (2003) 2229.
[21] Y.C. Zhu, H.L. Li, Y. Koltypin, Y.R. Hacohen, A. Gedanken, Chem. Com-
mun. (2001) 2616.
[22] X.M. Sun, X. Chen, Y.D. Li, Inorg. Chem. 41 (2002) 4996.
[23] J.G. Yu, S.W. Liu, B. Cheng, J.F. Xiong, Y. Yu, J.B. Wang, Mater. Chem.
Phys. 95 (2006) 206.
512 J. Yu, H. Yu / Materials Chemistry and Physics 100 (2006) 507–512
[24] Z.Y. Yuan, W. Zhou, B.L. Su, Chem. Commun. (2002) 1202.
[25] C.K. Xu, Y.J. Zhan, K.Q. Hong, G.H. Wang, Solid State Commun. 126
(2003) 545.
[26] H.Y. Zhu, X.P. Gao, Y. Lan, D.Y. Song, Y.X. Xi, J.C. Zhao, J. Am. Chem.
Chem. 126 (2004) 8380.
[27] Y. Lan, X.P. Gao, H.Y. Zhu, Z.F. Zheng, T.Y. Yan, F. Wu, S.P. Ringer, D.Y.
Song, Adv. Funct. Mater. 15 (2005) 1310.
[28] O. Manuel, J.V. Garcia-Ramos, C.J. Serna, J. Am. Ceram. Soc. 75 (1992)
2010.
[29] F. Miyaji, T. Yoko, H. Kozuka, S. Sakka, J. Mater. Sci. 26 (1991) 248.