- Trang chủ >>
- Khoa Học Tự Nhiên >>
- Vật lý
growth of nanowires
Bạn đang xem bản rút gọn của tài liệu. Xem và tải ngay bản đầy đủ của tài liệu tại đây (7.5 MB, 51 trang )
Growth of nanowires
N. Wang
a,
*
,Y.Cai
a
, R.Q. Zhang
b
a
Department of Physics and the Institute of Nano Science and Technology,
the Hong Kong University of Science and Technology, Hong Kong, China
b
Center of Super-Diamond and Advanced Films (COSDAF) & Department of Physics and Materials Science,
City University of Hong Kong, Hong Kong, China
Available online 5 March 2008
Abstract
The tremendous interest in nanoscale structures such as quantum dots (zero-dimension) and wires (quasi-one-dimension) stems from their size-
dependent properties. One-dimensional (1D) semiconductor nanostructures are of particular interest because of their potential applications in
nanoscale electronic and optoelectronic devices. For 1D semiconductor nanomaterials to have wide practical application, however, several areas
require further development. In particular, the fabrication of desired 1D nanomaterials with tailored atomic structures and their assembly into
functional devices are still major challenges for nanotechnologists. In this review, we focus on the status of research on the formation of nanowire
structures via highly anisotropic growth of nanocrystals of semiconductor and metal oxide materials with an emphasis on the structural
characterization of the nucleation, initial growth, defects and interface structures, as well as on theoretical analyses of nanocrystal formation,
reactivity and stability. We review various methods used and mechanisms involved to generate 1D nanostructures from different material systems
through self-organized growth techniques including vapor–liquid–solid growth, oxide-assisted chemical vapor deposition (without a metal
catalyst), laser ablation, thermal evaporation, metal-catalyzed molecular beam epitaxy, chemical beam epitaxy and hydrothermal reaction. 1D
nanostructures grown by these technologies have been observed to exhibit unusual growth phenomena and unexpected properties, e.g., diameter-
dependent and temperature-dependent growth directions, structural transformation by enhanced photothermal effects and phase transformation
induced by the point contact reaction in ultra-thin semiconductor nanowires. Recent progress in controlling growth directions, defects, interface
structures, structural transformation, contacts and hetero-junctions in 1D nanostructures is addressed. Also reviewed are the quantitative
explorations and predictions of some challenging 1D nanostructures and descriptions of the growth mechanisms of 1D nanostructures, based on the
energetic, dynamic and kinetic behaviors of the building block nanostructures and their surfaces and/or interfaces.
# 2008 Elsevier B.V. All rights reserved.
Contents
1. Introduction . 2
2. Growth technologies for nanowires . . 3
2.1. Vapor–liquid–solid (VLS) technique . 3
2.2. Laser-assisted growth . . . 5
2.3. Thermal evaporation 6
2.4. Metal-catalyzed molecular-beam epitaxy . . 7
2.5. Solution methods . 9
3. Growth mechanisms of nanowires . . . 9
3.1. Metal-catalyzed growth . . 9
3.2. Vapor–solid growth 14
3.2.1. Internal anisotropic surfaces 14
3.2.2. Crystal defects . . 14
3.2.3. Self-catalytic growth. . 15
www.elsevier.com/locate/mser
A
vailable online at www.sciencedirect.com
Materials Science and Engineering R 60 (2008) 1–51
* Corresponding author. Tel.: +852 2358 7489; fax: +852 2358 1652.
E-mail address: (N. Wang).
0927-796X/$ – see front matter # 2008 Elsevier B.V. All rights reserved.
doi:10.1016/j.mser.2008.01.001
3.3. Oxide-assisted growth . 16
3.3.1. Kinetics and reactivity of silicon oxide in nucleation and growth . . 16
3.3.2. Effect of defects in 1D growth. 18
3.3.3. Effect of external electrical field in 1D growth . . 19
3.4. Self-assembly growth from solution . . . 20
3.4.1. Solution-liquid-solid (SLS) growth from seeds . . . 20
3.4.2. Self-assembly oriented attachment growth . 20
3.4.3. Anisotropic growth of crystals by kinetic control . 20
4. Controlled growth of nanowires. . . 22
4.1. Control of structures, growth direction and defects in nanowires 22
4.1.1. Interface structures . 22
4.1.2. The growth direction of VLS nanowires . . 23
4.1.3. Defects in nanowires 28
4.1.4. From nanowire to nanoribbon . 31
4.2. Structural transformation in nanowires . 32
4.2.1. Surface relaxation and saturation of zinc oxide nanowires . . . 32
4.2.2. The stability of Si nanowires . . 34
4.2.3. Optical rapid annealing effect . 35
4.3. Contacts and heterostructures in nanowires . . 37
4.3.1. Metal-semiconductor contacts . 37
4.3.2. Heterostructures in nanowires . 39
5. Other challenging nanowire structures . . 41
5.1. Non-tetrahedral Si nanowires 41
5.2. Oxide nanowires 43
5.2.1. Silicon oxide nanowires . 43
5.2.2. Silicon dioxide tube-like nanowires . 45
5.2.3. Zinc oxide tube-like nanowires 46
6. Concluding remarks . . 47
Acknowledgements . . 47
References 48
1. Introduction
In the physics of nanoscale structures, quantum effects play
an increasingly prominent role [1]. Quantum wires have
demonstrated interesting electrical transport properties that are
not seen in bulk materials. This is because, in quantum wires,
electrons could be quantum-confined laterally and thus could
occupy discrete energy levels that are different from the energy
bands found in bulk materials. Due to low electron density and
low effective mass, the quantized conductivity is more easily
observed in semiconductors, e.g., Si and GaAs, than in metals
[2]. In addition to the opportunity to describe the new physics
demonstrated by nanowires, much effort has been devoted to
fabricating high-quality semiconductor nanowires by employ-
ing different techniques because of the importance of
semiconductor materials to the electronics industry. The most
popular technique used to fabricate semiconductor artificial
structures with feature sizes in the sub-100 nm range is
lithography [3,4], which involves tedious processes of
photoresist removal, chemical or ion-beam etching and surface
passivation, etc. On semiconductor nanostructures, etching
processes always lead to significant surface damage, and thus
surface states are introduced to the nanostructures. Such
damage may not be serious for the structures in the micrometer
range. However, structures with dimensions in the nanometer
range are very sensitive to the surface states or impurities
induced by fabrication processes. One-dimensional (1D)
nanostructures formed ‘‘naturally’’ (also called self-organized
growth) without the aids of ex situ techniques, such as chemical
etching, are desirable not only in fundamental research but also
in future nanodevice design and fabrication.
In this paper, various novel technologies for synthesizing
nanowires are reviewed. A well-known self-organized growth
mechanism for creating nanowires is the vapor–liquid–solid
(VLS) process (also known as metal catalytic growth [5]). This
technique can produce free-standing crystalline nanowires of
semiconductor and metal oxide materials with fully controlled
nucleation sites and diameters from pre-formed metal catalysts.
Since the 1960s, semiconductor whiskers grown by this
technique [5,6] have been extensively studied. In recent years,
various new techniques have been developed to realize 1D
nanostructures, such as laser-assisted chemical vapor deposi-
tion (CVD) [7–10], oxide-assisted CVD (without a metal
catalyst) [11], thermal CVD [12], metal-catalyzed molecular
beam epitaxy (MBE) [13–15] and chemical beam epitaxy
(CBE) [16]. Though the number of various kinds of 1D
nanostructures fabricated via different techniques increases
dramatically every year, our understanding of the basic process
of 1D nanostructure formation has not reached maturity. How to
fabricate desired 1D nanomaterials with tailored atomic
structures and how to integrate functional nanostructures into
devices are still challenging issues for materials scientists. For
1D semiconductor nanomaterials to have wide practical
applications, however, many areas require further pursuing.
N. Wang et al. / Materials Science and Engineering R 60 (2008) 1–512
This review focuses on describing the status of research on the
formation of semiconductor and metal oxide nanowires. It
consists of four sections. After a brief introduction, the first
section introduces the growth technologies currently employed
to synthesize nanowires with an emphasis on advances in the
newly developed techniques of metal-catalyzed MBE and CBE
by which high-quality ultra-thin nanowire structures have been
fabricated. These techniques allow high levels of control over
atomic structures, chemical composition, defects, doping
states, junctions, and so forth. We next discuss several novel
nucleation and growth mechanisms and theoretical analyses of
the formation, reactivity and stability of nanocrystals. The
initial alloying process of metal catalysts, growth of nanowire
nuclei, changes in nanowire shapes and diameters as well as
deposition of source materials are described in the second
section. In the third section, we describe the controlled growth
and structures of nanowires. Recent progress in controlling
growth directions, defects, interface structures, structural
transformation, contacts and hetero-junctions is addressed. In
the last section, we describe some theoretical nanowire
structures that have not yet been observed or are challenging
to synthesis.
2. Growth technologies for nanowires
2.1. Vapor–liquid–solid (VLS) technique
The VLS technique was first described by Wagner and Ellis
[5] in 1964. They used Au particles as catalysts to grow
crystalline semiconductor whiskers from vapor sources such as
SiCl
4
or SiH
4
. The principle for Si whisker growth is
schematically shown in Fig. 1(a). The Au particles deposited
on the surface of an Si substrate react first with Si to form Au–Si
alloy droplets at a certain temperature. As shown in the Au–Si
phase diagram in Fig. 1(b), the melting temperature of the Au–
Si alloy at the eutectic point is very low (about 363 8Catan
Au:Si ratio of 4:1) compared with that of Au or Si. Au and Si
can form a solid solution for all Si content (0–100%). In the
case of Si deposition from the vapor mixture of SiCl
4
and H
2
,
the reaction between SiCl
4
and H
2
happens at a temperature
above 800 8C without the assistance of catalysts. Below this
temperature, almost no deposition of Si occurs on the substrate
surface [6]. At a temperature above 363 8C, Au particles can
form Si–Au eutectic droplets on Si surfaces, and the reduction
of Si occurs at the Au–Si droplets due to a catalytic effect. The
Au–Si droplets absorb Si from the vapor phase resulting in a
supersaturated state. Since the melting point of Si (1414 8 C) is
much higher than that of the eutectic alloy, Si atoms precipitate
from the supersaturated droplets and bond at the liquid–solid
interface, and the liquid droplet rises from the Si substrate
surface. The absorption, diffusion and precipitation processes
of Si as schematically shown by the path 1 ! 2 ! 3inFig. 1(c)
involve vapor, liquid and solid phases. The typical feature of the
VLS reaction is its low activation energy compared with normal
vapor–solid growth. The whiskers grow only in the areas seeded
by metal catalysts, and their diameters are mainly determined
by the sizes of the catalysts. The VLS method can result in
unidirectional growth of many materials [6]. It has become a
widely used technique for fabricating a variety of 1D
nanomaterials that include elemental semiconductors [6–
8,17–23], II–VI semiconductors [24–26], III–V semiconduc-
tors [27–41], oxides [42–47], nitrides [48] and carbides [49,50].
The experimental setup of the VLS reaction has been
reported in previous work [5,6]. In brief, for Si nanowire
growth, the sources can be SiH
4
mixed in H
2
at a typical ratio of
1:10. The reaction gases have to be diluted to about 2% in an Ar
atmosphere. The pressure for the reaction is about 200 Torr, and
the flow rate is kept at 1500 sccm. Au nanoparticles can be
prepared simply by first depositing an Au thin film on an Si
substrate using sputtering or thermal evaporation and then
annealing the thin film to form droplets. Fig. 2(a) shows
uniform Au nanoparticles formed by annealing an Au thin film
(thickness = 1 nm) at 500 8C. A thick film results in large
diameters of Au particles. Au particles arrays can be prepared
by lithography techniques. Fig. 2(b) shows an Au disc array
prepared by e-beam lithography. The thickness of the Au
pattern is critical to the final sizes of the nanoparticles
generated by the subsequent annealing. Au films that are too
thin always result in splitting of the Au pattern (Fig. 2(c)). A
proper treatment of the substrate surface by chemical etching
and cleaning can result in the catalyst totally wetting the
substrate surface (see Fig. 3(a)), which is important for later
growth of the nanowires epitaxially on the substrate. Because of
the oxide layer on the substrate surface or impurities on the
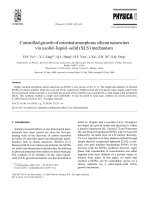
Fig. 1. Schematic illustration of Si whisker growth from vapor phases via Au–Si catalytic droplets. (a) The Au–Si droplet formed on an Si substrate catalyzes the
whisker growth; (b) the Au–Si phase diagram. (c) The diffusion path of the source materials through a metal droplet; (d) the whisker growth can be catalyzed with a
solid catalyst.
N. Wang et al. / Materials Science and Engineering R 60 (2008) 1–51 3
catalyst surface induced by the lithography technique, Au
catalysts may not wet the substrate surface. In this case, Si
nanowires may not have orientation relationship with the
substrate and grow along random directions (Fig. 3(b)). For Si
nanowires with diameters larger than 20 nm, their growth is
generally along the h111i direction. Thin Si nanowires with
diameters smaller than 20 nm, however, show interesting
growth behaviors for example the diameter-dependent and
temperature-dependent growth direction (see details in Section
4.1).
Before growing Si nanowires, activation of Au nanoparticles
may be needed. An inactivated Au particle will not lead to
nanowire growth. The activation of Au–Si alloy droplets can be
carried out in Ar or H
2
atmospheres. We have found that plasma
treatment is effective for cleaning and activating the surfaces of
Au catalysts. HCl mixed in the reaction gases can also
effectively activate Au particles. However, the activation
temperature largely relies on the diameters of Au catalysts. For
large Au catalysts (diameter > 50 nm), the activation tempera-
tures can be 800 8C or higher. Large Au catalysts can easily wet
a Si substrate at sufficiently high temperatures and thus Si
nanowires grow epitaxially even on an untreated substrate. In
the growth of thin Si nanowires (diameter <20 nm), the growth
temperatures are about 500 8C. Too high activation tempera-
tures may cause evaporation of the catalysts. The vacuum
condition is another critical experimental parameter that affects
nanowire growth. Low vacuum conditions may cause
evaporation of Si from the substrate surface and thus result
in a rough surface.
Under isothermal conditions, the crystalline structures of Si
whiskers are generally perfect, though steps and facets occur on
the whiskers’ surfaces. Twinning structures and twin-dendrites
(or branched whiskers) have been frequently observed in the
whiskers. Though the cross-section of most whiskers is round
(determined by the metal droplets), ribbon-like whiskers with a
rectangular cross-section often coexist and show the h111i or
h112i growth direction [17]. Dislocations or other crystalline
defects are not essential for the growth of the whiskers via the
VLS method. In different semiconductor material systems,
whiskers with similar morphologies and structures have been
fabricated by the VLS reaction and a variety of whisker forms
have been obtained [6]. Although the VLS technique has been
widely used for the fabrication of nanowires in recent years, the
real absorption, reaction and diffusion processes of source
atoms through the catalyst are complicated and largely depend
on the experimental conditions and the material systems [52–
54]. Many experiments have shown the deviation of some
nanowire growth from the classical VLS mechanism. For
example, it has been observed that nanowires of Ge [18,19],Si
[22], GaAs [27] and InAs [28] can grow even at temperatures
below their eutectic points. There has been a long-standing
debate on whether the metal catalysts in these cases are solid
particles (see Fig. 1(d)) or liquid droplets [54]. There are two
main uncertainties in this debate: (1) because of the nanosize
effect, the melting temperatures of nanoparticles are always
lower than those of bulk materials and (2) it is not possible to
measure the real temperature at the catalyst tips. In fact, in some
cases, nanosized metal droplets are in a partially molten state
Fig. 2. (a) Au catalysts prepared by annealing a thin Au film. (b) Au patterns prepared by e-beam lithography. (c) Splitting of the Au particles by annealing.
Fig. 3. (a) An Au catalyst reacts with the substrate after the activation treatment. (b) Si nanowires grow in different directions.
N. Wang et al. / Materials Science and Engineering R 60 (2008) 1–514
[51]. The surface and interface regions are liquid, while the
cores of the droplets are solid.
The VLS mechanism is very successful in generating large
quantities of 1D nanomaterials (single nanowires and hetero-
structured nanowires) with uniform crystalline structures not
only in semiconductors but also in oxide, nitride and other
material systems. However, it seems to be difficult to grow
metal nanowires by the VLS method. The disadvantage of the
VLS method may be the contamination caused by the necessary
use of a metal particle as the catalyst. This may result in the
change in the nanowire’s properties. However, by selecting an
appropriate catalyst, the affection of the contamination for
specific properties of the nanowire can be minimized.
2.2. Laser-assisted growth
Among the various techniques developed to synthesize ultra-
thin nanowires, of particular interest is the laser ablation of
metal-containing solid targets or similar techniques [7–10],by
which bulk-quantity nanowires can be readily obtained directly
from solid source materials. When using metal catalysts, for
example, for the synthesis of Si nanowires, this method is
suggested to rely on the VLS mechanism, whereby the vapor (or
gaseous clusters) generated by laser ablation dissolves in a
molten metal catalyst and then crystallizes to form nanowires.
Ultrasmall nanoparticles of metals or metal silicides in large
quantities are rather easy to obtain from the high temperature
induced by laser ablation. Assisted by laser ablation, these
nanoparticles act as the critical catalyst for the nucleation and
growth of nanowires.
The laser-assisted method has unique advantages over other
growth techniques in synthesizing nanowires containing com-
plex chemical compositions. This is because no matter how many
elements are involved, it is not necessary to prepare the target (or
the source materials) in a crystalline form. A simple mixture of
the elements is good enough as the source material. The source
materials are ablated into a vapor phase, which may have the
same composition as the source materials. The vapor phase can
be easily transferred to the substrate where nanowires nucleate
and grow. A high-energy laser can ablate solid materials in an
ultra short time and vaporize the materials in a non-thermo-
equilibrium process, also called congruent evaporation [55]. This
technique is particularly useful in the synthesis of nanowires with
a high-melting temperature, such as SiC nanowires [56].Itisalso
a very effective method in synthesizing nanowires with multi-
components and doping nanowires during growth. The vaporized
molecules (or clusters) by the high power laser have high kinetic
energy (about 100 eV), and this largely enhances the chemical
reaction, e.g., the reaction with oxygen or other gases, and thus
can largely improve the crystal quality of the nanowires at a low
substrate temperature. This special technique has many practical
uses for the control of the stoichiometries of nanowires. For
example, ZnO nanowires grown by thermal CVD always have
oxygen vacancies and other defects that cause poor optical (non-
band edge emission) and electrical (low conductivity compared
with bulk ZnO crystals) properties. These defects cannot be
easily eliminated even by annealing in oxygen after nanowire
growth. ZnO nanowires synthesized by laser ablation, however,
generally show better optical properties. Another example is that
indium oxide nanowires synthesized by laser ablation have a
significantly high mobility [57].
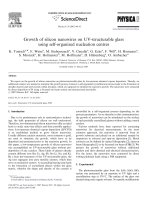
Fig. 4 is a schematic of the experimental setup of the laser-
ablation technique. The laser used in the experiment can be any
high-power pulsed laser, e.g., a Nd:YAG laser [7], an interfered
femto-second laser [58] oran excimer laser [59]. Thesynthesis of
Si nanowires by the experiment reported in Refs. [10,59,60] was
carried out using a high-power KrF excimer pulsed laser
(248 nm, 10 Hz, 400 mJ/pulse) to ablate a target in an evacuated
($500 Torr) quartz tube with Ar (50 sccm) flowing through the
tube. Other inert gases, such as He, H
2
and N
2
, can also be used as
the ambient gases. The use of different ambient gases may
influence the diameters of the nanowires and affects their optical
properties [60]. The temperature around the target materials in
the experiment was about 1200 8C. The target was highly pure Si
powder mixed with Fe, Ni, or Co (about 0.5%). The laser beam
(1 mm  3 mm) was focused on the target surface. Si nanowire
products (sponge-like, dark yellow in color as shown in Fig. 5(a))
formed on the Sisubstrate or the inner wall of the quartz tube near
the water-cooled finger after 1 h of laser ablation. The
temperature of the area around the substrate where the nanowire
grew was approximately 900–1000 8C. The growth rate of the Si
nanowires was about 10–80 mm/h.
By laser ablation, the metal powder is evaporated out of the
target to form clusters. They are in a semi-liquid state and serve
Fig. 4. Experimental setup for the synthesis of Si nanowires by laser ablation (Courtesy of Prof. I. Bello).
N. Wang et al. / Materials Science and Engineering R 60 (2008) 1–51 5
as the energetically favored reaction sites for absorption of the
reactant. They are also the nucleation sites for crystallization of
the source materials when supersaturated (see Fig. 5(b)). Then,
preferential 1D growth occurs in the presence of the reactant. Si
nanowires obtained by ablating a metal-containing (0.5–1%) Si
powder target are extremely long and straight. The typical
diameters of the nanowires are 10–50 nm. There is a metal
catalyst at the tip of each nanowire (Fig. 5(c)). During the laser
ablation, the reaction is not under thermodynamic equilibrium
conditions. Ultrasmall-size metal catalysts and thus very thin Si
nanowires with diameters smaller than 10 nm can be easily
generated by this method. The growth rate of Si nanowires from
laser ablation depends on many factors, such as the power of the
laser beam, the vacuum, the carrier gasses and the temperature.
A rate of 500 mm/h has been observed in Si nanowire growth
assisted by laser ablation, which is much faster than that from
the classical VLS using vapor sources.
Without adding any metal catalysts, however, nanowires of
many other materials have been fabricated by laser ablation.
These materials include metal oxides, some semiconductors
and multi-component materials with rather complex stoichio-
metries. The growth of these nanowires is called self-catalyzed
growth. Though no obvious catalyst is observed with these
nanowires, it is possible that metal elements in the source
materials may act as the catalysts. For example, the laser
ablation of the ZnSe crystal surface may result in Zn clusters
that act as the effective catalysts. Similar self-catalyst VLS
growth has also been observed in the growth of GaN [61] and
ZnO [62] nanowires. Nanowires with multi-components, for
example, the yttrium–barium–copper–oxygen (YBCO) com-
pound, have been synthesized by laser ablation of YBa
2
Cu
3
O
7
(a high T-c superconductor) in an oxygen atmosphere [63]. The
YBCO nanowires were structurally uniform. Their diameters
range from 20 and 90 nm and their lengths are up to several
micrometers. Most of the YBCO nanowires were single crystals
(an orthorhombic lattice) and their axis was along the [0 0 1]
direction. The growth mechanism of the YBCO nanowires is
not known. It might be a self-catalytic growth or the oxide-
assisted growth (without any metal catalysts) as discussed
below in Section 2.3.
2.3. Thermal evaporation
Nanowires and some interesting morphologies of nanos-
tructures such as nanoribbons, nano-tetrapods and comb-like
structures [64,65] can be fabricated by a simple method of
thermal evaporation of solid source materials. The experi-
mental setup is extremely simple as shown in Fig. 6.The
temperature gradient and the vacuum conditions are two critical
parameters for the formation of nanowires by this method.
Typical materials suitable for this fabrication are metal oxides,
e.g., ZnO, SnO
2
,In
2
O
3
, VO, etc. and some semiconductors
[12,66]. The fabrication of these nanowires is simply through
evaporating commercial metal oxide powders at elevated
temperatures under a vacuum or in an inert gas atmosphere with
a negative pressure. Nanowire products form in the low-
temperature regions where materials deposit from the vapor
phase. It is believed that the nanowires are generated directly
from the vapor phase in the absence of a metal catalyst, and this
process is often called vapor–solid (VS) growth. To generate
the vapor phases of the source materials, vacuum conditions are
sometimes needed. This is because some materials may not
sublimate in the normal atmosphere. An effective way to
generate the vapor source materials in a normal atmosphere is
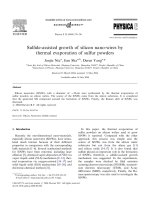
Fig. 5. (a) Si nanowire product. (b) Formation of Si nanowires from liquid clusters. (c) TEM image of Si nanowires catalyzed by metal droplets. The arrow indicates
the metal catalyst on the nanowire tip.
Fig. 6. A simple experimental setup of the thermal evaporation method for synthesizing ZnO nanostructures. The source material is ZnO or a mixture of ZnO and
carbon. Different forms of the ZnO nanostructures, e.g., nanowires and ribbons, grow in different temperature zones.
N. Wang et al. / Materials Science and Engineering R 60 (2008) 1–516
to add additional materials to react with the source materials.
For example, ZnO powder does not sublimate in a normal
atmosphere at 1000 8C. By adding carbon powder to react with
the ZnO source, Zn or Zn-suboxide vapor phases can be easily
generated at 1000 8C. Various forms of ZnO nanostructures
grow in the low-temperature zone. In this case, vacuum
conditions, carrying gases and catalysts are all unnecessary.
The temperature is critical for the formation of different forms
of ZnO nanostructures [67].
The growth mechanisms of many nanowires from thermal
evaporation (without adding metal catalysts) are poorly
understood. There are some special materials containing no
metal elements that can also develop into nanowires from their
oxide decomposition. Wang et al. [11,68,69] reported that SiO
2
largely enhanced Si nanowire growth (Fig. 7(a)). A model
called oxide-assisted growth (OAG) was therefore proposed
with evidence from experiments not only on Si but also on Ge
[70] and III–V [71–73] semiconductor nanowire growth. As
shown in Fig. 7(b), the presence of SiO
2
in the source
significantly increases the yield of Si nanowire product. The Si
nanowire product obtained using a powder source composed of
50% SiO
2
and 50% Si is 30 times larger than the amount
generated by using a metal-containing target [11].
The OAG reaction is special because no metal elements or
catalysts are involved either in the source materials or the
nanowire itself. The starting material is oxide and the
nanowires are in non-oxide form. In OAG using SiO, the
nanowires are pure Si (not Si-oxide), and Si itself does not have
a self-catalyst effect. This means that Si nanowires are formed
by the assistance of Si-oxide. The OAG model has been tested
by a simple experiment [74], which was carried out by simply
sealing highly pure SiO powder or a mixture of Si and SiO
2
(1:1, Si reacts with SiO
2
to form SiO or Si
x
O(x > 1) vapor
phase) in an evacuated (vacuum <10 Torr) quartz tube and then
inserting the tube into a preheated furnace (1250–1300 8C). No
special ambient gas was needed. One end of the tube was left
outside the furnace to generate a temperature gradient between
the source material and the nanowire formation zone. After 20–
30 min of annealing, a high yield of sponge-like Si nanowire
product formed on the cooler parts of the tube where the
temperature was about 800–1000 8C. A similar thermal
evaporation experiment was actually performed in 1950
[55,75]. Two kinds of materials were obtained at the
temperature range of 800–1000 8C, one was a SiO product
and the other one was labeled as ‘‘light brown loose material’’.
The loose materials were characterized by X-ray diffraction and
determined to be Si structures [75]. The ‘‘light brown loose
material’’ can be obtained routinely nowadays by thermal
evaporation as Si nanowires. Unfortunately, the Si nanowires in
the loose materials were not identified at the time of the initial
experiments. The advantages of the OAG technique are (1) the
nanowires are highly pure since no metal catalyst is involved
and (2) doping of nanowires can be easily achieved because the
experimental setup for OAG of Si nanowires is very similar to
that of the laser ablation technique. Doping can be easily
realized with the assistance of laser ablation of solid dopant
materials during nanowire growth. Si nanowires fabricated by
this method showed very uniform diameters (about 20 nm) and
their lengths were over several hundred micrometers.
2.4. Metal-catalyzed molecular-beam epitaxy
Since 2000, MBE and CBE techniques have been employed
to synthesize Si [15], II–VI [14] and III–V [13,16] compound
semiconductor nanowires based on the VLS growth mechan-
ism. MBE and CBE techniques provide an ideal clean growth
environment, and the atomic structures, doping states and
junctions (or heterostructures) can be well controlled.
Combined with the VLS, these techniques are able to produce
high-quality semiconductor nanowires. Different from other
synthesis techniques, MBE works under ultra-high vacuum
conditions. The mean free path of the source molecules under
vacuum conditions of 10
À5
Torr is about 0.2 m. The evaporated
source atoms or molecules from the effusion cells behave like a
beam aiming directly at the substrate (see Fig. 8). The growth,
surface structures and contamination can be monitored in situ
by reflection high-energy electron diffraction, Auger electron
spectroscopy and other surface probing techniques. MBE has
several advantages over other synthesis techniques: (1) the
ultra-high vacuum can reduce contamination/oxidation of
Fig. 7. (a) Si nanowires synthesized by oxide-assisted growth. (b)Yield of Si nanowires vs. the percentage of SiO
2
in the target [11].
N. Wang et al. / Materials Science and Engineering R 60 (2008) 1–51 7
material surfaces; (2) the low growth temperature and the
growth rate prevent inter-diffusion in the nanostructures; (3) in
situ monitoring of growth is possible; (4) since all growth
parameters can be adjusted precisely and separately, the
intrinsic nanowire growth phenomena can be studied indivi-
dually.
For a classical VLS reaction, the metal particles are essential
for the catalytic decomposition of the precursors. For MBE
growth, however, no molecules or precursors need to
decompose. The function of the metal particles is twofold:
(1) absorption of atoms from vapor phases or substrate surfaces.
The driving force is to lower the chemical potentials of the
source atoms and (2) precipitation or crystallization of the
source materials at the particle-substrate interface. The
preparation of the substrate surface is critical for growing
high-quality nanowires. After wet-chemical cleaning, the
substrate has to be deoxidized. Substrate de-oxidation is
essential because the oxide layer on the substrate influences the
nanowire growth direction. A poorly treated substrate results in
random growth directions. The deoxidation temperature
depends on the substrates used. For a GaP(1 1 1) substrate,
for example, annealing at 600 8C is essential. For the growth of
II–VI (e.g., ZnSe and ZnS) nanowires [14], the synthesis is
carried out using compound-source effusion cells at tempera-
tures above 500 8C. According to in situ observations of the
reflection high-energy electron diffraction patterns during the
growth, Au nanoparticles are in a molten state at this
temperature. In practice, Au nanoparticles are not necessarily
molten droplets. In fact, the nanowires can grow at a
temperature below the eutectic point. However, the deposition
of the source atoms on the substrate surface becomes significant
at a low temperature. Then, the surface diffusion becomes an
essential mechanism. Excess adatoms are driven to the low
energy state of the molten metallic particles or the molten
interfaces at these particles.
The growth temperature is a critical factor for the formation
of high-quality ZnSe nanowires. On the one hand, the
deposition of ZnSe on the substrate is restrained when the
substrate temperature is substantially higher than 300 8C.
Therefore, almost no ZnSe deposition occurs on the fresh
surface of the substrate (see Fig. 9(a)). On the other hand, a
certain high temperature is needed in order to activate the Au-
alloy particles on the substrate and to ‘‘catalyze’’ the growth of
the ZnSe nanowires epitaxially on the substrate. Due to the
surface melting effect, it is possible to grow ZnSe nanowires at
a low temperature of about 390 8C. In this case, the deposition
of ZnSe on the substrate surface is significant (Fig. 9(b)), and
the quality of the nanowires is poor compared with the quality
of nanowires grown at a higher temperature. These nanowires
contain high-density defects, e.g., stacking faults and twin-
nings. However, a too-high growth temperature results in
coarsening of the Au catalyst and a low growth rate and, in turn,
leads to non-uniform diameters of the ZnSe nanowires. The
resulting growth rate of the nanowires is mainly determined by
Fig. 8. A typical MBE growth chamber.
Fig. 9. TEM images of the interface structures at the substrate. (a) No deposition of the source materials on the substrate surface under a high growth temperature. (b)
Deposition of the source materials on the substrate surface under a low growth temperature.
N. Wang et al. / Materials Science and Engineering R 60 (2008) 1–518
the ZnSe flux at a fixed temperature. At 530 8C, the growth rate
of ZnSe nanowires is about 0.1 nm/s [14].
CBE is a hybrid form of molecular beam epitaxy. Different
from MBE (using solid sources evaporated at high tempera-
tures), gas sources are used (also called gas source molecular
beam epitaxy). CBE works at an ultrahigh vacuum condition so
that the mean-free paths between molecular collisions become
longer than the source inlet and the substrate. The gaseous
source materials are introduced (the gas transport is collision
free) into the reaction chamber at room temperature in the form
of a beam. From Au-catalyzed CBE, high-quality 1D
heterostructure nanowires (InAs/InP) with diameters of about
40 nm have been fabricated [16]. Very thin InP barrier layers
with thicknesses of 1.5 nm and excellent interface structures
have been demonstrated by this method. The growth direction
and defect density in the nanowires grown by CBE and MBE
are influenced by several factors. Twinning (see Fig. 9(a)) or
stacking faults are the main defects that very often occur in
thicker nanowires and cause a change of the nanowire growth
direction. For ZnSe nanowire growth, the growth temperature
and the ratio of the source elements are the main reasons
causing the defects. The defect density is also dependent on the
growth direction. We have observed that [0 0 1] growth
nanowires contain fewer defects compared with nanowires
grown in other directions, and ultra-thin nanowires (diame-
ter < 10 nm) generally contain few defects. The growth
directions of ultra-thin II–VI compound nanowires are mainly
determined by the diameters or the sizes of the catalysts and the
growth temperature. The size-dependent and temperature-
dependent growth directions and the interface structures of II–
VI nanowires are discussed in Section 4.1 based on the
estimation of the surface and interface energies of the nanowire
nuclei.
2.5. Solution methods
The major advantages of the solution-based technique (in
aqueous or non-hydrolytic media) for synthesizing nanomater-
ials are high yield, low cost and easy fabrication. The solution-
based technique has been demonstrated as a promising
alternative approach for mass production of metal, semicon-
ductor and oxide nanomaterials with excellent controls of the
shape and composition with high reproducibility. In particular,
this technique is able to assemble nanocrystals with other
functional materials to form hybrid nanostructures with multiple
functions with great potential for applications in nanoelectronic
and biological systems. The nanocrystals synthesized in aqueous
media may often suffer from poor crystallinity, but those
synthesized under nonhydrolytic conditions at a high tempera-
ture, in general, show much better crystal quality [76,77]. For the
formation of nanowires from solution, several routes have been
developed, such as metal-catalyzed solution-liquid-solid (SLS)
growth from metal seeds [78–88], self-assembly attachment
growth [89–94], and anisotropic growth of crystals by
thermodynamic or kinetic control.
Many nanowires grown from solution methods largely rely
on ‘‘structural directors’’, including (1) ‘‘soft templates,’’ such
as surfactants and organic dopants and (2) ‘‘hard templates,’’
such as anodized alumina membranes [95–103] containing
nanosized channels, track-etched polymer porous membranes,
and some special crystals containing nanochannels. Through
DC or AC electrochemical deposition, various materials can be
introduced into the nanochannels of the hard template [100–
103]. In some cases, vapor molecules may selectively diffuse
into the channels because of special chemical properties of the
nanochannel walls [103]. Without the assistance of structural
directors, anisotropic growth of crystals induced by different
surface energies can lead to the formation of elongated
nanocrystals. However, the differences in the surface energies
of most materials are not large enough to cause highly
anisotropic growth of long nanowires. By adding surfactants to
the reaction solution, some surfaces of nanocrystals can be
modulated, i.e., the surfactant molecules selectively adsorb and
bind onto certain surfaces of the nanocrystals and thus reduce
the growth of these surfaces. This selective capping effect
induces the nanocrystal elongation along a specific direction to
form nanowires. The selective capping mechanism has been
evidenced recently in many nanomaterials such as metal
nanowires [104–109], metal oxide nanowires [110–115] and
semiconductor nanowires [116,117]. Though structural direc-
tors are often used for the synthesis of nanowires, the actual
growth process is poorly known. As a matter of fact, in many
cases, the structural directors may not exist or the materials are
self-constitutive templates. The formation mechanism of
nanowires in solution is complicated and the selection and
function of the structural directors require further and
systematic investigation.
3. Growth mechanisms of nanowires
3.1. Metal-catalyzed growth
The most significant work on the mechanism of the
unidirectional growth of semiconductor whiskers grown by
VLS was published by Wagner and Ellis in 1965 [118]. The
unidirectional growth of Si whiskers can be simply interpreted
based on the difference of the sticking coefficients of the
impinging vapor source atoms on the liquid (the catalytic
droplet) and on solid surfaces. In principle, an ideal liquid
surface captures all impinging Si source atoms, while a solid
surface of Si rejects almost all Si source atoms if the
temperature is sufficiently high. This classical VLS mechanism
is still applicable to the growth of many nanoscale wires
produced today. As schematically shown in Fig. 10(a), Au
particles deposited on the surface of an Si substrate initially
react with Si to form active Au–Si alloy droplets. The melting
temperature of a Si–Au alloy particle is significantly decreased
once its size is in the nanometer range [119]. During the initial
reaction of the catalyst on a flat surface (see also Fig. 10(b)), the
shape or the contact angle (b
o
) of the droplet is determined by
the balanced forces of the surface tension and the liquid–solid
(LS) interface tension. The droplet has a radius, R, which can be
described by R=r
0
/sin(b
0
)(r
0
is the radius of the contact area)
[120,121]. The contact angle is related to the surface tension
N. Wang et al. / Materials Science and Engineering R 60 (2008) 1–51 9
and the line tension, t, by a modified (a line tension is added)
Young’s equation [122]:
s
1
cosðb
0
Þ¼s
s
À s
ls
À
t
r
0
: (3.1.1)
For a droplet of macroscopic size, the effect of the line tension
can be ignored. For a nanosized droplet, the line tension should
be considered. At the initial growth, when the nanowire’s
length, dh, increases, the radius of the contact area, dr,
decreases. The inclination angle, a, of the nanowire flanks will
increase (a = 0 before growth). The inclination angle can be
expressed as
s
1
cosðbÞ¼s
s
cosðaÞÀs
ls
À
t
r
0
: (3.1.2)
An increase in a is accompanied by an increase in b. The
droplet will approach a spherical section. Since the contact area
decreases with an increase in the nanowire length, the final
radius of the nanowire should be smaller than the initial radius,
r
0
(see Fig. 10(c)). The line tension (difficult to determine
experimentally) strongly influences the catalyst contact area. A
large line tension can result in hillock growth and thus stop the
growth [120].Using the minimization method of the system’s
Gibbs free energy, Li et al. obtained [120,121]:
s
VL
cos b
0
¼ s
VS
À s
LS
À s
c
LS
À
t
c
r
o
; (3.1.3)
s
c
LS
¼Àl
o
k
B
T
V
ln h; t
c
¼ l
o
s
VS
; (3.1.4)
where s
c
LS
is the effective surface tension, t
c
the effective
chemical tension, l
o
the elementary thickness and h is the vapor
source of the actual-to-equilibrium-pressure ratio. The chemi-
cal tensional is defined as: s
c
¼ s
c
LS
þðt
c
=r
o
Þ. Then, the
general equation for a wire already grown to some length is
s
VL
cos b
0
= s
VS
À s
LS
À s
c
. The equilibrium condition of the
VLS reaction is the balance among the various static factors in
the system, the surface energies, the dynamic factors due to the
growth of a crystal layer, and the chemical tension. The shape of
an initially grown Si nanowire (due to the line-tension) is shown
in the TEM image in Fig. 11(a). Based on the chemical-tension
model, Li et al. predicted that different line-tension values can
result in nanowire or nanohillock growth as shown in Fig. 11(b).
For Si whisker growth, a typical kinetic experimental result
is the growth rate dependence on the whisker diameter. The
larger the whisker diameter, the faster is its growth rate.
This growth phenomenon is attributed to the well-known
Fig. 11. (a) The shape of the initial growth of Si nanowires due to the line-tension. (b) Prediction of Si nanowire and nanohillock growth by the chemical-tension
model for various line-tension values (from Ref. [120]; reproduced with permission from Springer Science).
Fig. 10. Schematic of Au–Si droplets (a) formed on the substrate. (b) Initial growth of the nanowire. (c) The hillock shape of the nanowire root (from Ref. [121];
courtesy of Prof. T.Y. Tan).
N. Wang et al. / Materials Science and Engineering R 60 (2008) 1–5110
Gibbs–Thomson effect, i.e., the decrease of supersaturation as a
function of the whisker diameter [6]:
Dm
kT
¼
Dm
0
kT
À
4aV
kT
1
d
; (3.1.5)
or
Dm ¼ Dm
0
À
4aV
d
; (3.1.6)
where Dm (also the driving force for whisker growth) is the
effective difference between the chemical potentials of Si in the
vapor phase and in the whisker. Dm
0
is the chemical potential
difference for the plane boundary case, i.e., the whisker dia-
meter d !1. V is the atomic volume of Si; a the specific free
energy of the whisker surface. Due to the change of the driving
force (the chemical potential difference), Si whiskers with
small diameters (<0.1 mm) grow very slowly. Obviously, there
is a critical diameter at which Dm = 0 and the whisker growth
stops completely. Those whiskers with diameters smaller than
the critical diameter will stop growing. Thick whiskers grow
faster than narrow ones [6]. At the thermodynamic equilibrium
state, the stability of a liquid droplet depends on the degree of
supersaturation. For a liquid droplet in its own vapor, the
stability can be described by d
min
=(4aV)/(kT ln S). Here, S
is the degree of supersaturation (the chemical potential
Dm = kT ln S).
Although Eq. (3.1.5) can well predict the VLS growth for
most whiskers, however, it is not sufficient to describe the VLS
reaction because (1) the droplet size may not be the same to that
of the whisker and (2) the binary alloy nature (Metal–Si) of the
droplet should be considered [123]. For the VLS reaction
(Fig. 10(a)), four phases of materials are involved. They are Si
and metal (M) vapor phases, the M–Si liquid droplet and the Si
crystal. Because of the binary nature of the metal droplet, two
minimum diameters are defined on the basis of thermody-
namics by Tan et al. [123]: the minimum droplet diameter d
l
min
(equal to the critical diameter of the Si–M liquid droplet
nucleated by the two vapor phases Si and M) and minimum wire
diameter d
s
min
:
d
l
min
¼
4a
LV
V
L
KT lnðP
Si
=
¯
P
Si
Þ
¼
4a
LV
V
L
KT lnðP
M
=
¯
P
M
Þ
(3.1.7)
Here P
Si
and P
M
are partial pressures of Si and M.
¯
P
Si
and
¯
P
M
are unique values of the Si and M vapor phase pressures
respectively allowing the two phases and the liquid phase with
a flat surface to coexist under thermal equilibrium condition.
The minimum Si wire diameter d
s
min
has a similar form which is
equal to the critical diameter of a cylindrical Si crystal grown
from the liquid Si–M droplet of diameter d
l
min
:
d
S
min
¼
2a
SV
V
S
KT lnðP
Si
=
¯
P
eq
Si
Þ
(3.1.8)
¯
P
eq
Si
is the Si vapor phase pressure in the thermal equilibrium
state. According to Eqs. (3.1.7) and (3.1.8), thermodynamically
there is no absolute limit on the diameters of the Si–M droplet
and Si wire. The diameters of Si wires can reach smaller sizes if
there is no limit from the kinetic process in the VLS. Tan et al.
[123] have calculated the minimum radii of Si wires formed
from Si–M systems based on appropriate phase diagrams and
the interface energy a
SV
. Smaller radii can be reached at lower
growth temperatures. As illustrated in Fig. 12, the radii of some
small Si nanowires have approached some effective limit set by
the liquid composition.
Though the classical VLS reaction can still be extrapolated
to explain the growth of most nanowires, ultra-thin nanowires
(diameter < 10 nm) of different materials show distinct growth
behaviors. In the classical VLS reaction, it is believed that the
catalyst is in molten state which absorbs the source materials to
form a supersaturated liquid droplet (Fig. 13(a)). The LS
interface structure is very critical to nanowire growth. At the LS
interface, there is a region consisting of several layers of atoms
in which atoms are in semi-molten state, i.e., atoms can move
easily between the crystal lattice sites [124]. Atom precipitation
occurs at the LS interface. The growth rate of the nanowires is
determined by the supersaturation in the catalyst droplet (Dm/
kT). Givargizov et al. [6,125] determined the whisker growth
rate as a function of the driving force (supersaturation Dm/kT)
and first empirically described their results by the relationship:
V ¼
dL
dt
¼ b
Dm
o
k
B
T
À
4Vs
dk
B
T
n
; (3.1.9)
where b and n ($2) are empirical fitting parameters. This
relationship was later justified (numerically) by Givargizov
using a 2D island nucleation-growth model [6]:
V ¼ V
o
exp
À
pVh
2
3k Th Dm
; (3.1.10)
where h is the island edge energy density and h is the layer
thickness. Again, these results indicated that in the VLS
deposition, thick whiskers grow faster than narrow ones. But
if the nanowire is thick enough, the growth rate will tend to be a
constant.
Fig. 12. Calculated curve using Eq. (3.1.8) for the Si–M systems. The surface
energy used for the calculation is a
SV
= 1610 erg/cm
2
. Some available smallest
radii of Si nanowires have approached the effective limits (from Ref. [123];
reproduced with permission from American Institute of Physics).
N. Wang et al. / Materials Science and Engineering R 60 (2008) 1–51 11
Wang et al. [52] have shown that in some cases the nanowire
growth may be controlled by surface diffusion. In their
diffusion-induced VLS model, molecules in the vapor phase are
considered to first fall on the liquid surface and then diffuse
along the surface to the LS interface and finally incorporate into
the solid wire (see Fig. 13(b)). Then, the nanowire growth rate
mainly depends on the surface concentration gradient 5
s
and
the surface diffusion coefficient A
s
. The relative growth rate V
0
s
is proportional to the inverse of the nanowire diameter, V
0
s
¼
ðDL
0
s
=DtÞ¼ð4A
0
s
r
0
s
=dÞ [52,126,127]. The surface diffusion
model becomes important for the growth at a low temperature.
In addition to the direct impinging atoms, the source atoms may
also arrive at the droplet by diffusion along the substrate surface
and wire side surfaces (Fig. 13(c)). Nanowires formed by this
model usually show tapering shape at their roots. At a relatively
high growth temperature, however, this growth model should be
inhibited because no adatom can stay at solid surfaces.
The measured growth rates V [6] of the VLS grown Si
whiskers as a function of their diameters d is shown in
Fig. 14(a). According to Eq. (3.1.9), V
1/n
and 1/d should be
linear dependence, and this dependence matches the experi-
mental results fairly well. The data can fit to straight lines for
n = 2. The classical VLS model can predict the growth
behaviors of whiskers well. However, the growth behaviors of
ultra-thin nanowires may be totally different from that of
whiskers. As an example, Fig. 14(b) illustrates the growth rates
for thin ZnSe nanowires (diameters <100 nm) grown by Au-
catalyzed MBE. It is very obvious that smaller nanowires have a
higher growth rate compared to thicker ones [127,128].The
relationship between the growth rates and the diameters can be
described by V = C/d (C is a constant). This relation agrees with
the growth model controlled by surface diffusion [126].
Different theories have been developed to explain the
deviation of the growth behavior of ultra-thin nanowires from
the classical VLS [129,130]. The main reason for the deviation
of the growth rates is attributed to the change of the
incorporation process and the diffusion paths of source atoms.
For a thick nanowire, the surface diffusion contributes
insignificantly to the growth rate because the ratio of cross-
section area to the circumference is large. For an ultra-thin
nanowire, however, the surface diffusion becomes significant.
Especially when the growth temperature is low and the metal
catalyst becomes solid (or partially solid), the interface between
the catalyst and nanowire may still be in semi-melting state.
This is similar to the case of a grain boundary whose melting
temperature is always lower than that of its bulk crystals. It is
known that grain boundaries are fast channels for atomic
diffusion. At a certain temperature the atoms at the interface
between Si and metal may be in partially molten state [51].
Therefore, at a low growth temperature, a solid metal catalyst
can also lead to growth of ultra-thin nanowires through surface
diffusion since the interface is still active, while in this case, the
growth of a thick nanowire (a large solid catalyst) through
interface diffusion should be difficult. The growth rates of ultra-
thin nanowires controlled by surface diffusion are proportional
to the inverse of the diameters. Recently, Kodambaka et al. [54]
have demonstrated by in situ TEM observation that solid
catalysts can lead to Ge nanowire growth.
At the same growth condition, the melting temperatures of
metal catalysts are size-dependent. On the one hand, small
catalysts have lower melting temperatures due to the nanosize
effect. On the other hand, due to the Gibbs–Thomson effect,
decreasing the diameter of the catalyst droplet results in a lower
solubility of the source atoms and thus shifts the melting
temperature of the catalyst (see also the phase diagram in
Fig. 1(b)). Therefore, when the growth temperature falls below
Fig. 13. Different diffusion models for the source atoms to incorporate into the
growth front of the nanowire. (a) The classical VLS. (b) The metal droplet is in
partially molten state. Its surface and interface are liquid, while the core of the
droplet is solid. (c) The metal catalyst is solid, but the interface is liquid.
Fig. 14. The growth rates of (a) VLS Si whiskers (from Ref. [6]; reproduced with permission from Elsevier Science) and (b) VLS ZnSe nanowires plotted as a
function of diameters.
N. Wang et al. / Materials Science and Engineering R 60 (2008) 1–5112
the eutectic point, the metal catalysts at the tips of nanowires
with relatively small diameters became solid first, while those
catalysts with relatively large diameters remained in the liquid
state. This interesting phenomenon has been observed by in situ
TEM [54].
For Si or Ge nanowire growth, Au catalysts are liquid or solid
solution. For compound semiconductors, such as GaAs, the
structure and chemical composition of Au catalysts are
complicated. Fig. 15(a) and (d) shows the Au particles formed
on a GaAs (1 1 1) surface after annealing at 530 8C. Fig. 15(a) is
an enlarged image showing the typical hexagonal shape of an Au
catalyst in which 2D moire
´
patterns are clearly visible. The
selected-area electron diffraction (SAED) pattern (Fig. 15(b))
taken from this particle illustrates clearly strong diffractions of
GaAs (along the [111] zone axis) surrounded by satellite spots
which come from the double diffraction effect that occurs when
the particle and the substrate have a certain orientation
relationship. The structure of the catalysts has been identified
to be AuGa
2
(face center cubic (FCC), space group Fm3m, lattice
parameter a = 0.6073 nm) by electron diffraction and TEM
image simulation [131]. The moire
´
fringes are due to the overlap
between GaAs substrate and AuGa
2
particles. The AuGa
2
catalysts are single crystalline if their sizes are small. Two grains
often form (marked by I and II in Fig. 15(a)) in a large catalyst.
According to the SAED patterns in Fig. 15(b) (along the [1 1 1]
zone axis) and (c) (along the ½11
¯
2 zone axis), only one AuGa
2
grain epitaxially forms on the substrate with orientation relations
of ½100
GaAs
==½100
AuGa
2
and ½010
GaAs
==½010
AuGa
2
.
For Au–GaAs system, the catalysts reacted with the
substrate during annealing and formed sharp interfaces between
the catalyst and GaAs substrate. Fig. 15(e) is the cross-sectional
view of an individual AuGa
2
catalyst. The orientation relations
between AuGa
2
grain II and the substrate agree well with the
SAED results. The chemical composition of the catalysts was
characterized using electron energy-loss spectroscopy and X-
ray energy dispersive spectroscopy, and the results indicated
that the catalysts consisted of Au and Ga, but no As was
detected in the catalysts. The interface of the catalyst at the
substrate (about 7.4% of mismatch) was (1 1 1) at which
interfacial dislocations occurred. It was interesting to note that
only AuGa
2
binary alloy formed by annealing, and arsenic did
not participate in the nanowire growth. The reaction of the
catalysts can be described as
2GaAsðsolidÞþAuðsolidÞ!AuGa
2
ðsolidÞþ2AsðgasÞ
(3.1.11)
In this reaction, arsenic is extracted from the substrate
during the formation of AuGa
2
alloy. Then, arsenic may diffuse
out of the catalyst surface and evaporate [192,193]. For large
catalysts, the Ga rich form (AuGa
2
) of the Au–Ga alloy remains
at the tips of ZnSe nanowires (see Fig. 15(f)). However, the
solubility of Ga in an ultra small catalyst is largely reduced, and
only Au solid solution (in FCC structure of Au) is formed
(Fig. 15(g)). The change of Ga solubility in the catalyst is due to
the well-known Gibbs–Thomson effect. Due to the change of
the solubility, the melting point of the catalyst shifted according
to Au–Ga phase diagram.
On the surfaces of ZnSe, a similar reaction occurred when
Au catalysts reacted with ZnSe to form Zn–Au alloy droplets
and Se evaporated (see Fig. 16(a)). According to the Zn–Au
phase diagram, a Au rich Au–Zn alloy should form. As
observed by TEM, the catalysts were single crystalline FCC
structures, same to that of Au. The interaction between Au
nanoparticles and ZnSe or ZnS buffer layer (grown on
GaAs(1 0 0) substrate) displayed interesting features. Thermal
annealing always induced the movement of the droplets along a
certain pair of h110i direction (see the inset in Fig. 16(b)) and
formed parallel trenches on their path [128]. Fig. 16(b) shows
the SEM image of the trenches on a ZnSe substrate surface
caused by the sliding of Au-catalysts. Separate atomic force
microscopy (AFM) imaging done on this sample revealed that
the nanotrenches are quite uniform in width and depth with
typical width of $20 nm and depth of a few nanometers.
Similar thermal annealing resulted six symmetric h110i
oriented nanotrenches on the sample grown on a GaAs(1 1 1)B
substrate. These results together indicated that some specific
h110i directions ware the preferred orientation of the
nanotrenches.
The formation of these nanotrenches is believed to be due to
the special interaction between Au particles and the substrate.
Fig. 15. (a) Plan-view TEM image of Au catalysts formed on GaAs substrate surface by the annealing treatment. (b) and (c) SAED patterns taken along the [1 1 1] and
½11
¯
2 zone axes of the catalyst, respectively. (d) Morphology of Au catalyst. (e) Cross-sectional HRTEM image (along the [1 1 0] direction) of the catalyst formed on
the substrate. (f) AuGa
2
phase in a large catalyst. (g) Au–Ga solid solution in a small catalyst in FCC structure.
N. Wang et al. / Materials Science and Engineering R 60 (2008) 1–51 13
By annealing at a high temperature, Au droplets first react with
the ZnSe thin film to form AuZn
x
(with x less than 14%) alloy
droplets while the other by-products are vaporized. In this
reaction, the resulting AuZn
x
alloy droplets fall into the ZnSe
buffer by a fraction of their size until the composition of the
alloy is saturated. Further annealing will lead to migration of
the alloy droplets along a most preferred direction accompany-
ing the decomposition of ZnSe along the path. The observed
specific [1 1 0] direction of the trenches can be explained by the
fact that the bonding between {1 1 0} planes are the weakest for
most of the zinc blende structures. During the migration, the
AuZn
x
alloy droplets will act as a catalyst for decomposing the
ZnSe along the path. Both Zn and Se decomposed from this
reaction most likely are vaporized, so nanotrenches are
developed along the path. The perfect alignment of these
nanotrenches make them potentially useful as a common
template for fabricating 1D structures of other materials.
3.2. Vapor–solid growth
Without the aid of metal catalysts, the vapor–solid (VS)
growth has been mainly used to synthesize metal oxide and
some semiconductor nanomaterials. It is often called self-
catalytic growth since the nanostructures grow directly from
vapor phases. Plausible growth mechanisms such as the
anisotropic growth, defect-induced growth (e.g., through a
screw dislocation), and self-catalytic growth have been
suggested based on electron microscopy studies, According
to the classical theories of crystal growth from liquid or vapor
phases, the growth fronts play a crucial role for the deposition
of atoms. There are two kinds of microscopic surfaces: (1)
rough surfaces on which atoms of about several layers are not
well arranged. Deposition of atoms is relatively easy compared
to a flat surface and crystal growth can continue if enough
source atoms are continuously provided; (2) atomically flat
surfaces on which atoms are well arranged. Atoms from the
source have a weak bonding with flat surfaces and can easily
return to the liquid/vapor phase. Atoms deposition occurs only
on the atomic steps.
There are three ways to generate atomic steps on a flat
surface: (1) nucleation of new two-dimensional islands which is
difficult because the nucleation barrier is high, and there is
almost no super-cooling. The islands will be exhausted
eventually (see Fig. 17(a)); (2) screw dislocations which
generate atomic steps to help atoms to deposit continuously
(Fig. 17(b)); and (3) twining structures which contain ditches at
the cross of two grain surfaces. Atoms deposit at the ditches
resulting in atomic steps along twining surfaces. The resulting
growth can be continuous along the direction of the twining
plane (Fig. 17(c)). Followings are important factors for the
nanocrystal growth in the VS process.
3.2.1. Internal anisotropic surfaces
Because of anisotropic properties of different surfaces in a
crystal, such as the preferential reactivity and binding of gas
reactants on specific surfaces and all crystals tend to minimize
their total surface energy, rod- or wire-like shapes are
frequently resulted. However, the degree of the anisotropic
properties of crystals is not significant large, highly anisotropic
growth (i.e., the length-to-diameter ratio >100) of nanocrystals
at or near the thermal equilibrium state is not expected.
3.2.2. Crystal defects
Screw dislocations (the well known Burton–Cabrera–Frank
theory) are known to significantly enhance the crystal growth of
metals and some molecular materials [132]. This classical
mechanism is based on the fact that the growth of a crystal
proceeds by adding atoms at the kink sites of a surface step.
Kink sites always exist on the steps even at the thermal
equilibrium state. Due to the advance of the kink along the
surface by the addition of atoms, the crystal grows
perpendicularly to the surface. In thermal equilibrium state,
a perfect crystal should eventually contain no surface steps.
Then, the growth of a perfect crystal depends on the nucleation
of surface steps. For the growth of a real crystal, however, the
growth rate is much faster than that predicted for a perfect
crystal because real crystals contain defects, e.g., dislocations
and twins. A dislocation cannot terminate inside a perfect
Fig. 16. (a) Au–Zn nanocatalyst formed on ZnSe substrate. (b) Sliding of the catalysts by annealing results in trenches along the [1 1 0] direction n the substrate
surface.
N. Wang et al. / Materials Science and Engineering R 60 (2008) 1–5114
crystal. They can terminate on a defect inside the crystal or on a
surface. If a dislocation ends on a surface and its Burgers vector
has a component normal to the surface (the screw component),
a step forms starting from the emerging point of the dislocation.
Leading by the dislocation, steps can winds into a spiral, and the
growth of the crystal is largely enhanced without the need of
nucleation for fresh surface steps. There are many reasons for
the formation of a dislocation in a crystal. For Si nanowires,
oxygen atoms may cause the nucleation of a dislocation [133].
It has been frequently observed that screw dislocations are
associated with growth of crystal in the dendrite or whisker
geometries. In ultra-thin nanowires, so far no screw dislocations
have been evidenced. However, in thick wires, for example
ZnO nanowires (diameters > 200 nm), unidirectional growth
induced by dislocations in VS growth mode has been observed
(Fig. 17(f)). The spiral feature at each whisker tip is obviously
due to the steps generated by a screw dislocation. In thin ZnO
nanowires grown by the VS growth, however, no screw
dislocations existing at the core of the nanowires have been
found.
3.2.3. Self-catalytic growth
Self-catalytic growth has been proposed based on the fact
that metal vapor, for example Zn, can be extracted from ZnO
vapor phase by heating ZnO powder in vacuum. When ZnO is
sealed in an evacuated quartz tube (10
À1
to 10
3
) and heated at a
temperature above 1100 8C, ZnO may decompose into Zn and
oxygen as described in Eq. (3.2.1) [62]. Zn droplets are easily
observed on the inner walls of the tube where the temperature is
about 500–600 8C. Under a normal atmosphere condition,
however, no obvious decomposition of ZnO is observed, and
thus no nanowires can be generated by heating ZnO power at a
high temperature.
2ZnO ! 2Zn þ O
2
(3.2.1)
Another way to generate Zn or Zn oxide vapor phases is to add
carbon powders into ZnO solid source, mass production of ZnO
nanowires and nanoribbons can easily realized in the tempera-
ture range of 500–800 8C. In this case, Zn or Zn suboxide play a
crucial role for the nucleation of ZnO nanostructures [67]. This
is because that at a high temperature condition (T > 1100 8C),
carbon reduced ZnO into Zn or Zn suboxides by the following
reactions:
2ZnO þ C ! Zn þ CO
2
; (3.2.2)
ZnO þ CO ! Zn þ CO
2
; (3.2.3)
ZnO þð1 À xÞCO ! ZnO
x
þð1 À xÞCO
2
; (3.2.4)
The carbon powder might directly react with ZnO (for the
case of the sealed quartz tube) or first react with oxygen to form
CO (for the case of the open-end quartz tube). Zn and Zn
suboxides have low melting temperatures (approximately
419 8C for both Zn and ZnO
x
, where x < 1) compared to that
of ZnO (1975 8C) and should be in vapor phases at 1100 8C. At
the low temperature site, Zn vapor generated by reactions
(3.2.2) and (3.2.3) will condense on the inner wall of the quartz
tube forming liquid droplets, which are ideal catalysts for ZnO
nanowire growth through the VLS mechanism. Carrying gases
are not necessary for the formation of ZnO nanostructures.
Temperature is the critical experimental parameter for the
Fig. 17. (a) Nanorods formed due to anisotropic growth of ZnO crystals. (b) Unidirectional growth of ZnO single crystals due to screw dislocation. (c) Growth
induced by twining. (d) Self-catalytic growth of ZnO nanowires by Zn droplets. (e) ZnO crystals contain no catalysts and defects). (f) ZnO whiskers growth due to
dislocations. (g) ZnO bi-crystal growth due to twining. (h) Zn or Zn-rich phase observed on the tips of ZnO nanowires (image (h) from Ref. [62]; reproduced with
permission from American Physical Society).
N. Wang et al. / Materials Science and Engineering R 60 (2008) 1–51 15
formation of different morphologies of ZnO nanostructures
[67].
With the presence of carbon, during the reaction in an open-
end quartz tube (open one end of the tube to air), Zn vapor or
droplets can be partially oxidized forming suboxides, which
generally have low melting temperatures. The formation of the
suboxides is because the amount of oxygen contributing to the
reaction in the open-end quartz tube is limited. This condition is
reasonable since Zn droplets co-exist with ZnO nanowire
products in the early stage of the nanowire formation. Either Zn
droplets or vaporized Zn suboxide droplets could be the nuclei
for ZnO nanowires. Similar to the oxide-assisted growth
mechanism (to be discussed in the next section), Zn suboxides
are more reactive than ZnO and may largely enhance the
deposition of Zn oxides at the tips of ZnO nanowires during
growth. Due to further oxidation of Zn or Zn suboxides, the
concentration of oxygen in the droplets/tips increases, and thus
ZnO deposits on the interface between the droplets and
substrate, resulting in the growth ZnO nanowires. Zn and Zn-
rich phases have been observed by HRTEM on the ZnO
nanowire tips grown by the VS growth (Fig. 17(h)) [62].
Moreover, Zn–ZnO core–shell nanobelts and tubes were also
observed [134]. Though the self-catalytic growth mechanisms
of the VS growth are complicated and unclear, many metal
oxide nanowires and interesting morphologies of nanostruc-
tures have been produced by this method [135,136].
3.3. Oxide-assisted growth
3.3.1. Kinetics and reactivity of silicon oxide in nucleation
and growth
Compared to the VLS mechanism, the nucleation and
growth of Si nanowires from the oxide-assisted mechanism
appears to be novel. The oxide-assisted nanowire growth is
described by reactions (3.3.1), (3.3.2) and (3.3.3). The vapor
phase of SiO and Si
x
O(x > 1) generated by the thermal effect
(thermal evaporation or laser ablation) is the key factor:
SiðsolidÞþSiO
2
ðsolidÞÀ!
high temperature
2SiOðgasÞ (3.3.1)
2SiOðgasÞÀ!
low temperature
SiðsolidÞþSiO
2
ðsolidÞ (3.3.2)
Si
x
OðgasÞÀ!
low temperature
Si
xÀ1
ðsolidÞþSiOðsolidÞðx > 1Þ
(3.3.3)
Silicon oxide clusters generated and present in the gas phase in
Si nanowire synthesis play an important role in the nucleation
and growth. Small silicon oxide clusters Si
n
O
m
(n, m = 1–8)
studied both experimentally and theoretically [137–
139,262,270,271,274] revealed that silicon monoxide-like clus-
ters adopt planar and buckled-ring configurations, while oxy-
gen-rich clusters are rhombuses arranged in a chain with
adjacent ones perpendicular to each other. Si suboxide clusters
are highly reactive to bond with other clusters and prefer to
form Si–Si bonds [141]. By analysis of the highest occupied
molecular orbitals (HOMOs) and the lowest unoccupied mole-
cular orbitals (LUMOs) of silicon oxide clusters, the reactivity
for them to form the Si–Si, Si–O, and O–O bonds were revealed
according to the well-known frontier orbital theory [142].The
HOMO–LUMO gap for (SiO)
n
clusters are 2.0–4.5 eV, much
lower than those for (SiO)
2
species, indicating higher chemical
reactivity of (SiO)
n
clusters. The HOMO mainly localizes on
the Si atoms at the cluster surface, making these regions the
reactive. As the O ratio is less than about 0.62, the reactivity to
form a Si–Si bond of two silicon oxide clusters is remarkably
larger than to form a Si–O or O–O bond [141], as shown in
Fig. 18. The combination of these clusters might occur easily
through the Si–Si bonding.
The richer the Si atoms in the cluster, the higher will be the
chance for them to form a Si–Si bond. However, the cohesion
energy per atom of the silicon-rich clusters is much higher,
indicating a smaller chance of their presence in the gas phase.
The optimum ratio of Si atom to O atom in the silicon suboxide
clusters to achieve the highest yield and formation of Si
nanowire should be close to 1, as also observed experimentally
(about 49 at.% of O) [40]. Our recent experiment using silicon
monoxide has given the largest yield of Si nanowires. It is
worthwhile noting that there are also experimental reports on
the formation of the crystalline phase of Si nanoclusters from
the deposition of silicon-rich oxide [140,143].
The nucleation of Si nanocrystals could be expected to take
place via the combination of small Si suboxide clusters. The
formation of Si core begins at n = 3 is shown in Fig. 19 [144].
As shown in the figure, (1) a Si core (represented by the open
circles containing stars surrounded by a silicon oxide sheath is
involved; (2) the Si–Si bonds prefer to form in the center rather
than at the cluster surface so as to reduce the strain caused; (3)
most of the Si atoms in the Si core have three or four
coordinates with Si–Si–Si bond angles close to 1098 (the value
found in silicon crystal), which is quite different from that of
pure Si clusters of the same size [145]; (4) with increasing
cluster size, the size of the Si core increases and the fraction of
Fig. 18. The inverse of the energy difference DE = LUMO (electron acceptor)–
HOMO (electron donor) and thus the reactivity (proportional to the inverse of
the energy difference) for the formation of a Si–Si bond, a Si–O bond, or an O–
O bond between two silicon oxide clusters as a function of the Si:O ratio [141].
N. Wang et al. / Materials Science and Engineering R 60 (2008) 1–5116
Si atoms with three and four coordinates increases correspond-
ingly, making the cluster more stable; and (5) starting at n =18
all of the Si atoms in Si cores are four-coordinated, indicating
the formation of sp
3
Si cores similar to the configuration in the
Si crystal. Fig. 20 depicts the binding energies of (SiO)
n
clusters
containing Si cores as a function of n, together with those
containing buckled structures. It is clear that: (1) the
configurations containing Si cores become energetically more
favorable than the buckled structures for n = 5 and larger and
(2) the cluster becomes increasingly more stable with
increasing Si core size. As the two structures from n =5 to
n =8inFig. 20 are close in energy, we further estimate their
relative population at 900 8C (the growth temperature of Si
nanowires [146]) by assuming the process is at equilibrium and
described by the Boltzmann factor exp(ÀE/kT), where k is the
Boltzmann’s constant, E the energy difference, and T is the
temperature in Kelvin. The results shown in the inset in Fig. 20
confirm that the structures containing Si cores still play the
major role at such a high temperature starting at a size as small
as n = 8. The formation of sp
3
Si core inside the silicon oxide
clusters contributes to the nucleation of the Si nanocrystals.
Because of their high chemical reactivity, a combination of
these clusters may easily take place, forming clusters with a
large sp
3
Si core via subsequent reconstruction and O migration
from the center to the surface of the clusters. The crystalline Si
cores thus formed can act as nuclei and precursors for
subsequent growth of Si nanostructures.
Fig. 21 shows three different isomers of the (SiO)
21
cluster
with an O atom locating in different sites from the center to the
surface of the cluster. The most stable configuration is the one
with O located on its surface, and the total binding energy is
211.74 eV. However, the binding energy decreases as the O
atom moves from the surface into the cluster. The O atom could
migrate from the center of the silicon monoxide cluster to its
surface via bond switching. For the (SiO)
5
cluster, the estimated
migration barrier is about 1.79 eV. The high strain involved in
the large (SiO)
n
cluster may cause the migration of O atom from
the inside to the surface, leading to the formation of a Si core.
The nuclei containing a Si core would grow larger with the
assistance of O diffusion from the core to the surface layer
during deposition.
In an experiment using SiO powder or a mixture of Si and
SiO
2
powder as the source, the evaporated (SiO)
n
clusters
deposited on a substrate would be anchored due to their high
reactivity at Si sites. The deposited clusters would act as the
nuclei to absorb (SiO)
n
clusters from the vapor because of their
Fig. 19. The most favorable structures of silicon monoxide clusters (SiO)
n
for
n = 3–21 [144].
Fig. 20. Binding energy (eV/atom) of (SiO)
n
clusters vs. n. The up triangles are
(SiO)
n
with the Si-cored structure surrounded by a silicon oxide sheath, and
open circles are those with buckled-ring structure. The inset shows the relative
population of the former (N
D
) and the latter (N
O
) structures at 900 8C.
Fig. 21. Possible path of O atom migration from the center of a (SiO)
n
cluster to
its surface: (a) (SiO)
5
and (b) (SiO)
21
[144].
N. Wang et al. / Materials Science and Engineering R 60 (2008) 1–51 17
remaining reactive Si atoms facing outwards from the substrate.
A Si core would start to form at a size of n $ 5. The nuclei
containing a Si core would grow larger with the assistance of O
diffusion from the core to the surface layer during deposition.
The O diffusion length depends on the temperature and the
crystallographic orientation of the crystalline core formed,
leading to the formation of Si nanowires with different
crystalline orientations such as h110i and h112i, as observed
in our experiments [146]. The above process may be similarly
responsible for the ready formation of Si nanocrystals in the sp
3
configuration from amorphous SiO [147].
The nucleation of Si nanoparticles has been observed to
occur on the substrate due to the decompositions or
precipitation of Si-rich oxide [68,69]. All nuclei are clad by
shells of silicon oxide. The precipitation, nucleation and growth
of Si nanowires always occur at the area near the colder region,
which suggests that the temperature gradient provides the
external driving force. The formation of Si nanowire nuclei at
the initial growth stage is revealed in Fig. 22(a) and (b), in
which some nanoparticles pile up on the matrix surface soon
after the start of the decomposition of SiO. Notably, the
nanowire nuclei that stand separately with their growth
direction normal to the substrate surface undergo fast growth
(Fig. 22(c)). Each nucleus consists of a Si crystalline core and
an amorphous (silicon oxide) outer layer. Fig. 22(d) and (e) are
the model schematically showing this nucleation and initial
growth of Si nanowires from Si-oxide. Different from the VLS
growth, no metal catalysts or impurities exist at the tips of the
nuclei. The key point for the formation of the nanowires is the
fast growth of the nuclei in the h112i orientation of the Si cores
assisted by a thin Si-oxide layer on the tip. Therefore, only
those nuclei with their growth direction of h112i direction
normal to the substrate surface undergo fast growth. Since the
formation of the nanowire nuclei is controlled by the self-
decomposition of SiO, the diameters of the nanowires are
uniform. As observed by electron diffraction and imaging, the
growth direction of Si nanowires from the oxide-assisted
method are along the h112i direction [68].
The catalytic effect of the Si
x
O(x > 1) layers on the
nanowire tips is an important driving force for the nanowire
growth. Among the number of different forms of Si sub-oxides,
some of them are very reactive. The materials at the Si nanowire
tips (similar to the case of nanoparticles) may be in or near their
molten states. This is because that the surface melting
temperatures of nanoparticles can be much lower than that
of their bulk materials, For example, the difference between the
melting temperatures of Au nanoparticles (2 nm) and Au bulk
material is over 400 8C [148]. The atomic absorption, diffusion,
and reaction are thus largely enhanced at the tips.
3.3.2. Effect of defects in 1D growth
Different from the VLS mechanism, the tips of Si nanowires
from oxides contain no metal droplets. HRTEM investigations
show that the defects and silicon oxide outer layers existing at
the nanowire tips may play important roles for the formation
and growth of Si nanowires. Fig. 23(a) illustrates the typical tip
structure. Most tips are round and covered by a thin Si oxide
layer of about 2–3 nm. A high density of stacking faults and
micro-twins exists in the Si crystal core near the tip. Most
stacking-faults and micro-twins are along the axis of the
nanowire in h112i direction. Based on our investigation, we
believe that Si nanowires from the oxide-assisted growth are
determined by several factors, such as defects, lower melting
temperature at the tips, SiO
2
component formed in the shells
and retarding the lateral growth of nanowires, charging effect at
the tips and relativities of Si sub-oxides. Among these facts, we
believe that the defects and the catalytic effects of SiO
x
are
important for the nanowire nucleation and growth.
The main defects in Si nanowires are stacking faults and
nano-twins along the nanowire growth direction of h112i,
which normally contain easy-moving 1/6h112i and non-
moving 1/3h111i partial dislocations. As discussed for the
vapor–solid growth mechanism, dislocation and micro-twins
can significantly enhance the growth of the crystals. For the
nano-twins at the nanowire tips, atoms deposited at the ditch
results in atomic steps along the twining surface. The resulting
growth direction is along the twining plane, i.e., along the
h112i direction. The presence of these defects at the tip areas
should result in the fast growth of Si nanowires since
dislocations and twins provide enough atomic steps and kinks
for the deposition of Si atoms. On the other hand, the melting
temperatures at grain boundaries or interfaces are generally
Fig. 22. (a) The mechanism of the Si nanowires from oxide. (b)TEM image of Si nanoparticles precipitate from the decomposition of SiO matrix. (c) The
nanoparticles in a preferred orientation (e.g., h112i) grow fast and form nanowires. (d) and (e) The model for the nucleation and initial growth of Si nanowires from
Si-oxide [27].
N. Wang et al. / Materials Science and Engineering R 60 (2008) 1–5118
lower than that of the bulk materials. Though the nanowire tips
contain a high density of defects, most of Si nanowires grown
by the oxide-assisted growth in certain growth temperature
contained much low density defects. This may be attributed to
the annealing effect since the nanowires ware grown at about
1000 8C. Residual defects in the nanowires may dismissed by
moving out the surfaces of the nanowires or by re-crystal-
lization and grain grow. The growth temperature of Si single
crystalline nanowires was high enough for the re-crystallization
to occur.
3.3.3. Effect of external electrical field in 1D growth
During the vapor condensation process, latent heat is
released and transferred to the surroundings. The tip of a Si
nanowire may be at a higher temperature in order to achieve a
sufficient rate of heat transfer. Assuming that latent heat is
released only at the tip and that an electric field exists at the tip
due to charge accumulation, latent heat and electrostatic energy
become the two main heat sources. Cheng et al. have
systematically studied the electrical field, temperature and
pressure effects at Si nanowire tips [149,150] and suggested
that the presence of an external electric field might facilitate 1D
growth [149]. A strong electric field at the tip of the nanowires
could attract the SiO clusters in the vapor, not requiring any
difference in physical properties or composition of the head and
the sidewall. Assuming that the typical diameter of the
nanowires is 40 nm, the electric field at the tip would be
2.04 Â 10
10
V/m. There are three possible cases for the gas
phase SiO vapor: (1) the SiO vapor is charged, (2) the SiO vapor
has a permanent dipole moment, and (3) the SiO vapor has an
induced dipole moment. The presence of a strong electric field
at the tip will attract these molecules/clusters towards the tip,
thereby changing their trajectory. The trajectory of the SiO
molecules/clusters to the tip may indicate the percentage of SiO
vapor that lands on the tip compared to that on the sidewall.
Assume that electrostatic attraction is the dominant force
and that the electric field around the nanowire tip is given by
E ¼
Q
4pe
0
r
2
; (3.3.4)
where r is the distance from the center of the nanowire tip. At the
Si nanowire formation temperature (930 8C), the SiO molecules/
clusters move towards the tip with a 930 8C thermal velocity ðvÞ.
The impact parameter is denoted by x (see Fig. 24). Initially, the
molecules/clusters are 1 mean-free path (l)awayfromthe
nanowire tip, so they have undergone the last collision, and thus
no more collisions will occur. Setting z = l, and R is the radius of
the nanowire tip. Since l ) R, the initial electrostatic potential
energy of the SiO molecules/cluster can be neglected.
With the typical nanowire growth at 500 Torr and 930 8C
[11], the number of molecules per unit volume is 4 Â 10
24
m
À3
.
Taking the radius of the SiO molecule to be 1.84 A
˚
, which is the
sum of the covalent radii of the Si and O atoms, the mean-free
path of SiO molecules is of the order 1700 nm, indicating
negligible collision between gas molecules. A SiO molecule/
cluster will land on the nanowire tip when it approaches a tip
with an impact parameter below this threshold value (called
x
th
). Once the threshold impact parameter (x
th
) is obtained, the
probability of the SiO molecule/cluster landing on the nanowire
tip can be approximated by the ratio of the area within the
threshold impact parameter to the ‘‘territory’’ of each nanowire:
landing probability ¼
pðx
th
Þ
2
4ðD=2Þ
2
¼
2x
th
D
2
: (3.3.5)
Fig. 23. (a) The tip structure of an individual Si nanowire from oxide-assisted growth. (b) Si nanowires grown along the h112i direction. Defects such as micro-twins
(marked by the arrow) along the wire axis (marked by the arrow) are frequently observed.
Fig. 24. Geometry of SiO vapor falling on a nanowire tip (from Ref. [149];
Reproduced with permission of American Institute of Physics).
N. Wang et al. / Materials Science and Engineering R 60 (2008) 1–51 19
where D is the diameter of the silicon nanowire and the
threshold impact parameter (x
th
) is given by
x
th
¼ R
ffiffiffiffiffiffiffiffiffiffiffiffiffiffiffiffiffiffiffiffiffiffiffiffiffiffiffi
jU
o
j
ð1=2Þmv
2
þ 1
s
(3.3.6)
with U
o
being the electrostatic potential energy of the SiO
molecule/cluster when it reaches the surface of the nanowire
tip.
(1) If the SiO vapor is singly charged (q = e), and is attracted to
the nanowire tip, the threshold impact parameter can be
calculated by setting
U
0
¼À
Qe
4pe
0
R
¼ÀeE
0
R (3.3.7)
(2) If the SiO vapor has only a permanent dipole moment ( p),
then U
o
= ÀpE
o
.
(3) If the SiO vapor has only an induced dipole moment
(polarizability a), then U
o
¼ð1=2ÞaE
2
o
.
Using some additional parameters estimated according to
experiments, the landing probability is obtained and listed in
Table 1. It seems that the electrostatic attraction to the
molecules in the SiO vapors is sufficiently strong so that all
molecules land on the nanowire tips. None have a chance to hit
the sidewall. In this way, the growth of the nanowires at the tip
is guaranteed.
3.4. Self-assembly growth from solution
The formation of nanowires from solution methods is
complicated. The growth of nanowires generally involves the
following steps: (1) crystalline seed formation; (2) crystal
growth by aggregation of monomers to the seeds; and (3)
surface stabilization by surfactants. So far, several mechanisms
for the anisotropic growth of nanocrystals in solution have been
proposed. Here are three representative mechanisms:
3.4.1. Solution-liquid-solid (SLS) growth from seeds
Similar to the VLS reaction, during the SLS reaction,
monomers are generated by decomposition of molecular
precursor at a high temperature. The metal catalysts for this
kind of reaction are extremely small and therefore easily
activated at low temperatures. The monomers react with the
metal nanoseeds to form supersaturated alloy droplets
(see Fig. 25(a)). Semiconductor nanowire growth, e.g., Si
and Ge nanowires [78,79], from Au nanocatalysts under the
supercritical fluid environment have been achieved. Specially,
ultra-thin nanowires [78] with diameters of 2–3 nm have been
fabricated by this method and interesting optical properties
have been observed in these nanowires. Such small diameters of
nanowires cannot be easily realized by the classical VLS
method from vapor phases.
3.4.2. Self-assembly oriented attachment growth
The self-assembly attachment growth is based on the fact
that nanoparticles generated in solution have a large surface-to-
volume ratio. To reduce the surface energy and thus the total
system energy, the particles may segregate together. Oriented
attachment is one of the ways for this segregation process. Penn
and Banfield [89] first observed this nanowires formation
mechanism in the hydrolytic synthesis of TiO
2
nanocrystals.
Truncated TiO
2
nanocrystals mainly consisted of three faces,
{0 0 1}, {1 2 1} and {1 0 1}. Since the {0 0 1} has the highest
surface energy [90], it is reasonable to remove the high energy
surfaces {0 0 1} since this is thermodynamic favorable.
Through the oriented attachment process, the nanocrystals
are fused along the [0 0 1] direction to eliminate the {0 0 1}
faces (see Fig. 25(b)). This fusion process resulted in the
formation of necklace-shaped wires. Similar structures have
been observed in the growth of nanowire or necklace
nanocrystals chain of CdTe [91], PbSe [92], ZnS [93] and
ZnO [94].
3.4.3. Anisotropic growth of crystals by kinetic control
Anisotropic growth of crystals induced by different surface
energies is the reason for the formation of most elongated
nanocrystals. However, the difference of surface energies (the
intrinsic properties of the crystal) is not large enough to cause
highly anisotropic growth of long nanowires. By adding
surfactants to the reaction solution, it is believed that the
effective surface energy of a nanocrystal can be modulated, and
the surfactant molecules selectively adsorb and bound onto
certain surfaces of the nanocrystal seeds. For example, the
[0 0 1] direction is the fast growth direction of TiO
2
nanocrystal
growth in solution. By adding surfactants, the fast growth
direction can be changed to [101]. The surfactants function as
‘‘structural directors’’. This selective capping effect reduces the
growth of these surfaces and induces the nanocrystal elongation
along a specific direction to form nanowires (see Fig. 25(c)).
The selective capping mechanism has been evidenced recently
in many nanomaterials. Sun et al. [104,105] demonstrated that
Ag nanowires can be fabricated using poly(vinyl pyrrolidone)
Table 1
Summary of the numerical results for SiO molecules (from Ref. [149]; reproduced with permission of American Institute of Physics)
Vapor Charge carried
(q = 1.602 Â 10
À19
C)
Permanent dipole
( p = 1.03 Â 10
À29
Cm)
Induced dipole
(a = 6.93 Â 10
À40
Fm)
Threshold impact parameter x
th
1020 nm 59.9 nm 52.1 nm
Probability of landing on the nanowire tip 4x
2
th
=D
2
100% 100% 100%
Maximum electric field = 2.04 Â 10
10
V/m D = 100 nm
Radius of nanowire tip = 20 nm Radius of SiO molecule = 1.84 A
˚
´
N. Wang et al. / Materials Science and Engineering R 60 (2008) 1–5120
(PVP) as a capping agent. The silver nanocrystals initially
formed by reducing AgNO
3
with ethylene glycol (EG) heated
to $160 8C. These nanocrystals served as seeds for the
nucleation and anisotropic growth of silver. Their explanation is
that PVP selectively bind (or passivate) to the {1 0 0} facets of
Ag particles and allow the growth of {1 1 1} facets. For Au
particles, however, the same capping agent PVP bonded only to
the {1 1 1} faces. Silver nanowires with a high length-to-
diameter ratio (diameters in the range of 30–60 nm and lengths
up to 50 mm) were produced. Both the morphology and aspect
ratios of these silver nanostructures could be well controlled by
the reaction condition.
Using a similar synthetic route, ZnO nanowires have been
fabricated via the hydrothermal reactions of Zn salts in the
presence of capping agents or structural directors, such as
amines [111], hexamethylenetetramine [112]. However, with-
out using any capping agent, ZnO nanowires can also be
fabricated from Zn acetate solution in ethanol mixed with
NaOH [114]. This synthesis is similar to the process described
by Cheng et al. [115]. However, no structural director or
surfactant is needed for the formation of high-quality ZnO
nanowires. The fabrication is simply carried out by using 5 mL
of 0.1 M zinc acetate solution in ethanol, which is mixed with
35 mL of 0.5 M NaOH solution in ethanol to form a solution
that is later transferred into a Teflon-lined stainless steel
autoclave (50 mL) and heated at 180 8C. After 24 h of reaction,
ZnO nanowires with uniform diameters were obtained. In this
synthesis, it is difficult to identify the structural director for the
ZnO crystals.
Fig. 26 shows the morphology changes of ZnO nanowires in
the samples collected at different reaction stages. By increasing
the reaction time, ZnO crystals developed from nanoparticles to
nanorods and then nanowires continually. Noticed as the length
of the nanowires increased, the diameter increased accordingly
(see Fig. 27). The growth of the ZnO nanowires was not the
oriented attachment mechanism. It is also hard to explain the
nanowire growth by the surfactant effect since no surfactant is
involved. The formation mechanisms and the function of the
solution need systematical investigation.
Fig. 25. (a) Schematic diagrams of nanowires formation from solution-based methods by (a) the SLS growth, (b) the oriented attachment growth, and (c) surface
selective surfactant assistant growth (redraw after Ref. [77]).
Fig. 26. TEM images of ZnO nanowires grown from solution. The samples were collected at the reaction time of (a) 10 min, (b) 20 min, (c) 40 min, (d) 1 h.
Fig. 27. The changes of the diameters and lengths of ZnO nanowires vs.
reaction time.
N. Wang et al. / Materials Science and Engineering R 60 (2008) 1–51 21
4. Controlled growth of nanowires
4.1. Control of structures, growth direction and defects in
nanowires
4.1.1. Interface structures
Due to the presence of metal catalysts in the VLS growth, the
geometry and atomic structure of the interface between the
metal catalyst and the nanowire have been found to be very
critical to the nanowire growth and formation of defects,
particularly the growth direction or crystal orientation in ultra-
thin nanowires. Various interface structures have been
identified by HRTEM studies [131,151–153]. With respect to
cubic semiconductor whiskers that have grown along the
h111i direction, the interface at the catalyst is generally
perpendicular to the wire axis. However, for other growth
directions, the interfaces are generally not perpendicular to the
wire axis. This feature becomes obvious when the diameters of
these cubic nanowires are smaller than 30 nm.
As an example, Fig. 28 shows the typical interface structures
of ZnSe nanowires grown by MBE technique. Since the
impurity of source materials, surface structures of the substrate
and growth condition can be well controlled by MBE, an
interesting growth phenomenon of ultra-thin nanowires has
been revealed. The typical growth directions of cubic
semiconductor nanowires are [1 1 1], [1 1 2], [1 1 0] and
[0 0 1]. The interface structures of different oriented nanowires
show distinct morphologies. With respect to the [1 1 1] growth
nanowires, the interfaces at the catalysts are flat (1 1 1) planes
which are perpendicular to the wire axis (Fig. 28(a)). For the
[1 1 2] and [1 1 0] nanowires, the interfaces are generally along
the (1 1 1) planes which are not perpendicular to the nanowire
axis as shown in Fig. 28(b) and (c). Zigzag interfaces in these
two oriented nanowires are frequently observed. The zigzag
interfaces in the nanowires grown along the [1 1 2] direction
mainly consist of (1 1 1) plus a small fraction of (0 0 1) facets
(Fig. 28(d)). The zigzag interfaces in the [1 1 0] nanowires
consist of (1 1 1) and ð1
¯
11Þ planes (Fig. 28(e)). In this case, the
flat (1 1 1) interface and the zigzag one have the same interface
area. The reason that these (1 1 1) planes are dominant at the
interfaces is simply due to its low interface (or surface) energy
compared to other planes. In cubic semiconductor materials, for
example, Si, Ge and ZnSe, the (1 1 1) is often the lowest surface
energy plane and (0 0 1) is the second lowest energy surface
[131,154,155]. Therefore, it is reasonable that (0 0 1) facets
appear in addition to the (1 1 1) facets at the interfaces. Fig. 29
illustrates the interface models for various growth directions
that have been experimentally observed.
During the VLS growth, the metal catalysts are liquid at any
temperature above the eutectic point. At the tip of a nanowire,
there is a terminal growth zone in the order of several
monolayers where atoms are in a nearly semi-molten state
[128]. The theoretical calculation has shown that the atoms at
the solid phase near the LS interface actually move away
immensely from the lattice sites [128]. Using FCC structure
models, computer simulation on the LS interface of (1 1 1) and
(1 0 0) indicated that there were several layers of atoms in the
‘‘quasi-crystalline’’state in which the amount of diffusion is not
negligible, although the atoms spend most of their time in the
lattice sites. This special LS zone is schematically shown by Lc
(also called the critical thickness in the following discussion) in
Fig. 30(a). Within this special zone, atoms in the nanowires are
Fig. 28. ZnSe nanowires grown along (a) [1 1 1], (b) and (e) [1 1 0], (c) and (d) [1 1 2], and (f) [0 0 1] directions. .
N. Wang et al. / Materials Science and Engineering R 60 (2008) 1–5122
able to rearrange without changes in the original crystal
structure so that the nanowire may display a certain growth
direction (see Fig. 30(b)). The thickness of the LS zone is
proportional to the growth temperature. A higher temperature
results in a thicker LS zone. Even if the growth temperature is
lower than the eutectic point, the LS zone may still exist due to
the interface melting effect. Such a special interface has been
observed in {1 1 1} Si–Al nanocrystal growth [51]. It was
found that the atoms in the LS region were in a partially molten
state. The width of this region was about 1.9 nm. The interface
structures are important for the growth behaviors of ultra-thin
nanowires. For the classical VLS deposition, the atomic
diffusion is mainly controlled by the droplet. However, for
growth at a relatively low temperature, the atomic diffusion and
deposition are mainly controlled by surface and interfaces. In
addition, this special LS zone has been found to be a critical
parameter for controlling the growth direction transition of
ultra-thin nanowires [131].
4.1.2. The growth direction of VLS nanowires
The crystal orientation in semiconductor nanowires is
important because it not only affects surface properties, but also
their optical and transport properties [78,156]. For cubic
semiconductor nanowires, several growth directions have been
frequently observed, such as h111i [7], h112i [11,14,157]
and h110i [78,158,159]. For most thick nanowires or
whiskers, h111i growth direction is considered to be
energetically favorable. Ultra-thin nanowires, such as Si, II–
VI and III–V nanowires, often show variant growth directions.
Nanowires often show different growth directions even on the
same substrate. This feature is illustrated in Fig. 31(a), in which
ZnSe nanowires inclined mainly along four directions, that is, at
Æ198 or Æ128 (along the h112i direction as indicated in the
pole stereographic projection diagram of cubic crystals in
Fig. 31(b)) and Æ358 (along the h110i direction) to the normal
of the GaP(1 1 1) surface, respectively. On Si(1 0 0) substrate,
Si nanowires grown by UHV-CVD displayed similar features of
different growth directions [160].
By controlling the sizes of the catalysts and growth
temperatures, it is observed that at the same growth
temperature, all the nanowires with the same diameter actually
grow along a specific direction. Fig. 32(a) and (b) illustrates the
typical morphologies of ZnSe nanowires grown on GaAs(0 0 1)
substrates at 530 8C. Fig. 32(a) were taken with an electron
beam that is nearly parallel to the [1 1 0] direction of the
Fig. 29. The interface models of the different growth directions of nanowires. (a) [1 1 0], (b) [1 1 2], and (c) [0 0 1] growth directions.
Fig. 30. Schematic of the LS zone at the tip of the nanowires grown by the VLS
and the growth direction change at the critical thickness.
Fig. 31. (a) TEM image of the cleaved specimen viewed with an electron beam that is nearly parallel to the ½1
¯
10 direction of the GaP(1 1 1) substrate. ZnSe
nanowires inclined mainly along four directions at Æ198 and Æ358 as indicated by the arrows. (b) The ½1
¯
10 pole stereographic projection diagram of cubic crystals.
Some poles of h110i and h112i are indicated [14].
N. Wang et al. / Materials Science and Engineering R 60 (2008) 1–51 23
GaAs(0 0 1) substrate. These ultra-thin ZnSe nanowires grew
mainly along two directions that inclined approximately Æ358
to the normal of the substrate surface. When observed along the
½1
¯
10 direction, the nanowires displayed the same inclination.
Obviously, these nanowires grew along four equivalent h110i
directions of the substrate.
At 530 8C, ZnSe nanowires with diameters smaller than
10 nm grew mainly along the h110i direction on different
substrate surfaces (for example, (1 1 1), (1 1 0) and (1 0 0)
substrates). This can also be seen in Fig. 32(e), in which almost
all ZnSe nanowires with diameters of about 10 nm grew
perpendicularly to the GaAs(1 1 0) substrate surface, that is,
along the [1 1 0] direction. The nanowires with diameters
greater than 30 nm prefer growing along the h111i direction
on GaAs substrates [131]. Thick Si nanowires grown from
SiH
4
/H
2
have a similar growth behavior as shown by the SEM
pictures (top view) in Fig. 32(f). All of these Si nanowires grow
along the h111i direction and have 3 equiv. h111i directions
at 608 to each other. ZnSe nanowires with diameters ranging
from 10 to 20 nm may grow along the h112i or h110i
direction on these substrates. The change in the growth
direction from h111i to h110i at a crossover diameter of
approximately 20 nm in Si nanowires grown by CVD has been
reported by Schmidt et al. [160]. They also observed that Si
nanowires with diameters greater than 40 nm preferred to grow
in the h111i direction. Nanowires show obvious diameter-
dependency when the growth condition is specified. Notice that
the data on the growth directions of semiconductor nanowires
from different research groups are very scattered and some-
times confusing. Even for one type of material, the nanowires
with very similar diameters synthesized by different groups
may have different growth directions. The main reason is that
the fabrication condition varied from group to group.
Systematical investigation for the growth condition, the
atomistic structures of the nanowires and the catalyst is
absolutely needed.
Si and II–VI compound nanowires have been studied and
compared to data reported by different groups and it was found
that nanowires from cubic semiconductor materials have
common features in growth direction. In the past years, models
based on various assumptions have been proposed for
interpreting nanowire growth directions. The growth direction
h112i and h110i of Si nanowires synthesized by laser
ablation or thermal evaporation of SiO source materials has
been analyzed theoretically by Tan et al. [161,162]. In their
model, four criteria have been considered, such as the stability
of Si atoms at the surface, the stability of Si{1 1 1} surface, the
stepped Si{1 1 1} surface growth and the dislocation effect.
With these criteria, it is concluded that h112i and h110i are
the preferred growth direction and that h111i and h100i are
not favored. Based on the modeling of interface, surface
energies together with the edge tension term, Schmidt et al.
[160] demonstrated that for large diameters, the direction with
the lowest interface energy is dominant, where for small
diameters the surface energy determines the nanowire
preferential growth direction. Si nanowires with diameters
larger than 40 nm grew along the h111i direction. Thin Si
nanowires (diameter <20 nm) mostly grew along the h110i
direction. They did not consider the h112i growth direction
due to unavailable parameters.
Zhang et al. [171] have studied the structures and energetics
of hydrogen-terminated Si nanowire surfaces and explained the
experimental findings about the relative abundance of the Si
nanowire growth directions. Some cross-sections identified in
Si nanowires, the size dependences of the stability and the
band-gap energy of these Si nanowires enclosed by low-index
surfaces have been revealed by performing density-functional
tight-binding simulations. Fig. 33 shows representative possible
cross-sections for example for the h111i, h110i and h100i
wires enclosed by low-index surfaces. These wires may have
different possible cross-sections. Many low-index facet
configurations and cross-sections are possible, which may
lead to the difficulty of controlled growth. In general, the
stability of a Si nanowire is determined by a balance between
(1) minimization of the surface energy and (2) minimization of
the surface-to-volume ratio.
The recent TEM study of the cross-sections of Si nanowires
with large diameters grown by the oxide-assisted technique
identified some interesting cross-sections, such as square,
rectangular, and triangular cross-sections [172]. It is also
revealed that the more frequent abundance of the h112i (first)
and h110i (second) direction in these nanowires. As identified
Fig. 32. (a)–(d) and (e) are ZnSe nanowires grown on GaAs(0 0 1) and (1 1 0) substrate surfaces, respectively. (a), (b) and (e) are grown at 530 8C, (c) and (d) are
grown at 390 8C. (f) Si nanowires grown on Si(0 0 1) substrate [127].
N. Wang et al. / Materials Science and Engineering R 60 (2008) 1–5124
by scanning tunneling microscopy, an ideal h112i Si nanowire
with an ultra small diameter (hydrogen-terminated after HF
etching) was shown to be either a flat (1 1 1) surface or a flat
(1 1 0) surface [173].
The TEM work of Wu et al. [151] indicates a somewhat
different abundance of Si nanowires grown using the VLS
method than observed with the oxide-assisted method. They
found that the abundance of the Si nanowire growth directions
depends on the Si nanowire diameter (d) as follows: (1) almost
only h110i wires ($98%) are observed for d < 10 nm, (2) the
h112i wires are most abundant for 10 < d < 20 nm ($65%)
but significant amounts of h110i (20%) and h111i (15%) are
still found, (3) the h111i is the most abundant Si nanowires for
d > 20 nm (65%), but 30% h112i and 5% h110i wires are
still observed. Wu et al. [151] attributed the abundance of the
growth direction to the formation of a lowest energy liquid/
solid (1 1 1) interface first and the surface energetics driving the
faceting growth along a specific direction occurs as a second
stage. This may explain why in the OAG process where the
nucleation is different, surface energetics is more dominant, i.e.
the most stable h112i Si nanowires are the most common for
small diameters. The cross section of a 3.8 nm h110i Si
nanowires observed by TEM in Ref. [151] is similar to the
hexagonal h110i wire in the previous STM work [173]
enclosed by four (1 1 1) and two (1 0 0) surfaces that was
discussed above.
Based on the interface structures and growth directions of
different sizes in the II–VI nanowires, another plausible model
was proposed [131] to elucidate the diameter-dependent growth
direction of ultra-thin nanowires by estimating the surface and
interface energies of nanowires. The interface and surface
energies were found to determine the nanowire growth
directions. The estimation and comparison of the nanowire
energies are based on the following facts: (1) The interfaces at
the root of the II–VI nanowires grown along h111i, h112i and
h110i on GaAs(1 1 1) or GaP(1 1 1) substrates were always
{1 1 1} since the nanowires epitaxially formed on the substrate.
(1) At the tips of the nanowires, the interfaces between the
metal catalysts and the nanowires with different growth
directions and diameters were also {1 1 1}. The geometries of
the nanowires are illustrated in Fig. 34. The interfaces are
sometimes not flat and are shown in Fig. 28 as examples for the
[1 1 2] and [1 1 0] nanowires. However, the zigzag interfaces
are mainly consisted of (1 1 1) facets. For the [1 1 0] nanowire,
the interface areas (between the catalyst and the nanowire) for
the flat interface and zigzag interface are identical. The
observed preferences for growth directions can be understood
in terms of the liquid catalyst/nanowire interfacial energy and
the ZnSe nanowire surface energy. Obviously, on the same
substrate, the growth of the nanowires is driven by the
minimum state of the total surface and the interfacial energy of
the nanowire.
To estimate the total energy of a nanowire, the nucleus of a
ZnSe nanowire as a column with two plane interfaces and a
cylindrical side surface is taken under consideration. Since the
surface-to-volume ratio is high and the bulk crystal energy is
independent of a nanowire orientation, only surface and
interface energies need to be considered. For nanosized
crystals, a cylindrical side surface generally consists of low-
energy surfaces and steps. As shown in Fig. 34, the hexagonal
shape is a moderately good approximation to describe the
cross-section of a nanocatalyst or a nanowire [163]. The
hexagonal shapes predicted by the Wulff construction are
moderately good approximations to describe the cross-section
of nanowire nuclei (see Fig. 34(c)). Fig. 34(b) is the top view of
the Au-catalyst at the tip of a [1 1 0]-oriented ZnSe nanowire.
The catalyst is hexagonally shaped and the side surfaces are
{1 0 0} and {1 1 1}, which agree well with the model in Fig. 34.
For the three growth directions (h111i, h112i and h110i),
the most possible side surfaces are schematically shown in
Fig. 34(c). The initially formed nanowires should be hexagonal
disks. The side surfaces can be {1 1 1}, {1 1 0}, {1 1 3} and
{1 0 0} (the energetically most favorable surfaces with low
surface energies). The top and bottom surfaces are interfaces
with the catalyst and the substrate, respectively. Thus, the total
energy of a nanowire nucleus is
F ¼
X
Ag
s
þ E
e
(4.1.1)
In this context, Ag
s
and E
e
denote the surface/interface energy
and edge/step energies, respectively. A is the area of the surface/
interface. For the hexagonal shape approximation, E
e
can be
considered as a fixed term for different oriented nanowires.
Therefore, only surface and interface energies need to be
Fig. 33. Representative possible cross sections for the h111i, h110i and h100i wires enclosed by low-index surfaces [171].
N. Wang et al. / Materials Science and Engineering R 60 (2008) 1–51 25