- Trang chủ >>
- Khoa Học Tự Nhiên >>
- Vật lý
hydrothermal synthesis and structural characterization of fe2o3sno2 nanoparticles
Bạn đang xem bản rút gọn của tài liệu. Xem và tải ngay bản đầy đủ của tài liệu tại đây (492.62 KB, 9 trang )
Hydrothermal synthesis and structural characterization
of (1 2 x)a-Fe
2
O
3
–xSnO
2
nanoparticles
Monica Sorescu
a,
*
, L. Diamandescu
a,b
, D. Tarabasanu-Mihaila
b
, V.S. Teodorescu
b
, B.H. Howard
c
a
Department of Physics, Bayer School of Natural and Environmental Sciences, Duquesne University, 211 Bayer Center, Pittsburgh, PA 15282-0321, USA
b
National Institute for Materials Physics, P.O. Box MG-7, Bucharest, Romania
c
National Energy Technology Laboratory, Fuels and Process Chemistry Division, US Department of Energy, Pittsburgh, PA 15236-0940, USA
Received 22 August 2003; accepted 24 October 2003
Abstract
Structural and morphological characteristics of (1 2 x)a-Fe
2
O
3
–xSnO
2
ðx ¼ 0:0 – 1:0Þ nanoparticles obtained under hydrothermal
conditions have been investigated by X-ray diffraction (XRD), transmission Mo
¨
ssbauer spectroscopy, scanning and transmission electron
microscopy as well as energy dispersive X-ray analysis. On the basis of the Rietveld structure refinements of the XRD spectra at low tin
concentrations, it was found that Sn
4þ
ions partially substitute for Fe
3þ
at the octahedral sites and also occupy the interstitial octahedral sites
which are vacant in a-Fe
2
O
3
corundum structure. A phase separation of a-Fe
2
O
3
and SnO
2
was observed for x $ 0:4 : the a-Fe
2
O
3
structure
containing tin decreases simultaneously with the increase of the SnO
2
phase containing substitutional iron ions. The mean particle dimension
decreases from 70 to 6 nm, as the molar fraction x increases up to x ¼ 1:0: The estimated solubility limits in the nanoparticle system
(1 2 x)a-Fe
2
O
3
–xSnO
2
synthesized under hydrothermal conditions are: x # 0:2 for Sn
4þ
in a-Fe
2
O
3
and x $ 0:7 for Fe
3þ
in SnO
2
.
q 2003 Elsevier Ltd. All rights reserved.
Keywords: A. Magnetic materials; B. Chemical synthesis; C. Mo
¨
ssbauer spectroscopy; C. X-ray diffraction
1. Introduction
During the last few years much attention has been
paid to the synthesis and study of semiconducting oxides
due to their sensing properties in the detection of toxic or
dangerous gases (such as CO, NO
2
,Cl
2
,CH
4
) [1–3].
Enhanced gas sensing properties are expected for
nanostructured semiconducting oxides due to the great
surface activity provided by their high surface areas.
Being a promising gas sensing material, the oxide system
(1 2 x)a-Fe
2
O
3
–xSnO
2
has been prepared by various
methods at nanometric scale [4 –8], especially at low tin
content. The solubility of SnO
2
in a-Fe
2
O
3
is less than
1 mol% below 1073 K, while it increases to 4 mol% at
1473 K [9,10]. High energy ball milling was used to
extend the range of composition at about 6 mol% [4].It
was suggested that the content of Sn
4þ
may have an
important role in the gas sensing activity of this
compound. However, the mechanism of sensing in
(1 2 x)a-Fe
2
O
3
–xSnO
2
is not well understood due to
an incomplete understanding of its microstructure
characteristics.
The structure of a-Fe
2
O
3
(hematite) is based on
hexagonal close packing of oxygen with iron in 2/3 of
the octahedral vacancies. The lattice parameters are: a ¼
5:038
A; c ¼ 13:772
A: The space group is (S.G. 167)
R32=c: At low temperature it is antiferromagnetic with
spins oriented along the electric field gradient axis. When
the temperature is raised, to about 260 K a spin flop
transition (known as the Morin transition) occurs and the
spins shift by about 908 becoming canted to each other.
This transition results in a weak ferromagnetic moment
along the electric field gradient axis. SnO
2
is known to
crystallize in tetragonal, orthorhombic or cubic structures.
The most common structure is the tetragonal phase
(rutile type structure) known as cassiterite, with a ¼
4:7382ð4Þ
A; c ¼ 3:1871ð1Þ
A and the space group (S. G.
136) P42=mnm:
In the early stage of research on this material it was
believed that Sn
4þ
enters substitutionally in the hematite
lattice with the subsequent formation of cationic and
0022-3697/$ - see front matter q 2003 Elsevier Ltd. All rights reserved.
doi:10.1016/j.jpcs.2003.10.062
Journal of Physics and Chemistry of Solids 65 (2004) 1021–1029
www.elsevier.com/locate/jpcs
*
Corresponding author. Tel.: þ1-412-396-4166; fax: þ1-412-396-4829.
E-mail address: (M. Sorescu).
anionic vacancies. Later, it was shown by X-ray
diffraction (XRD) spectra refinements [11] that the tin
ions occupy two distinct sites. In addition to partly
substituting for Fe
3þ
in octahedral sites they also occupy
vacant interstitial octahedrals in the hematite structure.
Besides XRD and EXAFS, transmission Mo
¨
ssbauer
spectroscopy investigations on both
57
Fe and
119
Sn
isotopes have been performed for a better understanding
of the site occupancy of Sn
4þ
in the hematite lattice [12].
Finally, it was found that the degree of order given by
the mentioned approach is far from perfect and that the
microstructural defects are highly sensitive to tin content
and preparative methods.
In this paper we report the synthesis of the (1 2 x)a-
Fe
2
O
3
–xSnO
2
nanoparticles via a hydrothermal route
over the entire concentration range of x ¼ 0:0 –1:0: X-ray
(XRD) and electron diffraction including selected area
electron diffraction (SAED), transmission Mo
¨
ssbauer
spectroscopy, transmission and scanning electron
microscopy as well as energy dispersive X-ray analysis
(EDX) have been used to correlate the structure,
morphology and phase dynamics in this system, in
correlation with the tin concentration. Experimental
evidence of the solubility limits of Sn
4þ
in the hematite
structure and of Fe
3þ
in SnO
2
are discussed.
2. Experimental
A series of (1 2 x)a-Fe
2
O
3
–xSnO
2
ðx ¼ 0:0– 1:0Þ was
prepared under hydrothermal conditions. The hydrother-
mal syntheses were performed in a 50 ml Teflon lined
stainless steel autoclave, starting with an aqueous mixture
of iron (III) chloride hexahydrate, FeCl
3
·6H
2
O, and
tin(IV) chloride pentahydrate, SnCl
4
·5H
2
O. A 25%
ammonium hydroxide solution was used as precipitation
agent to attain a pH equal to 8. The suspension of
precipitated solids was heated in autoclave at 200 8C for
4 h and then quenched to room temperature. The
corresponding vapor pressure at 200 8C was about
15 atm. The resulted precipitate was filtered, washed
with water until no chloride ions were detected by silver
nitrate solution and then dried in a furnace at 105 8C.
The structure of the powders was examined using Rigaku
D-2013 X-ray diffractometer with Cu K
a
radiation ð
l
¼
1:540598
AÞ: The
57
Fe Mo
¨
ssbauer spectra were recorded
at room temperature using a
57
Co in Rh matrix source
and an MS-1200 constant acceleration spectrometer. The
sample thickness was 7 mg Fe/cm
2
. JEOL 200 CX and
Topcon 002B electron microscopes were used for the
electron microscopy analyses. The actual level of tin
molar content x was determined by EDX using a Kevex
system installed on the Topcon microscope. The EDX
analyses were carried out using a 30 nm electron beam
spot. Measurements were performed on several different
sites on each specimen, in order to examine
the compositional uniformity. The determined average
values of x; for the analyzed series of mixed samples
are: x ¼ 0:08; 0.15, 0.21, 0.31, 0.40, 0.56, 0.70, 0.77
and 0.86.
3. Results and discussion
The X-ray diffraction patterns of the hydrothermally
synthesized samples have been analyzed to study the
phase structure in relation to the tin concentration x: In
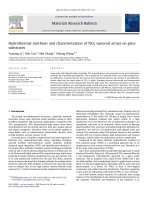
Fig. 1 selected XRD spectra from the entire concen-
tration range are shown. Dramatic changes in phase
composition and peak broadening are observed over
Fig. 1. X-ray diffraction patterns of the (1 2 x)a-Fe
2
O
3
–xSnO
2
nanopar-
ticles; (a) x ¼ 0:0; (b) x ¼ 0:08; (c) x ¼ 0:21; (d) x ¼ 0:40; (e) x ¼ 0:70; (f)
x ¼ 0:86 and (g) x ¼ 1:0:
M. Sorescu et al. / Journal of Physics and Chemistry of Solids 65 (2004) 1021–10291022
the range of tin content x: At x ¼ 0:0; the XRD spectrum
(Fig. 1(a)) corresponds to pure a-Fe
2
O
3
(JCPDS-ICDD
card No. 13-534) synthesized under hydrothermal con-
ditions from FeCl
3
·6H
2
O. Small changes in the line
positions and broadening are observed in Fig. 1(b),at
x ¼ 0:08: In Fig. 1(c) ðx ¼ 0:21Þ the characteristic lines
of SnO
2
(JCPDS-ICDD card No. 41-1445) appear. As the
tin content in the samples increases, the amount of a-
Fe
2
O
3
phase diminishes for x ¼ 0:86 (Fig. 1(f)) and only
the large peaks corresponding to SnO
2
structure are
observed. At x ¼ 1:0(Fig. 1(g)) XRD pattern corre-
sponds to pure, tetragonal SnO
2
phase. The observed
increase in the peak broadening is due to decreasing
grain size, as shown by particle dimension calculation
using the Scherrer equation [13]. The plot of particle
dimension versus tin content x in the system is shown in
Fig. 2 together with the best fit of the data—an
exponential decay curve (continuous line). This behavior
reveals the fast decrease of the mean particle diameter by
increasing the tin content in the hydrothermal system.
The particle distribution, ranging from 70 to approxi-
mately 6 nm, was confirmed by transmission electron
microscopy (TEM) investigations. Representative TEM
images are shown in Fig. 3.InFig. 3(a) the morphology
of the pure hematite crystallized under hydrothermal
conditions is shown. The crystallites are without defects
and generally have the typical rhombohedral morphology
of hematite. In this habit, the main surface crystal-
lographic plane is (102). For x ¼ 0:08; (Fig. 3(b)), the
morphology is nearly the same, but the hematite
crystallites are smaller and some lattice defects are
evident. At x ¼ 0:15; the morphology changes and
the crystallites are highly imperfect (Fig. 3(c)). Some
crystallites are as large as 100 nm, but the average
crystallite, as determined by XRD, is much smaller. For
these samples, EDX measurements were performed by
focusing the electron beam on one or two crystallites.
The results were similar with a variation of less than 2%,
reflecting a rather uniform composition in the sample.
Fig. 3(d) and e show the crystallites in the samples with
x ¼ 0:21 and 0.31. For these cases the particles are small
(generally between 20 and 30 nm), defective and without
a definite geometric shape. In the case of sample with
x ¼ 0:4; remarkable changes occur. The dispersion in
crystallites dimension is very large, from several
nanometers to 100 nm. At the same time, the EDX
measurements evidence large compositional variations
through the specimen. Fig. 4(a) and (b) show the TEM
image and the corresponding SAED pattern. Two
crystallite morphologies are clearly observed. The large
crystallites have a hematite structure and the small ones
exhibit the typical cassiterite structure, showing that this
sample crystallized as a mixture of the two compounds.
The SnO
2
diffraction rings (Fig. 4(b)) reveal a contrac-
tion of about 3% of the cassiterite lattice parameters. For
x . 0:56 the crystallites are small (less than 10 nm) and
the samples are quite uniform. The high magnification
TEM image in Fig. 3(g) (for x ¼ 0:86) is representative
of these samples. The uniformity of the crystallites in
these two samples is evidenced by the low magnification
image in Fig. 3(h) (at x ¼ 1:0). For all these samples, the
electron diffraction patterns indicate a tetragonal SnO
2
(cassiterite) structure.
Rietveld structure refinements [14] have been per-
formed for the samples at low tin concentrations in order
to obtain information concerning the site occupancy in
the a-Fe
2
O
3
lattice. In the hematite structure the Fe
3þ
ions with coordinates of ð 0; 0; zÞ occupy 2/3 of the
octahedral holes in successive oxygen layers, and 1/3 of
the octahedral holes with coordinates of ð0; 0; 0Þ are
empty. In the case of our samples, the best fit was
obtained by allowing the presence of tin ions in both
substitutional ð0; 0; zÞ and interstitial ð0; 0; 0Þ sites in the
hematite corundum type structure. This finding is in good
agreement with the model proposed in Ref. [11]. The
final set of refined parameters are shown in Table 1 and
the experimental XRD and calculated profiles are
displayed in Fig. 5(a) and (d). It is reasonable that
the substitutional and interstitial sites have equal site
occupancy. The tin concentrations resulting from the
XRD refinement are slightly greater than those measured
by EDX.
The refinement of XRD spectra at low tin concentration
indicates an increase of the lattice parameters c and a of the a-
Fe
2
O
3
structure (Fig. 6). This result supports our expectation,
because the six coordinated ionic radius of Sn
4þ
is greater
(, 0.83 A
˚
) than the ionic radius of Fe
3þ
ion (, 0.79 A
˚
). The
saturation effect observed in Fig. 6 starting with x , 0:2
Fig. 2. Average grain size of (1 2 x)a-Fe
2
O
3
–xSnO
2
nanoparticles versus
molar concentration x; as given by the Scherrer formula. The line is the fit
with the exponential decay curve.
M. Sorescu et al. / Journal of Physics and Chemistry of Solids 65 (2004) 1021–1029 1023
suggests the extent of the solubility of Sn
4þ
in the a-Fe
2
O
3
lattice. At x , 0:7 the rutile phase structure becomes
dominant. The lattice parameters c and a, of the tetragonal
SnO
2
cell contract as the content of Fe
3þ
ions increases (Fig.
7(a) and (b)) suggesting the dissolution of iron ions into
SnO
2
. The contraction of the SnO
2
lattice parameters, Fig. 7,
is as much as 3%, in good agreement with electron diffraction
data. At x ¼ 1:0 the lattice parameters are close to the
theoretical values for tetragonal SnO
2
.
Fig. 8 shows representative
57
Fe Mo
¨
ssbauer spectra
recorded at room temperature for the hydrothermally
synthesized (1 2 x)a-Fe
2
O
3
–xSnO
2
nanoparticles. Major
changes in Mo
¨
ssbauer line shape and the disappearance of
magnetic hyperfine structure as tin content in the samples
Fig. 3. Representative TEM images on the (1 2 x)a-Fe
2
O
3
–xSnO
2
nanoparticles showing the dimension range and the characteristic shape; (a) x ¼ 0:0; (b)
x ¼ 0:08; (c) x ¼ 0:15; (d) x ¼ 0:21; (e) x ¼ 0:31; (f) x ¼ 0:40; (g) x ¼ 0:86 and (h) x ¼ 1:0:
M. Sorescu et al. / Journal of Physics and Chemistry of Solids 65 (2004) 1021–10291024
increases are apparent. The six line pattern at x ¼ 0:0in
Fig. 8, with hyperfine magnetic field H
hf
, 51:3T; quadru-
pole splitting DE
Q
of 2 0.29 mm/s and isomer shift
d
,
0:31 mm=s; is characteristic of the Mo
¨
ssbauer spectrum of
the hematite structure [15]. The continuous line represents
the fit of the hypothesized Lorentzian lineshape. The
presence of Sn
4þ
ions in the system increases the complex-
ity of the computer fit. For the fit, we have to consider
the preference of tin ions for octahedral positions as well as
that the hyperfine field corresponds to different environ-
ments at the iron nucleus. In our system at least
three different nearest-neighbor interactions could exist:
iron–iron, iron–tin and iron–cation vacancy. These
possible interactions imply that at least three magnetic
sublattices have to be considered in the computer fit. The fit
obtained with this approximation was far from acceptable.
The best fit was obtained by using a distribution of hyperfine
fields. Representative Mo
¨
ssbauer spectra and the corre-
sponding sublattices are presented in Fig. 9(a, b, c), together
with the magnetic hyperfine field distribution probabilities
given by the computer fit (Fig. 9(A, B, C)) for the samples
with x ¼ 0:08; 0.21 and 0.31. At x ¼ 0:08 the distribution is
rather narrow and can be well approximated with a
Lognormal one; this behavior reflects minor changes in
the electron spin density at the iron nucleus due to small
amounts of tin neighboring ions. The Mo
¨
ssbauer spectra at
x ¼ 0:21 and 0.31 as well as the resulting magnetic
hyperfine distributions (Fig. 9(B, C)) reflect the spectacular
changes in the structure as the tin content increases. The best
fit with the data has been obtained considering a hyperfine
magnetic field distribution accompanied by a central
quadrupole doublet. The distribution is spread out to
lower values and presents some small peaks reflecting
a high degree of disorder in the structure. The maximum
Fig. 4. TEM image (a) and the corresponding SAED pattern (b), on the
mixed structure sample (1 2 x)a-Fe
2
O
3
–xSnO
2
at x ¼ 0:4:
Table 1
Ion positions, site occupancy, reliability R factors and lattice parameters obtained in the Rietveld structure refinement of XRD patterns for (1 2 x)a-Fe
2
O
3
–
xSnO
2
nanoparticles, at x ¼ 0:0; 0.08, 0.15 and 0.21
Sample (x) Atom x=ay=bz=c Site occupancy Reliability R factors (%) Lattice parameters (A
˚
)
x ¼ 0:0 Fe 0.0 0.0 0.3553 1.0 Rp ¼ 7.84, Rwp ¼ 10.98, Rexp ¼ 6.63 a ¼ 5:0341; c ¼ 13:7482
O 0.3059 0.0 0.25 1.0
x ¼ 0:08 Fe 0.0 0.0 0.3547 0.930 Rp ¼ 7.57, Rwp ¼ 10.11, Rexp ¼ 6.77 a ¼ 5:0509; c ¼ 13:7871
Sn1 0.0 0.0 0.3547 0.035
Sn2 0.0 0.0 0.0 0.035
O 0.3079 0.0 0.25 1.0
x ¼ 0:15 Fe 0.0 0.0 0.3549 0.870 Rp ¼ 9.91, Rwp ¼ 12.56, Rexp ¼ 5.01 a ¼ 5:0592; c ¼ 13:7983
Sn1 0.0 0.0 0.3549 0.065
Sn2 0.0 0.0 0.0 0.065
O 0.3081 0.0 0.25 1.0
x ¼ 0:21 Fe 0.0 0.0 0.3510 0.810 Rp ¼ 11.57, Rwp ¼ 15.62, Rexp ¼ 3.14 a ¼ 5:0693; c ¼ 13:8093
Sn1 0.0 0.0 0.3510 0.095
Sn2 0.0 0.0 0.0 0.095
O 0.3084 0.0 0.25 1.0
M. Sorescu et al. / Journal of Physics and Chemistry of Solids 65 (2004) 1021–1029 1025
values of magnetic hyperfine fields remain close to the
hematite value but the probability drops with the increase of
Sn
4þ
in the system. The maximum hyperfine field value in
the distribution can be ascribed to Fe
3þ
ions without Sn
4þ
in
nearby lattice sites, while the distributions at lower
magnetic fields reflects the lower spin density at Fe
3þ
in
the vicinity of Sn
4þ
nearest neighbors. This behavior
suggests that we are not dealing with relaxation effects
due to the dilution of a magnetic system (or super-
paramagnetic effects associated with the decreasing
of particle dimension) but with the diminishing of
hematite-like phase as the tin content in samples increases.
The intensity of the central quadrupole doublet increases as
the magnetic component in the system decreases and
becomes the dominant pattern in the Mo
¨
ssbauer spectra at
greater tin concentration (Fig. 8). The related Mo
¨
ssbauer
hyperfine parameters of the order of 0.77 mm/s for DE
Q
and 0.38 mm/s for
d
; and line width close to the natural
one, approximately constant from x ¼ 0:21 to 0.86, are
appropriate for Fe
3þ
in the ‘S’ state. Taking into account
the appearance of the broadened rutile type structure in
the XRD spectra at x $ 0:21 (Fig. 1(c) and (d)) we can
assign the doublet in the Mo
¨
ssbauer spectrum to Fe
3þ
ions
substituting for Sn
4þ
in the tetragonal SnO
2
structure. It is
known [16] that 3-d transition element impurities enter
Fig. 5. Experimental (·), calculated (—) and difference X-ray powder
diffraction patterns recorded on (1 2 x)a-Fe
2
O
3
–xSnO
2
nanoparticles; (a)
x ¼ 0:0; (b) x ¼ 0:08; (c) x ¼ 0:15 and (d) x ¼ 0:21:
Fig. 6. The lattice parameters of the hematite phase in (1 2 x)a-Fe
2
O
3
–
xSnO
2
samples versus tin molar concentration x; (a) the lattice parameter a
and (b) the lattice parameter c. The lines are guides to the eye.
Fig. 7. The lattice parameters of the SnO
2
phase in (1 2 x)a-Fe
2
O
3
–xSnO
2
samples versus iron molar concentration (1 2 x); (a) the lattice parameter a
and (b) the lattice parameter c. The lines are guides to the eye.
M. Sorescu et al. / Journal of Physics and Chemistry of Solids 65 (2004) 1021–10291026
the lattice substitutionally at Sn
4þ
site and specifically that
iron enters the lattice in its high spin ferric state
6
S
5/2
.In
SnO
2
each tin ion is octahedrally surrounded by six oxygen
ions at nearly equal distances. If an iron ion substitutes for a
tin ion, an axial distortion is formed because of the different
ionic radii and different ionic charge. This distortion is seen
in the Mo
¨
ssbauer spectra in a quadrupole splitting of given
amplitude. Considering the behavior of XRD spectra, as
well as the TEM and EDX data, the evolution of the central
quadrupole doublet versus tin content in these samples is an
argument for the crystallization of a SnO
2
-like structure in
the hydrothermally synthesized (1 2 x)a-Fe
2
O
3
–xSnO
2
nanoparticles.
The comparison of magnetic versus paramagnetic
phase (quadrupole doublet) in the nanoparticles system
Fig. 8.
57
Fe Mo
¨
ssbauer spectra of (1 2 x)a-Fe
2
O
3
–xSnO
2
samples at
different molar concentration x; (a) x ¼ 0:0; (b) x ¼ 0:08; (c) x ¼ 0:21; (d)
x ¼ 0:40; (e) x ¼ 0:70; and (f) x ¼ 0:86:
Fig. 9. Representative Mo
¨
ssbauer spectra (a, b, c) of the nanoparticle
system (1 2 x)a-Fe
2
O
3
–xSnO
2
fitted with hyperfine magnetic field
distribution together with the calculated magnetic hyperfine field
distribution probabilities (A, B, C); (a) x ¼ 0:08; (b) x ¼ 0:21; (c) x ¼ 0:31:
Fig. 10. Relative Mo
¨
ssbauer areas of magnetic and paramagnetic phases
versus molar concentration x; for (1 2 x)a-Fe
2
O
3
–xSnO
2
samples ðx ¼
0:0–0:9Þ:
Fig. 11. Scanning electron microscopy examination of (1 2 x)a-Fe
2
O
3
–
xSnO
2
system for x ¼ 0:4:
M. Sorescu et al. / Journal of Physics and Chemistry of Solids 65 (2004) 1021–1029 1027
(1 2 x)a-Fe
2
O
3
–xSnO
2
, as determined from Mo
¨
ssbauer
spectra, is represented in Fig. 10. From this graph we can
infer that the solubility of SnO
2
in a-Fe
2
O
3
is limited to
x , 0:2 in the nanoparticle system (1 2 x)a-Fe
2
O
3
–xSnO
2
synthesized under hydrothermal conditions which is in good
agreement with our XRD results. This value represents an
unexpectedly high solubility of SnO
2
in a-Fe
2
O
3
in
comparison with the thermodynamic equilibrium state of
only 1 mol% or less at 1073 K [9]. From our XRD and
Mo
¨
ssbauer data, the substitution of iron in the SnO
2
lattice,
crystallized under hydrothermal conditions, is clearly
possible for x $ 0:7; although the cassiterite phase contain-
ing iron is present as early as at x $ 0:21: These findings
agree with the solubility estimated in the reference [10],
where the a-Fe
2
O
3
–SnO
2
fine particle system was prepared
by thermal decomposition at 873 K, in the presence of a few
percent of (SO
4
)
22
. Figs. 11 and 12 show the particle
morphology and stoichiometry determined by SEM and
EDX examinations of the hematite-tin oxide system for x ¼
0:4: Our XRD, Mo
¨
ssbauer spectroscopy, TEM and EDX
investigations are consistent with a solubility of SnO
2
and a-
Fe
2
O
3
in each other over a wide composition range. A more
precise determination of solubility requires studies on
samples synthesized in smaller concentration steps. It is
possible that the solubility limits can be extended by
employing higher temperatures for the hydrothermal syn-
thesis or in the presence of some additives. Further syntheses
and studies are in progress.
4. Conclusions
The (1 2 x)a-Fe
2
O
3
–xSnO
2
nanoparticles system has
been obtained through a hydrothermal route under relatively
mild conditions of temperature and pressure (200 8C and
p , 15 atm). The mean particle diameter decreases from 70
to 6 nm as tin molar concentration increases up to x ¼ 1:0:
The Rietveld structure refinements of the XRD spectra at
low tin concentrations are consistent with the presence of
Sn
4þ
in a-Fe
2
O
3
structure in two different sites: substituting
for Fe
3þ
in octahedral sites ð0; 0; zÞ and occupying some
interstitial sites ð0; 0; 0Þ normally vacant in the hematite
structure. At greater Sn concentrations, a tetragonal SnO
2
structure crystallizes, where the Fe
3þ
ions partially
substitute for Sn
4þ
ions in the structure. The estimated
solubility limits in the nanoparticle system (1 2 x)a-
Fe
2
O
3
–xSnO
2
synthesized under the hydrothermal con-
ditions are: x # 0:2 for Sn
4þ
in the a-Fe
2
O
3
and x $ 0:7 for
Fe
3þ
in SnO
2
. This paper is the first report on the
hydrothermal synthesis and structural characterization of
(1 2 x)a-Fe
2
O
3
–xSnO
2
system over the full range of tin
concentration, from x ¼ 0:0 to 1.0. Moreover, this synthesis
route allowed us to reach the nanometric particle dimen-
sions, which would make them very attractive for sensing
applications.
Acknowledgements
This paper was prepared with the support of the U.S.
Department of Energy, under Award No. DE-FC26-
02NT41595. However, any opinions, findings, conclusions,
or recommendations expressed herein are those of the
authors and do not necessarily reflect the views of DOE.
The work in Bucharest, Romania, was sponsored by MEC
under the CERES Project No. 10/2002.
References
[1] W. Gopel, Sens. Actuators, B 18–19 (1994) 1.
[2] N. Yamazoe, N. Miura, Sens. Actuators, B 20 (1994) 95.
[3] J. Tamaki, C. Naruo, Y. Yamamoto, M. Matsuoka, Sens. Actuators, B
83 (2002) 190.
[4] J.Z. Jiang, R. Liu, S. Morup, K. Nielsen, F.W. Poulsen, F.J. Berry, R.
Clasen, Phys. Rev. B 55 (1997) 11.
[5] J.Z. Jiang, R. Liu, K. Nielsen, S. Morup, K. Dam-Johansen, R. Clasen,
J. Phys. D: Appl. Phys. 30 (1997) 1459.
[6] W. Zhu, O.K. Tan, J.Z. Jiang, J. Mater. Electron 9 (1998) 275.
[7] O.K.Tan, W. Zhu, Q. Yan, L.B. Kong, Sens. Actuators, B 65 (2000) 361.
[8] C.V. Gopal Reddy, W. Cao, O.K. Tan, W. Zhu, Sens. Actuators, B 81
(2002) 170.
Fig. 12. Energy dispersive X-ray analysis of (1 2 x)a-Fe
2
O
3
–xSnO
2
system for x ¼ 0:4:
M. Sorescu et al. / Journal of Physics and Chemistry of Solids 65 (2004) 1021–10291028
[9] J. Cassedanne, An. Acad. Bras. Cienc. 38 (1966) 265.
[10] H. Takano, Y. Bando, N. Nakanishi, M. Sakai, H. Okinaka, J. Solid
State Chem. 68 (1987) 153.
[11] F.J. Berry, C. Greaves, J.G. McManus, M. Mortimer, G. Oates, J. Solid
State Chem. 130 (1997) 272.
[12] F.J. Berry, A. Bohorquez, O. Helgason, J.Z. Jiang, J.G. McManus, E.
Moore, M. Mortimer, F. Mosselmans, S. Morup, J. Phys.: Condens.
Matter. 12 (2000) 4043.
[13] H.P. Klug, L.E. Alexander, X-ray Diffraction Procedures
for Polycrystalline and Amorphous Materials, Wiley, New York,
1966, 491.
[14] R.A. Young (Eds.), The Rietveld Method, Oxford University Press,
New York, 1993.
[15] N.N. Greenwood, T.C. Gibb, Mo
¨
ssbauer Spectroscopy, Chapman &
Hall, London, 1971, p. 241.
[16] R. Nakada, A. Ebina, T. Takahashi, J. Phys. Soc. Jpn 21 (1966) 188.
M. Sorescu et al. / Journal of Physics and Chemistry of Solids 65 (2004) 1021–1029 1029