- Trang chủ >>
- Khoa Học Tự Nhiên >>
- Vật lý
modeling of sensing and transduction for p - type semiconducting
Bạn đang xem bản rút gọn của tài liệu. Xem và tải ngay bản đầy đủ của tài liệu tại đây (675.54 KB, 9 trang )
Modeling of sensing and transduction for p-type semiconducting
metal oxide based gas sensors
N. Barsan & C. Simion & T. Heine & S. Pokhrel &
U. Weimar
Received: 6 February 2009 /Accepted: 3 June 2009 / Published online: 16 June 2009
#
Springer Science + Business Media, LLC 2009
Abstract The development of a quantitative model that
correlates conduction in and sensing with p-type gas
sensitive metal oxides is presented here. The theoretical
results are confronted with the experimental data and found
to be in very good agreement. The model also explains the
differences between the performance of gas sensors based
on n and p-type metal oxides and indicates the possible
improvement routes.
Keywords Chemical sensors
.
Conduction models
.
p-type
.
Metal oxide
.
Gas sensors
1 Introduction
Conductometric gas sensors based on semiconducting metal
oxides are actually one of the most investigated groups of
gas sensors because of their: low cost and flexibility
associated to their production; the simplicity of their use;
the large number of detectable gases/possible application
fields [1–4]. After it was discovered that there is an
electrical effect of the metal oxide-gas reaction—Heiland
[5], Bielanski et al. [6] and Se iyama et al. [7]—Taguchi
made the decisive step of bringing to the market semicon-
ducting metal oxide based sensors for flammable/explosive
gases detectors (SnO
2
based Taguchi-type sensors [8]). It
was a success and, nowadays, there are many companies
offering this type of sensors, such as Figaro, FIS, MICS,
UST, CityTech, AppliedSensors, NewCosmos, etc [9].
Their current applications span from “simple” explosive
or toxic gases alarms (see information provided by the gas
sensors manufacturers on their homepages) to air intake
control in cars [10] to components in complex chemical
sensor systems [11]. Most of the companies still use SnO
2
based sensing materials; also employed in commercial
applications are WO
3
,Ga
2
O
3
, which are n-type semi-
conductors, and Cr
2−x
Ti
y
O
3+z
, which is a p-type semicon-
ductor. In R&D the situation is somehow similar; any
survey of the contributions in the field of metal oxide based
sensors presented at the most recent major sensors confer-
ences (Eurosensors and International Meeting on Chemical
Sensors) will show that, by far, even after more than
30 years of commercial use, SnO
2
is still the most
investigated gas sensing material and CO, NO
2
and volatile
organic compounds (VOC) the main target gases. The
second most studied material is WO
3
while the other
industrially used materials are practically not investigated
anymore. Accordingly, most of the e xperimental and
theoretical knowledge was gained on SnO
2
[1, 2] and all
modelling of, e.g. sensing and transduction, is focused on
the n-type case [12]. Recently, [13], we investigated the
way in which surfa ce reactions-induced electrica l changes
are affecting the sensor signals of thick porous layers of
Cr
2
O
3
,ap-type materi al, by using simultaneous DC and
work function changes (Kelvin probe method) as well as
AC impedance spectroscopy measurements; on their basis
we developed a conduction model, which qualitatively
explains the experimental data. The most important finding,
the validity of which should apply to all p-type metal oxides
used as gas sensitive materials, is that the use of the sensing
layer resistance changes as sensor output downgrades the
sensor performance for that type of materials. The reason is
the way in which the conduction takes place that adds to the
measured gas sensitive resistance of the oxide’s surface
depleted layer the gas insensitive resistances of its bulk, in
J Electroceram (2010) 25:11–19
DOI 10.1007/s10832-009-9583-x
N. Barsan (*)
:
C. Simion
:
T. Heine
:
S. Pokhrel
:
U. Weimar
University Of Tuebingen,
Tübingen, Germany
e-mail:
parallel, and of the contact resistance between the semi-
conductor and the electrode, in series. In [13] we were not
able to quantitatively analyze the experimental data because
the modeling of conduction in gas sensitive p-type oxides
was not available. Here, we are proposing such a model and
we are using it in order to extract the relevant material
parameters.
2 Sensing and transduction
For semiconducting metal oxide based gas sensors the
cause of the change of sensor resistance (sensor signal) is
the transfer of free charge carriers (electrons or holes) from/
to the semiconductor to/from an adsorbed surface species.
Due to the fact that most gas sensing applications are taking
place in the ambient atmosphere, a very important role is
played by oxygen and water vapors. In a certain temper-
ature range, which depends on the specific metal oxide, the
adsorption of oxygen involves the trapping of electrons
from the semiconductor; the result will be a decrease of the
free charge carriers’ concentration (electrons) in the case of
n-type semiconductors — e.g. SnO
2
,In
2
O
3
,WO
3
—or an
increase of the free charge carri ers’ concentration (holes) in
the case of p-type semiconductors— e.g. Cr
2
O
3
, NiO, CoO.
There are cases in which the reaction with ambient oxygen
even changes the type of conduction at the surface of the
metal oxide [14].
It is generally thought that the reaction of reducing gases
with pre-adsorbed oxygen is responsible for the change in
resistance of the sensors and also that the presence of pre-
adsorbed water vapors-related species influences the reac-
tion. There is evidence that this is not the only way in
which reducing gases interact with the metal oxides [15],
but a more detailed discu ssion on the way in which the
surface reactions take place goes beyond the scope of this
contribution. Here, we want to devise a conduction model
that links the changes of the surface charge to the measured
resistance of the sensor. For doing so, we will consider that,
as already discussed in [13], the main effect of the exposure
to reducing gases is the decrease of the negative charge
trapped at the surface of the semiconductor in the form of
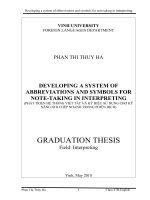
oxygen ions. Figure 1 middle, depicts what happens at the
surface of a p-type semiconducting metal oxide when
electrons from the valence band are captured on the surface
traps considered to be associated to the adsorption of
ambient oxygen as oxygen ions: one records an increase of
the concentration of holes in the vicinity of the surface—
build-up of an accumulation layer—described in the energy
bands representation as an upward band bending; as a
consequence, the electrical resistance of that layer decreases
in comparison with the flat bands situation (case depicted in
Fig. 1 Energy bands representation of the surface processes associ-
ated to the reaction with ambient oxygen and reducing gases: left, the
flat band situation prior to any surface reaction; center, the trapping of
electrons due to oxygen adsorption and the formation of the holes
accumulation layer; right, the decrease of the surface charge associated
to the decrease of adsorbed oxygen ions following the reaction with
the reducing gas. E
VAC
is the energy level of the electrons far away
from the semiconductor; E
C
is the minimum of the conduction band;
E
V
is the maximum of the valence band; E
A
is the energy level of the
intrinsic acceptors; Φ is the work function and χ is the electronic
affinity of the semiconductor
12 J Electroceram (2010) 25:11–19
Fig. 1 left). Figure 1 right describes the situation after the
exposure to reducing gases has decreased the concent ration
of oxygen ions: the decrease of the surface negative charge,
described in the energy bands representation as an
downward band bending (qΔV
S
¼ ΔΦ in the Figure),
determines a decrease of the hole concentration resulting
in the increase of the resistance of the accumulation layer.
As already demonstrated in [13], the sensor resistance will
be the result of the combination between the contributions
of the resistances of the surface accumulation layer, bulk
and contacts between the electrodes and the semiconductor.
The particula r manner in which those different contribu-
tions are combined depends on the morphology of the
sensitive layer; moreover, in the case of the experimental
results presented in [13] it was possible to identify the
contribution of the electrode-semiconductor contact as a
parallel (RC) element in the equivalent circuit that fits the
AC impedance spectra; its identification was made possible
by the fact that the values of the resistance and capacitance
do not change upon exposure to gases. This fact makes it
possible to extract out of the data the contribution of the
sensing layer and confront it with a conduction model.
To devise a conduction model we need to make some
assumptions that will simplify the calculations but also
capture all relevant contributions. We will examine a
system consisting of loosely aggregated grains in contact
with each other but not sintered together (absence of open
necks, as defined in [12]). A cartoon description of the
sensing layer is presented in Fig. 2. There, the morpholog-
ical features of the sensing layer are presented together with
their corresponding energy bands representations and the
corresponding contributions to the overall layer resistance.
The generic cont ributions of the metal-semiconduc tor
contacts are labeled with A and C, and the contribution of
the semiconductor grain -grain contacts is labeled with B.
The upper part of the figure provides more details on the
valence band accumulation layers, on the one hand,
determined by the upper band bending at the metal-
semiconductor contact due to the difference in work
function between the two materials, and, on the other hand,
Fig. 2 Cartoon representation
of the sensing layer: center,
simplified depiction of the
relevant sensing layer elements,
namely the metal-semiconductor
contacts (a and c) and the grain-
grain contacts (b). The energy
bands are constructed on the
basis of Fig. 1; upper part,
zoom-in into the relevant
contact regions; lower part,
equivalent DC circuit
J Electroceram (2010) 25:11–19 13
the upper band bending determined by the oxygen
adsorption at the ambient exposed grain surfaces. For
simplicity sake it was considered that the work function
of the meta l is higher; from the point of view of the
contribution to the overall sensing layer resistance, due to
the fact that the metal-semiconductor resistanc e does not
change under gas exposure [12, 13], it does not make any
difference if the opposite situation is encountered. In the
lower part of Fig. 2, the corresponding equivalent DC
circuit is sketched; it is important to recogni ze that we have
four types of contributions:
& The ones of the metal-semiconductor contact, which are
in series with all the others;
& The ones of the outer conductive and narrow accumu-
lation layers at the surface of the grains and of the
resistive but broad bulk of the grains. They are in
parallel to each other and in series with the metal-
semiconductors contribution and the
& Grain-grain contacts, which are putting together two
accumulation layer regions.
Such a system gives a good description for most state of
the art semiconducting MOX gas sensors that are based on
porous, thick films realized from pre-processed powders.
For a first step, we will consider that the building blocks
of the model are cubic metal oxide grains (grain size D, see
Fig. 3(a)) and we will not discuss the contribution of the
metal-semiconductor contacts. The grains consist of a
relatively (when compared to the grain size) thin conduc-
tive skin (thickness x
0
) and a more resistive bulk. In the
case of a grain fully contacted on two opposed faces, an
electrical current passing from one side to the opposite one
will experience three types of resistors (see Fig. 3(b)): R
1, 4
,
corresponding to the conductive regions of the cube’s
faces through which the current enters and leaves the
grain, R
2
, corresponding to the outer conductive layer and
R
3
, corresponding to the bulk. In fact, R
1, 4
represent the
contribution to the grain resistance of its contacts to the
other grains in the sensing layer and also the only regions
affected by the surface processes that the current is
obliged to pass through. After leaving those regions the
current can divide between the bulk and the surface and
the specific way in which this will happen and, as a
consequence, the degree to which the surface processes
influence the overall resistance, depends on both geom et-
rical characteristics of the grain (D), reactivity of the
surface and bulk properties (grouped together in x
0
). The
grain resistance, R,is(Fig.3(c)):
R ¼ R
1
þ
R
2
Á R
3
R
2
þ R
3
þ R
4
ð1Þ
One can easily calculate all contributions to grain
resistance, R, in the hypothesis that (D >> x
0
):
R
1
¼
1
q Á m Á
e
p
S
Á
x
0
D
2
¼ R
4
ð2Þ
R
2
¼
1
q Á m Á
e
p
S
Á
D À 2 Á x
0
D
2
À D À 2 Áx
0
ðÞ
2
%
1
q Á m Á
e
p
S
Á
1
4 Áx
0
ð3Þ
R
3
¼
1
q Á m Á p
B
Á
D À2 Á x
0
D À 2 Á x
0
ðÞ
2
%
1
q Á m Á p
B
Á
1
D
¼ R
B
ð4Þ
Fig. 3 Simplified model of the metal oxide grains, used for the calculation of the grain resistance: left, the cubic grain model; center, sketch of the
electrical connection between the different grain parts; right, the corresponding DC equivalent circuit of the grain
14 J Electroceram (2010) 25:11–19
The formulae above are obtained by considering that the
mobility,μ, is the same in all the grain and with
e
p
S
being the
average concentration of holes in the accumulation layer.
One can express all resistances as a function of R
B
:
R
1;4
¼ R
B
Á
p
B
e
p
S
Á
x
0
D
ð5Þ
R
2
¼ R
B
Á
p
B
e
p
S
Á
D
4 Á x
0
ð6Þ
And the result for the grain resistance is:
R ¼ R
B
Á
2 Á x
0
D
Á
p
B
e
p
S
þ
1
1 þ
4Áx
0
D
Á
e
p
S
p
B
0
@
1
A
ð7Þ
In Eq. 7, the first term in parenthesis represents the grain-
grain contact, which is a pure “surface”, in fact surface layer,
contribution and the second term describes the distribution of
the current between the bulk and the outer surface region of
the grain. The terms that describe the surface effects are
p
B
e
p
S
and x
0
. The way in which the surface affects the resistance is
determined by the value of the ratio
x
0
D
. Already in Eq. 7 one
can observe why the sensitivity of the p-type materials can
be very low even if the surface reactivity is very high; high
surface effects will mean a high increase of
e
p
S
in comparison
to p
B
. This will make the first term in Eq. 7 the pure
“surface” one, small in comparison with the second one and,
in this way, its weight in the grain resistance not significant.
In the second term, the importance of the surface will depend
strongly on both the geometric balance between x
0
and D
and the surface reactivity; for example, if one has a ratio
between grain size and accumulation layer depth of a factor
100, which is quite reasonable, we will need an increase of
the average surface concentration of holes of a factor 25 to
have a halving of the grain resistance.
Equation 7 can be corrected to take into account the fact
that the contact between grains is not between two faces, by
introducing an effective contact area size, D
C
, which can be
much smaller than the grain size (see Fig. 4) and of an
effective grain size, D
G
, which will include the numerical
factors (4 in Eq. 7) that are depending on the specific
geometry chosen for the modeling (spheres, cylinders,
cubes, etc). As a consequence, the geometry of the parallel
bulk-surface regions will also be modified from the simple
cube-like ones and that will change the numeric factors in
the second term of Eq. 7. We think that a good proposal for
the grain resistance and, in an effective medium approach,
for the sensing layer resistance is:
R ¼ R
B
Á
x
0
D
C
Á
p
B
e
p
S
þ
1
1 þ
x
0
D
G
Á
e
p
S
p
B
0
@
1
A
ð8Þ
It is possible to make explicit the dependence on the surface
band bending of the resistance and, by that, decouple the
geometric and surface effects. For that we need to calculate
e
p
S
. In the case D >> x
0
, one treats the situation in a planar
and semi-infinite manner (one-dimensional problem) and
we can write:
e
p
S
¼
1
x
0
Z
x
0
0
pðxÞdx ¼
1
x
0
Z
x
0
0
p
b
exp
qV
kT
dx ð9Þ
Fig. 4 Sketch of the conduction
models used in the theoretical
modeling: upper part, the actual
sensing layer; center, the
approximation of cubic grains in
full contact; lower part, the
approximation of cubic grains
partly in contact
J Electroceram (2010) 25:11–19 15
In Eq. 9 the assumption of the Fermi energy still far away
from the valenc e band edge was made in order to be
allowed to use the Boltzmann distribution. In order to
proceed with the integration we need to:
& change the variable from x to V
e
p
S
¼
p
B
x
0
Z
0
V
S
exp
qV
kT
dV
dx
dV ð10Þ
& use the results of the first analytical integration of the
Poisson’s equation for a p-type semiconductor [16]
dV
dx
¼Æ
2kT Á p
b
""
0
1=2
exp
qV
kT
À
qV
kT
À 1
1=2
ð11Þ
to express everything as a function of the potential V. The
integral is now:
e
p
S
¼Æ
p
b
x
0
Z
0
V
S
exp
qV
kT
2kTÁp
b
""
0
hi
1=2
exp
qV
kT
À
qV
kT
À 1
1=2
dV ð12Þ
By subtracting p
b
from both sides of Eq. 12
e
p
S
À p
b
¼Æ
p
b
x
0
R
0
V
S
exp
qV
kT
ðÞ
2kTÁp
b
""
0
hi
1=2
exp
qV
kT
ðÞ
À
qV
kT
À1
½
1=2
dV À
1
x
0
R
x
0
0
p
b
dx ¼
¼Æ
p
b
x
0
""
2kTÁp
b
hi
1=2
R
0
V
S
exp
qV
kT
ðÞ
À1
½
dV
exp
qV
kT
ðÞ
À
qV
kT
À1
½
1=2
ð13Þ
and by observing that, similarly to the approach used in
[17]
d
dV
exp
qV
kT
À
qV
kT
À 1
¼
q
kT
Á exp
qV
kT
À 1
ð14Þ
one finally obtains for
e
p
S
:
e
p
S
¼ p
b
Á
L
D
x
0
ffiffiffi
2
p
Á exp
qV
S
kT
À
qV
S
kT
À 1
1=2
þ1
()
ð15Þ
where L
D
is the Debye length, a measure of the screening of
the bulk from the surface effects [16] and having values
close to the ones of x
0
, defined as:
L
D
¼
ffiffiffiffiffiffiffiffiffiffiffiffiffi
""
0
kT
q
2
p
b
s
ð16Þ
One can further simplify Eq. (15) by observing that, as
shown in Fig. 5 and keeping in mind that
L
D
x
0
ffiffiffi
2
p
% 1, one
can make the approximation
L
D
x
0
ffiffiffi
2
p
Á exp
qV
S
kT
À
qV
S
kT
À 1
1=2
þ1
()
%
L
D
x
0
ffiffiffi
2
p
exp
qVs
2kT
ð17Þ
for all values of V
S
.
By using (8), (15) and (17) one obtains for the sensor
layer resistance:
R ¼ R
B
Á
L
D
D
C
Á exp À
qV
S
2kT
þ
1
1 þ
L
D
D
G
Á exp
qVs
2kT
!
ð18Þ
Equation 18 is having the advantage that it decouples the
surface effects (V
S
) from the bulk/materi al properties (L
D
)
and morphology (D
C
and D
G
). It also captures all important
parameters that con trol th e depe nde nce of the sensor
resistance on the ambient atmosphere composition and
clearly shows that the effect of what happens at the surface
(changes of band bending V
S
) will be felt quite differently
for different materials and, for the same materials, different
sensing layer morphologies. Some examples are provided
in Fig. 6 and 7, where the effect of the geometrical/
morphological parameters (L
D
/D
C
and L
D
/D) is examined
in the hypothesis of a large variation of band bending. One
can see that the most important effect, highest effect of
band bending on layer resistance, comes from the grain size
reduction.
0.01 0.1 1 10
10
0
10
1
10
2
p
S
/p
b
qV
S
/kT
exact solution
approximation
Fig. 5 The dependencies of the normalized surface average hole
concentration on band bending for the exact solution (Eq. 15) and the
approximate one (Eq. 17)
16 J Electroceram (2010) 25:11–19
In the case of n-type materials, for a similar layer
morphology the term that will dominate the resistance is
equivalent of the first term in the brackets of Eq. 18, which
provides t he large series resistance proportional to
exp
qV
S
kT
[12]. By having the dominant resistive term being
the one that depends most strongly on the surface effects,
the n-type materials will show better gas responses than the
p-type ones, provi ded that the surface reactivity and layer
morphology are comparable.
3 Discussion
It is interesting to see how good the model proposed by
Eq. 18 is by applying it to the results obtained with real
sensors. In [13], on the one hand, we performed AC sensor
impedance measurements and, on the other hand, we
performed simultaneous work function changes and DC
sensor resistance measurements. From the former, we have
been able to identify and subtract the resistance of the
electrode-metal oxide contact; from the latter, we are able to
correlate the sensor layer signal—expressed as the ratio
between the resistance of the sensor in the presence of
ethanol vapors and the resistance of the sensor in air—and
the changes in the band bending. According to (18) the
sensor signal S is:
S ¼
R
gas
R
air
¼
L
D
D
C
Á exp À
qV
gas
2kT
þ
1
1þ
L
D
D
G
Áexp
qV
gas
2kT
ðÞ
L
D
D
C
Á exp À
qV
air
2kT
þ
1
1þ
L
D
D
G
Áexp
qV
air
2kT
ðÞ
ð19Þ
The measured work function change upon ethanol vapours
exposure is:
ΔΦ ¼ qV
air
À qV
gas
) qV
gas
¼ qV
air
À ΔΦ ð20Þ
so Eq. 19 becomes
S ¼
R
gas
R
air
¼
L
D
D
C
Á exp À
qV
air
2kT
Á exp
ΔΦ
2kT
þ
1
1þ
L
D
D
G
Áexp
qV
air
2kT
ðÞ
Áexp À
ΔΦ
2kT
ðÞ
L
D
D
C
Á exp À
qV
air
2kT
þ
1
1þ
L
D
D
G
Áexp
qV
air
2kT
ðÞ
ð21Þ
With obvious notations, Eq. 21 can be re-written as:
S ¼
R
gas
R
air
¼
t
1
Á exp
ΔΦ
2kT
þ
1
1þt
2
Á
1
exp
ΔΦ
2kT
ðÞ
t
1
þ
1
1þt
2
ð22Þ
-101234567891011
10
-1
10
0
R/R
0
qV
S
/kT
D
C
=L
D
D
C
=10L
D
D
C
=20L
D
D
G
=100L
D
Fig. 6 Influence of the contact size over the sensor response at
constant grain size
-101234567891011
10
-1
10
0
D
G
=100L
D
D
G
=50L
D
D
G
=20L
D
D
C
=L
D
R/R
0
qV
S
/kT
Fig. 7 Influence of the grain size over the sensor response at constant
contact size
0.00 0.05 0.10 0.15 0.20 0.25 0.30
1.0
1.1
1.2
1.3
1.4
1.5
1.6
1.7
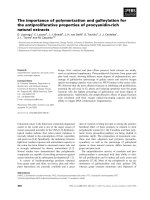
Fit
Experimental points
Sensor signal S
Potential changes (eV)
Δ
Fig. 8 Dependence of the sensor signal on band bending; experi-
mental results and fitting with the formula described by Eq. 22
J Electroceram (2010) 25:11–19 17
The experimental results of the sensor signal dependence on
the work function changes are presented in Fig. 8 together
with the curve obtained by fitting the data with Eq. 22;the
values obtained for the fit parameters are: t
1
=0.00762 and
t
2
=0.47669. To get a feeling about the meaningfulness of the
fit parameters we need to make some assumptions; because
during ethanol exposure the work function changes were
close to 300 meV without recording saturation, we know that
the minimal initial bend bending (qV
air
)shouldbeatleast
300 meV. In this case w e will obtain for the bulk/
morphological parameters (L
D
/D
C
and L
D
/D
G
):
L
D
D
C
¼ 0:14
L
D
D
G
¼ 0:02
Keeping in mind the fact that the average grain size is around
500 nm, we are obtaining for the Debye length a value of
around 14 nm—corresponding to a p
b
value of around 1.4×
10
23
m
−3
, see Eq. 16—and for the size of the grain-grain
contact a value of around 100 nm (one fifth of the value of
the grain size); the obtained values look reasonable for a
semiconducting metal oxide. There are not too many
possibilities to compare the values resulting from the fit to
directly experimentally determined ones; the values we
found in literature for p
b
, in a comparable temperature range
(280°C) [18]forthecaseofCr
2
O
3
with induced non-
stoichiometry, are around 10
26
m
−3
, which would correspond
to a value of the initial band bending of about 700 meV; the
later value is also reasonable, even if a bit high. Anyways,
the values given in [18] seem to be pretty high and in order
to match them with the measured conductivity values the
author assumes an extremely low value of hole mobility, 3 to
5×10
−5
cm
2
/V s, in full contradiction to the values found by
Hauffe and Block [19], namely 0.76 cm
2
/V s at a much
higher temperature (600°C). On the basis of the information
available in the literature it seems reasonable to assume that
the in itial band bending values are between 300 and
600 meV. For the latter case, the value of the Debye length
is around 0.8 nm—corresponding to a p
b
value of around 4×
10
25
m
−3
—and the value of the size of the grain-grain
contact a value of around 6 nm (a bit more than one
hundredth of the value of the grain size). Figure 9 and 10
present the hypothetical cases in which the grain size (D
G
)
Fig. 9 Simulation of the impact
of grain and contact size on the
sensor response for a sensitive
material that has an initial band
bending of 300 meV
Fig. 10 Simulation of the
impact of grain and contact size
on the sensor response for a
sensitive material that has an
initial band bending of 600 meV
18 J Electroceram (2010) 25:11–19
and morphology (D
C
) of two materials, which are having the
bulk properties (L
D
) of the two extreme cases considered
above, are changed. One can observe that for high effects
one needs materials that: are highly reactive to oxygen (high
initial band bending); have high concentrations of free
charge carriers (low L
D
value) and low grain sizes. The
effect of morphology, L
D
/D
C
, is limited in those cases (see
Fig. 10). On the opposite, in the case of materials with not so
high oxygen reactivity and lower concentration of free
charge carriers, the effects of grain size and morphology
are comparable (see Fig. 9). In the case of n-type materials,
the grain size influence over the sensor signal will be limited
because the contribution of the non-sensitive part of the
grains, the bulk, is limited by its lack of influence in the
overall layer resistance (low series resistance) (Fig. 1).
The conduction model developed here has some limi-
tations imposed by the conditions in which it is possible to
obtain an analytical solution, mainly D
G
>> L
D
. This fact
limits its applicability to “large” grains and excludes the
analysis of “fully” enriched materials. The elaboration of a
more comprehensive model is currently undert aken.
4 Conclusion
A conduction model valid for p-type gas sensitive metal
oxides with large grain sizes, when compared to the Debye
length, was developed and found to be in good agreement
with the experimental results. It provides a quanti tative
explanation for the low sensor signals of those materials in
spite of their high surface reactivity and guidance on how to
attempt the improvement of the sensor performance. It also
explains the origin of the differences between n and p-type
gas sensitive metal oxides. The boundary conditions in
which the conduction model was devised are limiting its
applicability and asking for its extension towards materials
whose grains are fully influenced by surface reactions.
References
1. D.E. Williams, Semiconducting oxides as gas-sensitive resistors.
Sens. Actuators B Chem. 57,1–16 (1999). doi:10.1016/S0925-
4005(99) 00133-1
2. N. Barsan, M. Schweizer-Berberich, W. Gopel, Fundamental and
practical aspects in the design of nanoscaled SnO2 gas sensors. A
status report, Fresenius’. J. Anal. Chem. 365, 287–304 (1999).
doi:10.1007/s002160051490
3. G. Korotcenkov, Gas response control through structural and
chemical modifications of metal oxide films: state of the art and
approaches. Sens. Actuators, B 107, 209–232 (2005)
4. K. Ihokura and W. J., The stannic oxide gas sensor: principle and
application. (CRC, 1994)
5. G. Heiland, Zum Einfluss von Wasserstoff auf die elektrische
Leitfähigkeit von ZnO-Kristallen. Z. Phys. 138, 459–464 (1954).
doi:10.1007/BF01340692
6. A. Bielanski, J. D eren, J. Haber, Electric conductivity and
catalytic activity of semiconducting oxide catalysts. Nature 179,
668–669 (1957). doi:10.1038/179668a0
7. T. Seiyama, A. Kato, K. Fujiishi, M. Nagatani, A new detector for
gaseous components using semiconductive thin films. Anal.
Chem. 34, 1502f (1962). doi:10.1021/ac60191a001
8. N. Taguchi, in U.S.Patent. 3,631,436, 1971
9. , , http://www.
appliedsensors.com, , ro
chem.com
10. J. Marek, H P. Trah, Y. Suzuki, I. Yo komori, Sensors for
automotive technology (Weinheim, VCH Weinheim, 2003)
11. T.C. Pearce, S.S. Schiffman, H. Troy Nagle, G.J.W., Hand-
book of machine olfaction: electronic nose technology. (Wiley,
2003)
12. N. Barsan, U. Weimar, Conduction model of metal oxide gas
sensors. J. Electroceram. 7(3), 143–167 (2001). doi:10.1023/
A:1014405811371
13. S. Pokhrel, C.E. Simion, V. Quemener, N. Bârsan, U.
Weimar, Investigations of conducti on mechanism in Cr
2
O
3
gas sensing thick films by ac impedance spectroscopy and work
function changes measurements. Sens. Actuators, B 13 3(1), 78–
83 (2008)
14. A. Gurlo, N. Barsan, A. Oprea, M. Sahm, T. Sahm, U. Weimar, A
n- to p- type conductivity transition induced by oxygen adsorption
on α-Fe2O3. Appl. Phys. Lett. 85(12), 2280 –2281 (2004).
doi:10.1063/1.1794853
15. N. Barsan, D. Koziej, U. Weimar, Metal oxide based gas sensor
research: how to? Special Issue, 25th Anniversary of Sensors and
Actuators B: Chemical, E. Bakker, M. Egashira, M. Koudelka-
Hep, R. Narayanaswany (Eds.). Sensors and Actuators B 121,
18–35 (2007)
16. S.R. Morrison, The Chemical Physics of Surfaces (Plenum, New
York, 1977). ISBN 0-306-30960-2, Sec. 2.2
17. N. Bârsan, R. Ionescu, The mechanism of interaction between CO
and SnO2 surface—the role of water vapour. Sens. Actuators, B
12(1), 71–75 (1993)
18. L.N. Cojocaru, Electrical properties of non-stoichiometric Cr
2
O
3
.
Z. physic. Chem. Neue Folg 64(5/6), 255–262 (1969)
19. K. Hauffe, J. Block, Defective array model of an intrinsic-
impurities semiconductor, Cr
2
O
3
. Z. Phys. Chem. 198(5/6), 232–
247 (1951)
J Electroceram (2010) 25:11–19 19