- Trang chủ >>
- Khoa Học Tự Nhiên >>
- Vật lý
preparation of fe2o3 submicro - flowers by a hydrothermal approach
Bạn đang xem bản rút gọn của tài liệu. Xem và tải ngay bản đầy đủ của tài liệu tại đây (618.6 KB, 6 trang )
A
vailable online at www.sciencedirect.com
Electrochimica Acta 53 (2008) 4213–4218
Preparation of ␣-Fe
2
O
3
submicro-flowers by a hydrothermal approach
and their electrochemical performance in lithium-ion batteries
Yanna NuLi
a,b
, Peng Zhang
a
, Zaiping Guo
a,∗
, P. Munroe
c
, Huakun Liu
a
a
Institute for Superconducting and Electronic Materials, University of Wollongong, Wollongong, NSW 2522, Australia
b
Department of Chemical Engineering, Shanghai Jiao Tong University, Shanghai 200240, PR China
c
Electron Microscopy Unit, University of New South Wales, Kensington, NSW 2052, Australia
Received 21 September 2007; received in revised form 3 December 2007; accepted 24 December 2007
Available online 6 January 2008
Abstract
Uniform ␣-Fe
2
O
3
submicron-sized flowers have been synthesized by a simple hydrothermal process conducted at 160
◦
C for 24 h. The crystalline
structure and morphology of the as-synthesized powder have been characterized by using X-ray powder diffraction (XRD), scanning electron
microscopy (SEM), and field emission scanning electron microscopy (FE-SEM). The results revealed that the highly crystalline ␣-Fe
2
O
3
submicro-
flowers were composed of nanospheres with an average size of 20–30 nm. The electrochemical performance as anode material for lithium-ion
batteries was further evaluated by cyclic voltammetry (CV) and by electrochemical impedance and charge–discharge measurements. It was
demonstrated that the material could provide an initial reversible capacity of 959.6 mAh/g at a current density of 20 mA/g over the voltage range
from 0.01 to 3.0 V. The capacity retention upon the 50th cycle was 44.4 and 35.9% at 60 and 100 mA/g, respectively. The superior electrochemical
performance may be resulted from the high surface area and the small and uniform grain size.
© 2008 Elsevier Ltd. All rights reserved.
Keywords: Iron oxide; Hydrothermal method; Submicro-flowers; Anode materials; Lithium-ion batteries
1. Introduction
Among the various methods for the preparation of oxide pow-
ders, such as the sol–gel process [1], solid-state transformation
[2], chemical vapour deposition [3], physical vapour deposition
[4], spray pyrolysis [5], microwave-induced hydrolysis [6], and
emulsion [7] and hydrothermal processes [8], the hydrothermal
technique occupies a unique place, owing to its advantages over
conventional technologies. Various crystalline powders with
high purity, phase homogeneity, controlled morphology, narrow
particle size distribution, little or no macroscopic agglomeration,
and excellent reproducibility can be produced by this technique,
due to a combination of simple equipment with easy sintering
and less time consumption than in other methods [9,10].
As the most stable iron oxide, hematite (␣-Fe
2
O
3
) has been
extensively used in the production of pigments, catalysts, gas
∗
Corresponding author. Tel.: +61 2 4221 5225; fax: +61 2 4221 5731.
E-mail address: (Z. Guo).
sensors, and raw materials for hard and soft magnets, due to
its low cost, environmental friendliness, and high resistance to
corrosion [11]. Furthermore, it has also been shown to act as
a rechargeable electrode material that reacts with six Li per
formula unit, exhibiting higher capacity than the carbonaceous
substances (e.g. maximum of 372 mAh/g for graphite) that are
used currently in commercial lithium-ion batteries [12].Ithas
been considered that most of these functions depend strongly on
the structure and particle size of the materials, and nano-␣-Fe
2
O
3
exhibits better electrochemical performance than micro-sized
samples [13].
It is evident that the purpose of preparing ␣-Fe
2
O
3
in
various sizes and shapes has been driven by the strong inter-
est in their novel properties and potential applications [14].
Several methods have been successfully developed for fabri-
cation of hematite nanoparticles, such as the sol–gel process,
template methods, chemical precipitation, the microemulsion
technique, the gas–solid reaction technique, the forced hydroly-
sis method, and the hydrothermal approach [15–24].Inviewof
the homogeneous nucleation and grain growth, the hydrother-
0013-4686/$ – see front matter © 2008 Elsevier Ltd. All rights reserved.
doi:10.1016/j.electacta.2007.12.067
4214 Y. NuLi et al. / Electrochimica Acta 53 (2008) 4213–4218
mal method shows advantages over conventional methods. It
has been reported that hydrothermal reactions involving an
aqueous iron nitrate solution over a wide concentration range
produce porous hematite nanocrystals (40–80 nm) containing
non-intersecting 5–20 nm pores [25]. Single-phase hematite can
be formed in ferric chloride hydrothermal systems when the fer-
ric concentration is kept as low as 0.02–0.04 M [26]. It is clear
that nanocrystals can be obtained by adjusting the hydrother-
mal conditions, but nanocrystals formed in this manner tend to
agglomerate. Zhao et al. have successfully synthesized monodis-
perse ␣-Fe
2
O
3
nanoparticles with different particle sizes by a
hydrothermal method [27]. ␣-Fe
2
O
3
nanotubes and nanorods
have also been selectively synthesized through a hydrothermal
method using Span80 or L113B as a soft template [17]. Wan et
al. have proposed a soft-template-assisted hydrothermal route
to prepare single crystal nanorods with an average diameter
of 25 nm and length of 200 nm at 120
◦
Cin20h[24].Sev-
eral workers have prepared nanoparticles using both aqueous
and non-aqueous solvents, with or without surfactants, under
hydrothermal conditions. The experimental temperature ranges
from 180 to 250
◦
C in most of the cases, and the typical size of
the products varies from 20 to 200 nm [28–30]. It has been shown
that the preparation conditions, such as concentration, reaction
temperature, and time, are the main factors in determining the
morphologies and structures of the ␣-Fe
2
O
3
nanocrystals pre-
pared under hydrothermal conditions. Nevertheless, developing
the hydrothermal method for the preparation of ␣-Fe
2
O
3
nano-
materials, as well as the modification of their size, morphology,
and porosity, has been intensively pursued, not only for their
fundamental scientific interest, but also for many technological
applications.
Herein, we describe an easy route to synthesize ␣-Fe
2
O
3
submicro-flowers via a low-temperature hydrothermal method
and their study as attractive material for lithium-ion batteries.
Poly(ethylene glycol) with an average molecular weight of 600
was employed as a soft template. PEG is a typical non-toxic,
non-immunogenic, non-antigenic, and protein-resistant poly-
mer reagent with long polymer chains [31], which was used
here as a coordination and linking reactant, a stabilizer, and a
structure-directing agent. The electrochemical properties of the
␣-Fe
2
O
3
submicro-flowers as anode material for lithium-ion
batteries were investigated using cyclic voltammetry, electro-
chemical impedance, and galvanostatic methods. It was found
that as-prepared submicro-flowers, characterized by uniform
size and shape with a high specific surface area, exhibited supe-
rior electrochemical activity, with an initial discharge capacity
of 905.7 mAh/g and reversible capacity retention of 35.9% after
50 cycles at 100 mA/g at ambient temperature.
2. Experimental
2.1. Preparation of α-Fe
2
O
3
submicro-flowers
All the chemical reagents were analytically pure and used
without further purification. The ␣-Fe
2
O
3
submicro-flowers
were prepared by a PEG-precursor route. In a typical experimen-
tal procedure, PEG-600 (Aldrich) was dissolved in methanol to
form a 1 M solution. A 1 M aqueous solution of FeCl
3
(BDH
Laboratory Supplies, England) with equivalent molar number to
the PEG-600 was added dropwise under continuous stirring at
room temperature to obtain a homogeneous solution. The solu-
tion was kept at 50
◦
C for 12 h to form crystals, which were
collected as the precursor. A stoichiometric proportion of the
precursor and NaOH (4 M) were added under stirring to a 15 mL
Teflon-lined autoclave, which was filled to one-third by volume.
The autoclave was sealed and heated to 160
◦
C, then held at
that temperature for 24 h. After the reaction, the autoclave was
cooled down naturally. The resulting product was separated and
collected by centrifugation, washed with ethanol and distilled
water to ensure total removal of the inorganic ions, and then
dried under vacuum at 80
◦
C for 4 h.
2.2. Sample characterizations
X-ray powder diffraction analysis was conducted on a
Philips 1730 X-ray diffractometer (XRD) using Cu K␣ radi-
ation (λ = 1.54056
˚
A), with 2θ ranging from 20
◦
to 80
◦
,to
analyse the structure of the expected product. Both a JEOL
JSM 6460A scanning electron microscope (SEM) and a Hitachi
S4500 field emission scanning electron microscope (FE-SEM)
were employed to examine the morphology of the sample.
Electrodes were prepared by drying a slurry (composed of
70 wt.% active material, 15 wt.% carbon black, and 15 wt.%
polyvinylidene fluoride dissolved in N-methyl-2-pyrrolidinone)
on a copper foil (1 cm
2
)at100
◦
C for 4 h under vacuum. It was
compressed at a rate of about 150 kg/cm
2
, and then weighed. The
electrochemical behaviour of the test material was examined via
CR2025 coin cells with a lithium metal counter electrode, Cel-
gard 2700 membrane separator, and an electrolyte consisting of
1 M LiPF
6
dissolved in a mixture of ethylene carbonate (EC)
and dimethyl carbonate (DMC) (1:1 in weight ratio). The cells
were assembled in an argon-filled glove box (Mbraun, Unilab,
Germany).
The charge (delithiation)–discharge (delithiation) mea-
surements were carried out at ambient temperature on a
multi-channel battery cycler at different current densities in the
range of 20–100 mA/g, with voltage cut-offs of 0.01 and 3.0 V.
Cyclic voltammetry (CV) and electrochemical impedance mea-
surements were obtained using a CHI instrument. The scanning
rate for CV was 0.1 mV/s, and the amplitude of the alternating
voltage signal in impedance measurements was 5 mV over the
frequency range between 10
5
and 0.1 Hz. The electrochemical
impedance measurements were performed at the open-circuit
voltage (OCV) before and after the CV experiments.
3. Results and discussion
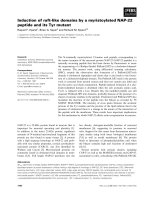
Fig. 1 shows the X-ray diffraction pattern of as-synthesized
powder prepared using the hydrothermal method. As observed,
the positions of the characteristic peaks of the product are consis-
tent with the standard values for the hexagonal ␣-Fe
2
O
3
phase
(JCPDS number 33-0664), suggesting that there are no other
compounds present in the final product. The sharp peaks confirm
the high crystallinity of the product.
Y. NuLi et al. / Electrochimica Acta 53 (2008) 4213–4218 4215
Fig. 1. XRD pattern of the as-prepared ␣-Fe
2
O
3
sample.
By using Scherrer’s equation [32], D = kλ/β cos θ, where λ
is the X-ray wavelength, β the half-peak width, θ the Bragg
angle in degrees, and k is the shape factor (often assigned a
value of 0.89), the primary crystal shape of the hematite can
be estimated from different crystallographic directions [33].It
has been reported that a large intensity difference for diffraction
peaks (1 0 4) and (1 1 0) could indicate that the particles have an
ellipsoidal shape, while comparable intensities for both peaks
are related to a spherical shape. No large intensity differences
were observed for these peaks in this work. The crystal sizes of
the sample as evaluated by the Scherrer’s equation from several
typical peaks, (1 0 4), (1 1 0), (0 2 4), and (1 1 6), are shown in
Table 1. It can be seen that the crystal sizes along these four crys-
tallographic directions were similar, indicating that the crystals
in the sample are close to spherical in shape.
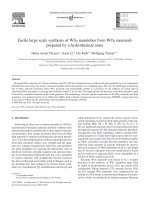
Fig. 2(a) and (b) shows SEM images of the as-prepared sam-
ple at different magnifications. Fig. 2(a) is a low-magnification
view of the product, showing that the sample is composed of uni-
form spheres with an average diameter of about 200 nm.Fig. 2(b)
contains a SEM image at a higher magnification, from which it
can be seen that there are some features on the surface of every
sphere. The micro-structure of the sample was further investi-
gated by FE-SEM, and typical images are presented in Fig. 2(c)
and (d). It can be seen that the particles are actually flower-like
structures composed of nanospheres 20–30 nm in size, which is
consistent with the results from XRD, indicating that the product
could possess a high surface area.
Fig. 3 shows cyclic voltammograms of electrode made from
the as-prepared sample. It can be seen that there is a substantial
difference between the first and the subsequent cycles. In the
first cycle, a spiky peak appears at about 0.4 V in the cathodic
process, which can be associated with the irreversible reduction
reaction of electrolyte and the reversible conversion reaction of
Table 1
The crystal sizes along four crystallographic directions for the ␣-Fe
2
O
3
sample
D
(104)
(nm) 24.25
D
(110)
(nm) 29.90
D
(024)
(nm) 19.83
D
(116)
(nm) 22.50
Fig. 2. SEM images (a) and (b) and FE-SEM images (c) and (d) of the as-prepared ␣-Fe
2
O
3
sample.
4216 Y. NuLi et al. / Electrochimica Acta 53 (2008) 4213–4218
Fig. 3. Cyclic voltammograms of the ␣-Fe
2
O
3
electrode at a sweep rate of
0.1 mV/s.
Fe
2
O
3
with metallic lithium into amorphous Li
2
O and metal-
lic iron [12]. Meanwhile, an anodic peak is recorded at about
1.8 V, corresponding to the reversible oxidation of Fe
0
to Fe
3+
.
In the subsequent cycles, the peak potentials shift to 0.7 and
1.85 V, respectively. The peak intensity gradually decreases dur-
ing the first four cycles, and then remains almost steady, showing
the reversible reduction and oxidation of the material, which
suffered some irreversible capacity loss in the first few cycles.
Fig. 4 presents typical Nyquist plots obtained before and
after the CV experiments on the same electrode. The plots are
similar to each other in shape, with a semicircle appearing in
the high frequency domain and a straight line in the low fre-
quency region. Before the CV experiments, the semicircle is
about 220 cm
2
in terms of resistance. The semicircle become
smaller, and the resistance value decreases to about 180 cm
2
after the CV experiments, suggesting an easier reaction pro-
cess after several CV cycles. The electrode could then possess
higher reactivity and lower polarization. On the other hand, the
changes in impedance are also related to the component modi-
fications of the electrode. After CV cycling, the electrolyte can
soak into the particles of the electrode, and the pristine Fe
2
O
3
changes into lower oxidation state iron oxides and Li
2
O, so some
irreversibility should also be taken into account.
Fig. 4. Electrochemical impedance results on the ␣-Fe
2
O
3
electrode obtained
before and after CV measurements.
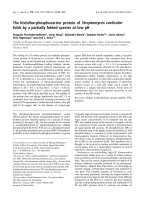
Fig. 5. The first and secondcharge–discharge curves of the ␣-Fe
2
O
3
electrode at
different current densities: (a) 20 mA/g, (b) 40 mA/g, (c) 60 mA/g, (d) 80 mA/g,
and (e) 100 mA/g.
Fig. 5 shows the charge–discharge curves of the electrode in
the first and second cycles at different current densities. Com-
pared with the charge process, the differences in the voltage
trends for the discharge are more obvious at every current den-
sity. In the discharge curves of the first cycle, there is an obvious
potential plateau at 0.9–0.8 V, which decreases to 0.4–0.3 V with
increasing current density, followed by a gradual decrease in
the potential down to 0.01 V. For the second cycle, the voltage
increases, and the amplitude of the plateau is markedly reduced,
so that only a discharge slope is observed, with a decrease in
the discharge capacity. The initial discharge capacities of the
material are 1248.1, 1225.7, 1171.1, 1020.7 and 905.8 mAh/g,
and the initial coulombic efficiencies are 75.9%, 75.3%, 74.7%,
73.8% and 72.7% at current densities of 20, 40, 60, 80 and
100 mA/g, respectively. The corresponding reversible discharge
capacities are 959.6, 939.7, 883.2, 751.3 and 669.8 mAh/g. It
can be seen that not only the discharge capacity, but also the
coulombic efficiency, decreases with increasing current density,
which apparently results from the higher polarization at a larger
current density.
Fig. 6 presents the cycling behaviour of the ␣-Fe
2
O
3
electrode
measured at different current densities. It can be seen that 46.9%
of the reversible capacity can be maintained over 50 cycles at
40 mA/g, and the electrode exhibits 35.9% capacity retention
Y. NuLi et al. / Electrochimica Acta 53 (2008) 4213–4218 4217
Table 2
Comparison of the electrochemical properties of ␣-Fe
2
O
3
submicro-flower electrodes fabricated in this work with those of ␣-Fe
2
O
3
with different particle sizes
reported in literatures
Samples Current density Potential range
(V vs. Li/Li
+
)
Initial capacity
(mAh/g)
Initial
coulombic
efficiency (%)
Capacity
retention after
50 cycles
References
␣-Fe
2
O
3
submicro-flowers
20 mA/g
3.0–0.01
1248.1 75.9 52.1% This work
40 mA/g 1225.7 75.3 46.9%
60 mA/g 1171.1 74.7 44.4%
80 mA/g 1020.7 73.8 41.2%
100 mA/g 905.8 72.7 35.9%
Nanometric (20 nm) ␣-Fe
2
O
3
C/5 Discharge to 0 V 1400 – – [12,13]
Micrometric (0.5 m) ␣-Fe
2
O
3
C/5 Discharge to 0 V 1200 – – [12,13]
Micrometric ␣-Fe
2
O
3
0.5 mA/cm
2
3.0–0.5 1000 70 Very poor [34]
Fig. 6. The discharge capacity vs. cycle number curves of the ␣-Fe
2
O
3
electrode
at different current densities.
up to 50 cycles at a current density as high as 100 mA/g. For
comparison purpose, the electrochemical properties of the ␣-
Fe
2
O
3
submicro-flowers fabricated in this work and those of
␣-Fe
2
O
3
with different particle sizes reported in literatures are
summarized in Table 2. It can be found that the effect of particle
size on the electrochemical performance of ␣-Fe
2
O
3
. Although
the ␣-Fe
2
O
3
submicro-flower electrode has slightly lower ini-
tial capacity compared with the nano-sized sample, the capacity
retention of the ␣-Fe
2
O
3
submicro-flowers prepared in this work
are better than that of micrometric sample. It is well known that
a large surface area is important for the improvement of reac-
tion performance, considering the introduction of lithium ions
into the holes of the hematite surface. The capacity and affinity
will be greatly enhanced when the surface area is high, since
the diffusion lengths of the lithium ions are greatly shortened
[35]. Moreover, the volume variation of nanometer particles is
much smaller than large size particles during charge–discharge
cycles, and nanometer materials often have higher plasticity and
deformability. Those factors may take effect to avoid the crack
and pulverization of the electrode [36]. It is reasonable to believe
that the excellent performance of the ␣-Fe
2
O
3
submicro-flowers,
which are apparently composed of primary nanoparticles, are
resulted from the small particle size and high surface area, and
the high uniformity and good dispersion also share some credit.
4. Conclusions
Herein, we reported the feasible synthesis of hematite
submicro-flowers by a convenient hydrothermal method. SEM
and FE-SEM measurements showed that the flower-like parti-
cles were composed of nanospheres 20–30 nm in size. Probably
due to the fine particle size and large surface area, the material
shows superior electrochemical performance, with a high initial
capacity of 905.8 mAh/g and good capacity retention of 35.9%
up to the 50th cycle at 100 mA/g.
Acknowledgement
This work is financially supported by the Australian Research
Council through a Linkage project (LP0775456).
References
[1] X.W. Wang, Zh.Y. Zhang, Sh.X. Zhou, Mater. Sci. Eng. B 86 (2001) 29.
[2] S. Dash, M. Kamruddin, P.K. Ajikumar, A.K. Tyagi, B. Raj, Thermochim.
Acta 363 (2000) 129.
[3] D.A. Everest, I.G. Sayce, B. Selton, J. Mater. Sci. 6 (1971) 218.
[4] R.W. Siegel, S. Ramasamy, H. Hahn, L. Zongquan, L. Ting, R. Gronsky,
J. Mater. Res. 3 (1988) 1367.
[5] C.R. Bickmore, K.F. Waldner, R. Baranwal, T. Hinklin, D.R. Treadwell,
R.M. Laine, J. Eur. Ceram. Soc. 18 (1998) 287.
[6] D. Dong, P. Hong, S. Dai, Mater. Res. Bull. 30 (1995) 531.
[7] R.J. Davey, T. Hirai, J. Cryst. Growth 17 (1997) 1318.
[8] Ch.H. Lu, W.Ch. Lee, Sh.J. Liou, G.T.K. Fey, J. Power Sources 81–82
(1999) 696.
[9] K. Byrappa, T. Adschiri, Prog. Cryst. Growth Charact. Mater. 53 (2007)
117.
[10] W.J. Li, E.W. Shi, T. Fukuda, Cryst. Res. Technol. 38 (2003) 847.
[11] C. Gong, D. Chen, X. Jiao, Q. Wang, J. Mater. Chem. 12 (2002) 1844.
[12] D. Larcher, D. Bonnin, R. Cortes, I. Rivals, L. Personnaz, J M. Tarascon,
J. Electrochem. Soc. 150 (2003) A1643.
[13] D. Larcher, C. Masquelier, D. Bonnin, Y. Chabre, V. Masson, J.B. Leriche,
J M. Tarascon, J. Electrochem. Soc. 150 (2003) A133.
[14] T. Sugimoto, K. Sakata, J. Colloid Interf. Sci. 152 (1992) 587.
[15] K. Woo, H.J. Lee, J.P. Ahn, Y.S. Park, Adv. Mater. 15 (2003) 1761.
[16] J. Chen, L.N. Xu, W.Y. Li, X.L. Gou, Adv. Mater. 17 (2005) 582.
[17] L. Liu, H.Z. Kou, W.L. Mo, H.J. Liu, Y.Q. Wang, J. Phys. Chem. B 110
(2006) 15218.
[18] L. Suber, D. Fiorani, P. Imperatory, S. Foglia, A. Montone, R. Zysler,
Nanostruct. Mater. 11 (1999) 797.
[19] X.Q. Liu, S.W. Tao, Y.S. Shen, Sens. Actuators B: Chem. 40 (1997) 161.
4218 Y. NuLi et al. / Electrochimica Acta 53 (2008) 4213–4218
[20] W.T. Dong, C.Sh. Zhu, J. Mater. Chem. 12 (2002) 1676.
[21] W.T. Dong, S.X. Wu, D.P. Chen, Chem. Lett. 5 (2000) 496.
[22] M. Vasquez-Mansilla, R.D. Zysler, C. Arciprete, J. Magn. Magn. Mater.
226–230 (2001) 1907.
[23] C.J. Jia, L.D. Sun, Z.G. Yan, L.P. You, F. Luo, X.D. Han, Y.C. Pang, Z.
Zhang, C.H. Yan, Angew. Chem. Int. Ed. 44 (2005) 4328.
[24] J. Wan, X. Chen, Z. Wang, X. Yang, Y.T. Qian, J. Cryst. Growth 276 (2005)
571.
[25] A.A. Burukhin, B.R. Churagulov, N.N. Oleynikov, A.V. Knotko, in: Y.
Kazumichi, F. Qi (Eds.), Proceedings of the Joint 6th International Sym-
posium on Hydrothermal Reactions and 4th International Conference on
Solvo-Thermal Reaction, Nishimura Tosha-Do Ltd., Kochi, Japan, 2P-54,
2001.
[26] M.P. Morales, T.G. Carreno, C.J. Serna, J. Mater. Res. 7 (1992) 2538.
[27] T. Zhao, D.H. Chen, D.R. Chen, Chin. Chem. Lett. 14 (2003) 323.
[28] Zh.H. Jing, Sh.H. Wu, Mater. Lett. 58 (2004) 3637.
[29] Y. Zheng, Y. Cheng, Y. Wang, F. Bao, J. Cryst. Growth 284 (2005) 221.
[30] G.S. Li, R.L. Smith Jr., H. Inomata, K. Arai, Mater. Res. Bull. 37 (2002)
949.
[31] J.M. Harris, in: J.M. Harris (Ed.), Poly(ethylene glycol) Chemistry,
Biotechnical and Biomedical Application, Plenum Press, New York, 1992,
Ch. 1.
[32] H.P. Klug,L.E. Alexander, X-rayDiffraction Proceduresfor Polycrystalline
and Amorphous Materials, Wiley, New York, 1974, p. 618.
[33] M. Ocana, M.P. Morales, C.J. Serna, J. Colloid Interf. Sci. 212 (1999) 317.
[34] H. Morimoto, S I. Tobishima, Y. Iizuka, J. Power Sources 146 (2005)
315.
[35] S.Y. Zeng, K.B. Tang, T.W. Li, J. Colloid Interf. Sci. 312 (2007) 513.
[36] H. Li, X.J. Huang, L.Q. Chen, Zh.G. Wu, Y. Liang, Electrochem. Solid
State Lett. 2 (1999) 547.