- Trang chủ >>
- Khoa Học Tự Nhiên >>
- Vật lý
reflection-based sensor for gaseous ammonia
Bạn đang xem bản rút gọn của tài liệu. Xem và tải ngay bản đầy đủ của tài liệu tại đây (669.26 KB, 6 trang )
Sensors and Actuators B 139 (2009) 252–257
Contents lists available at ScienceDirect
Sensors and Actuators B: Chemical
journal homepage: www.elsevier.com/locate/snb
Reflection-based sensor for gaseous ammonia
Ákos Markovics
a
, Géza Nagy
b
, Barna Kovács
a,b,∗
a
Department of General and Physical Chemistry, University of Pécs, Ifjuság 6, Pécs, Hungary
b
South-Transdanubian Cooperative Research Center, Ifjuság 6, Pécs, Hungary
article info
Article history:
Available online 31 March 2009
Keywords:
Anodized aluminum
Ammonia gas sensing
Optical sensor
Reflection
abstract
In this work we describe the fabrication of an ammonia sensor on anodized aluminum substrate. Pure
aluminum was oxidized with direct current (DC) method at different voltages to obtain oxide layers with
different porosity. The adsorption capacities of the differentlyprepared layers weremeasured. Bromophe-
nol blue (BPB), bromocresol green (BCG) and bromocresol purple (BCP) indicators were immobilized by
simple adsorption. Sensor properties, such asdetection limit (100 ppb,5 and 50 ppm forBPB, BCG and BCP,
respectively), dynamic range (0–80, 10–90, 100–600 ppm for BPB, BCG and BCP, respectively), response
time and reversibility were investigated. We found, that sensors prepared on different oxide layers with
the same indicator, show different signal change in the presence of the same concentration of ammonia
gas. Sensors with optimal performance we re selected for solving different tasks.
© 2009 Elsevier B.V. All rights reserved.
1. Introduction
The sensing ofgaseousammonia is important inagriculture,bio-
process monitoring as well as in food-freshness testing. In chicken
farming for instance, the presence of ammonia can cause eye and
respiratory irritation of the stock, which has a negative effect on
the egg production. Cheap and reliable sensors are needed for con-
tinuous monitoring of the concentration of this compound mainly
in the ppm level [1]. There are many different ways to detect
this volatile, basic gas. Semiconductor-based solid-state sensors
[2], IR adsorption-based detection [3], or electrochemical meth-
ods [4] can be used for ammonia concentration measurements.
Nowadays optical chemical sensors are in the spotlight, due to
their relatively low manufacturing and operational costs. Opti-
cal chemical sensors are not affected by electromagnetic noise,
and often remote sensing is also possible by using optical fibers
[5].
Many ammonia-sensitive optical chemical sensors use the
acid–base properties of the indicator as well as of the ammonia. In
this way ammonia can deprotonate triphenyl-methane type indi-
cators, which results in readily detectable optical changes [6].Ifthe
indicator molecules are entrapped on the surface of a substrate, the
presence of the gas can be detected in reflection mode. Bromocresol
purple (BCP), phenol red (PR), fluorescein (FL) and their deriva-
tives have already been used for sensor fabrication [7,8]. The limit
∗
Corresponding author at: Department of General and Physical Chemistry, Uni-
versity of Pécs, Ifjusag 6, Pécs, Hungary. Tel.: +36 72 503 600x4680; fax: +36 72 503
635.
E-mail address: (B. Kovács).
of detection depends mainly on the dissociation constants of the
indicator, and hence on the matrix properties.
In sensor preparation, the sensitive chemical compounds have
to be immobilized on the surface of a substrate. Plasticized
PVC and other polymer membranes, sol–gels are often used to
form sensitive layers on the support materials, which are pla-
nar waveguides, microscope slides, or optical fibers in many cases
[9–11]. The properties of the sensing films depend strongly on
the ageing of the polymer matrices. The lifetime of the sen-
sor can be prolonged if the organic dye molecules are bonded
directly to the surface. A convenient and effective way of this
direct binding is the entrapment of the indicator molecules in
nanometer-sized pores on anodized alumina, with a simple adsorp-
tion process [12,13]. This technique is highly reproducible, cheap,
and suitable for standardized production even in large quanti-
ties. The metal aluminum substrates provide a highly reflective
background for reflection-based measurements, so the addition of
reflection enhancers is not needed as it is at other types of sen-
sors.
Both AC and DC current can be used for electrochemical prepa-
ration of aluminum-oxide layers. In direct current methods, the
substrate is connected as anode, against an aluminum cathode,
while as electrolyte most often sulfuric acid, phosphoric acid,
or some other organic acids are selected [12,13]. The formed
aluminum-oxide has a porous structure. Its surface morphology
strongly depends on the fabrication parameters. The size, number
and surface density of the pores can be controlled by the composi-
tion and temperature of the electrolyte, the current density, voltage
and the electrolysis time applied [14–16]. The preparation and char-
acterization of anodized alumina surfaces has become very popular
in the recent years. It was established, that over a certain voltage a
0925-4005/$ – see front matter © 2009 Elsevier B.V. All rights reserved.
doi:10.1016/j.snb.2009.02.075
Á. Markovics et al. / Sensors and Actuators B 139 (2009) 252–257 253
self-ordering process can be observed, hexagonal cells occur in the
oxide-layer [17–21].
Most of the optical ammonia sensors reported contain thin plas-
ticized polymeric membranes with embedde d chemical sensing
molecules. In their case the ageing of the soft polymer layer could
result in continuous drift of the sensor signal and in a limited oper-
ational lifetime of the optical sensor. To overcome the problem,
plasticizer free polymer and sol–gel matrices were developed. In
this work we describe the fabrication of different ammonia sensors
on anodized aluminum substrates. All the sensors were prepared
on aluminum sheets, oxidized at different voltages to obtain oxide
layers of dif ferent porosity. Triphenyl-methane dyes of different
pK
a
were immobilized on the oxide layers by simple adsorption.
The analytical properties, such as detection limit, dynamic range,
response time and reversibility of the sensors were investigated.
We found, that sensors prepared of the same indicator on different
oxide-layers have different relative signal change when exposing
to the same concentration of analyte, and also different dynamic
range.
2. Experimental
2.1. Materials
Aluminum plates (99.5%) with a thickness of 0.5 mm were pur-
chased from Köbal Ltd. (Budapest, Hungary). Triphenyl-methane
dyes, such as bromophenol blue (BPB), bromocresol green (BCG)
and bromocresol purple (BCP), all indicator grades, were purchased
from Reanal Ltd. (Budapest, Hungary). Dodecylbenzenesulfonic-
acid (H-DBS) was obtained from Fluka (Buchs, Switzerland). Acids
and the other chemicals used for preparing the anodizing bath
were Riedel de Haen products. All the chemicals were analytical
gradeand used as received. Solutions were prepared withdeionized
water; its specific conductivity was less than 0.8 Scm
−1
. Cali-
brating gas (93.7 ppm NH
3
in nitrogen) was purchased from Linde
(Répcelak, Hungary).
2.2. Sensor fabrication
Pure 1.5cm× 4 cm aluminum sheets were used as substrates in
the sensor fabrication process. Their surfaces were electropolished
in a 4:1 ethanol–perchloric acid (60%) mixture until the natural
oxide-layer and other impurities were totally removed and a shiny,
smooth surface was formed (3.3 A, 1 min). The plates were rinsed
thoroughly with deionized water.
The anodizing of the substrates was carried out in an electrolyz-
ing cell; thesensor plates wereconnected as anodesand a U-shaped
aluminum block was used as cathode. The cell voltage was con-
trolled by aCAI 20-1084 laboratory power-supply within the 0–30 V
range. The 5% sulfuric-acid electrolyte solution was continuously
stirred at 150 rpm during the whole oxidation process. The time
of the electrolytic oxide layer formation was 10 min in most of the
experiments.
The anodized substrates were rinsed, andsonicated in deionized
water for 2min to remove the excess of the anodizing solution, then
they were dried at room temperature for 10–20 min. After drying,
the chemical sensing layer was prepared by immersing the plates
for 10min in 0.1% solutions of different triphenyl-methane type
indicator dyes. The indicator solutions were made by dissolving
0.1 g of a selected dye in 1 ml of ethanol (96%) and then diluted
to 100 ml in a volumetric flask.
After dyeing, the sensors were rinsed with distilled water and
were protonated with a diluted (1%) aqueous solution of H-DBS for
5 s by immersion, and finally dried at room temperature.
2.3. Determination of the adsorption capacity of the anodized
alumina films
The anodized plates were cut into 3cm × 1cm pieces, and they
were immersed into BCG containing solutions of known volume
(5.00 ml). The concentration of the dye solution ranged from 0.01
to 1mM. The absorption spectra of the dye solution were measured
prior the soaking procedure. The aluminum plates were kept for
24 h in the dye solution to achieve complete adsorption. After then,
the plates were removed from the dyeing solution, and the absorp-
tion spectra of the solutions were measured again. The adsorbed
dye amount was then calculated by knowing the volume of the dye
solution, and its concentrations before and after the adsorption:
n
ad
= V(c
0
− c
eq
)
where V is the volume of the dye solution, c
0
and c
eq
are the initial
and the equilibrium dye concentrations (before and after adsorp-
tion, respectively).
2.4. Instrumentation
The sensors were tested and calibrated in a home-built flow-
through cell, prepared on a 0.5 cm thick, stable aluminum base. An
approximately 2mm × 50mm
2
gasket was formed in a 2 mm thick
thin rubber layer, which was pressed against the aluminum plate by
a Plexiglas cover. The gas in- and outlets were prepared of 20 mm
long, 0.5 mm inner diameter stainless steel tubes, taken from medi-
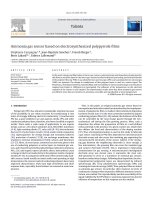
cal needles, Fig. 1 shows the instrumental setup used for the sensor
characterization.
During the measurements the sensor was placed face down
between the Plexiglas cover and the rubber layer. The chemically
sensitive layer was illuminated by a halogen light source (Avantes
Ava-Hal) through thecentralfiber ofa seven-fiber bundle. The other
six fibers were used to guide the reflected light to a two-channel
fiber optic, diode array photometer (Avantes, Avaspec-2048-2).
Spectra were taken in reflection mode, in a concentration range
from 0 to 93 ppm ammonia in air. The 100% reflection was set by
using a home-prepared reflective element, made of electropolished
aluminum, the same quality as the substrate material.
The calibrating gas mixture was prepared by using three inde-
pendent Cole–Parmer flow meters, an air-pump and a flask of
93 ppm ammonia in nitrogen. On two flow meters the rate of the
air flow, on the third one the amount of the added ammonia could
Fig. 1. Experimental setup. (A) screw, (B) plexiglas cover, (C) sensor, (D) rubber
gasket with gas inlet and outlet, (E) aluminum base and (F) fiber bundle with one
illumination and six readout fibers.
254 Á. Markovics et al. / Sensors and Actuators B 139 (2009) 252–257
be controlled. This way the calibrating gas was diluted with air, and
the concentration of the mixture could be adjusted in the 0–93ppm
range, with a resolution of 1.56 ppm. The flow rate in the cell was
kept constant (33 ml/min) during the experiments.
In order to investigate the surface morphology of the different
layers prepared, scanning electron microscope images were taken
at 20kV by a Jeol-100 SEM device.
3. Result and discussion
3.1. Anodizing of the aluminum support
The pure aluminum sheets, used as substrates in the sensor fab-
rication process, were electropolished, and thenDC anodized in two
ways:
•
Constant current mode: the current density was adjusted to
16 mA/cm
2
by using a stabilized power supply. During the layer
formation, the initial 12 V potential dropped to 4V.
•
Constant voltage mode: porous oxide layers were prepared using,
12, 18 and 24 V DC. No significant change of the current (except
some transient fluctuation in the first 10 s) was observed during
the layer fabrication, except when 24 V cell voltage was selected.
In this case, the temperatureofthe solution increased by 15–20
◦
C,
since the higher current resulted in more heat to absorb (the elec-
tric power is proportional to I
2
). At this temperature the mobility
of the ions is higher and a current drift can be observed.
By increasing the anodizing time, thicker oxide layer with lower
reflexivity can be prepared. After 10 min of anodizing (in DC mode),
an average of 20 m was measured for layer thickness, using micro-
scopic methods. As it can be seen in Fig. 2, the reflection of the
Fig. 2. Reflection of the aluminum at 600 nm as a function of the anodizing time.
The reflections of three sensors prepared in different batches are presented.
surface decreased by 30% during the preparation. This change was
measured at 600 nm, which wavelength corresponds to the previ-
ously determined absorption maxima of BPB and BCG solutions.
Scanning electron microscopy (SEM) images prove that the
anodizing voltage has a great influence on the surface morphology
of the alumina layers(Fig.3).By increasingthe potentialinDC mode,
the diameter, number and density of the pores changed signifi-
cantly. At 6V the layer has very small pores in the nanometer range.
At12 Vthenumberof greaterpores(0.1m) increased, while at 18 V
the pore diameter and the wall thickness became comparable. By
reaching the so-called self-ordering voltage (approximately 24 V)
Fig. 3. SEM pictures of aluminum plates DC anodized for 10 min at different potentials in 5% sulfuric acid solution. The potentials were: (A) 6 V, (B) 12V, (C) 18 V and (D) 24V.
Á. Markovics et al. / Sensors and Actuators B 139 (2009) 252–257 255
Fig. 4. Adsorption capacities of layers prepared at different potentials. The adsorbed
dye was BCG. (a) 6 V, (b) 12 V, (c) 18 V and (d) 24 V.
hexagonal pores [18] were growing, the surface showed cellular
order with reduced wall thickness. The high electric field strength
at the barrier layer of the porous films is the main controlling factor
of this phenomenon.
We note that by using controlled current electrolysis, the sur-
face morphology became similar to that obtained with controlled
voltage mode electrolysis at 12V. It can be explained by the obser-
vation that for 16 mA/cm
2
current density 12 V starting potential
has to be set. Although the potential drops during the process, the
oxide layer grows inward (towards the internal parts of the sub-
strate), thus the structure of the upper layer is developed during
the first few minutes of the electrolysis.
As anotherimportant parameter,the adsorption capacities of the
different layers were measured spectrophotometrically by using
BCG indicator, as it was written in Section 2. By plotting number
of the adsorbed moles against the equilibrium concentration of
the dye at constant temperature, adsorption isotherms could be
obtained (Fig. 4). Interestingly, the adsorption capacity of a layer
prepared at 12 V was found eight times higher than that of the layer
prepared at 6 V.
This is in good agreement with the morphology comparison. By
increasing the pore number (12 V—approximately 10 pore/m
2
)a
higher adsorption capacity was found. Over 12V cell voltage, the
diameter of the pores starts to increase dramatically (to approx-
imately 0.5 m), that leads to the decrease of their inner surface
and the adsorption capacity.
Higher concentrationof indicator resultsin higher signal change,
as well as in better signal to noise ratio. We could conclude that
Fig. 5. Calibration graphs of sensors prepared with dif ferent triphenyl-methane
indicators measured at 600 nm.
Fig. 6. Difference spectra of a BCG-based sensor anodized at 12V for 10 min. The
spectra were taken at 10 different ammonia concentrations between 0, 9, 19, 28, 37,
47, 56, 65, 74, 84, 93 ppm.
very small and very large pores are not advantageous for sensing
purposes. This way the optimal electrolysis conditions were found.
3.2. Comparison of sensors prepared with constant current
To examine how the pK
a
of the indicator affects the calibration
curves of the sensors, alumina layers were prepared with constant
Fig. 7. Calibration plots of BCG-based sensors. Sensors were prepared at 12V(A)and
at 18 V (B).
256 Á. Markovics et al. / Sensors and Actuators B 139 (2009) 252–257
Table 1
Parameters of BCG-based ammonia sensors made on substrates anodized at different potentials.
Anodizing potential (V) Change in reflection (%) Sensitivity
a
(ppm) Response time (s) Reverse response, t
50
(s)
6 15 40 <10 250
12 30 18 <10 150
18 43 25 <10 >1000
24 5 33 <10 240
a
The concentration which causes 50% relative change in reflection at 600 nm.
current anodizing method (10 min) and they were then soaked in
three different dye solutions. The sensors were protonated, dried,
put into the flow cell, and calibrations were made at different
ammonia concentrations. The reflection changes were measured at
600 nm that corresponds to the absorption maxima of the depro-
tonated form of the dyes (Fig. 5).
In order to compare the sensitivities of the different sensors, we
investigated which concentration of gaseous ammonia results in a
25% relative signal change. For the 100% reference, the saturation
(total deprotonation) of the sensors with 1% (V/V)ammonia gas was
taken. As it is plotted in Fig. 6, BPB, BCG and BCP have significantly
different calibration curves. For the 25% relative signal change in
case of these three dyes, in order: 25, 50 and 400 ppm ammonia
concentrations were measured. These decreasing sensitivities cor-
respond to the increasing pK
a
values of the dyes (pK
a
= 3.8 for BPB;
4.7 for BCG; 6.0 for BCP). Since the most important concentration
range in environmental monitoring is below 100 ppm (even much
lower for dissolved ammonia), BCP is practically useless for that
sensor purposes.
The response time and reversibility of these sensors were tested
by switching the concentration from 0 to 93ppm and back. All the
sensors responded in 4–10 s, however the reverse response times
(t
50
) were much longer: 20, 9 and 3min for BPB, BCG and BCP made
sensors, respectively.
Comparing to other reflection-based optical chemical ammonia
sensors [8], the presented three sensors cover a wide concentration
range. For a desired application sensor can be prepared by choosing
an indicator with a proper pK
a
.
3.3. Comparison of sensors prepared with constant voltages
To examine the effect of the surface morphology on the analyti-
cal properties of the sensors four different potentials (6, 12, 18 and
24 V) were selected to prepare four differently porous oxide layers
as sensor substrates.
Ammonia sensors were prepared by immersing the anodized
plates into bromocresol green (BCG) solution, washed and finally
dried. The sensors were tested in the flow-through cell in reflec-
tion mode. Typical differential reflection spectra are shown in
Fig. 6, that were obtained in the 0–93 ppm concentration range.
One can see that the shape of the spectra slightly differs from that
could be measured in transmission or absorption mode in solu-
tions or in polymeric membranes: a wave is superimposed on the
absorption bands. This is caused by interference effect. The incident
light reflected by the surface of the layer interferes with the light
reflected by the lower aluminum layer.
Surprisingly the sensitivities of the differently prepared layers
were also different. As it is shown in Fig. 7A and B, the sensor pre-
pared at 12 V is more sensitive (30%) than that made at 18 V. The
measurements were completed also for membranes prepared at
6 and 24V; the results are summarized in Table 1. Interestingly
the sensitivities of the sensing layers are in good agreement with
the adsorption capacity of the films. The higher is the capacity, the
higher is the sensitivity of the film. The highest differences in the
sensitivities were calculated between the 6 and 12 V made sensor,
this latter showed a 2-fold increase in the sensitivity. The obtained
sensitivities, dynamic ranges are determined mainly by the pK
a
of
the indicator, although the surface morphology also affects these
parameters.
It was expected from the SEM-results, that larger pores obtained
at higher potentials could affect the diffusion processes in the sen-
sor layer, and as a result the recovery time decreases. As it is listed
in Table 1, no relation was found between the pore diameter and
the recovery time. Presumably, the thickness of the layer and the
amount of immobilize d indicator determine that parameter; the
clarification requires further investigations.
4. Conclusions
The results show that the sensitivity, the limit of detection, and
the dynamic range of the sensors were significantly affected by
the layer-porosity hence the applied potential. Highest sensitivity
(18 ppm) was obtained with the sensors prepared at 12 V with con-
trolled potential method and BCG, or at 16 mA/cm
2
current density
with controlled current film formations and BPB indicator. These
sensors showed also the highest signal change (with different sen-
sitivity) in the 1–50 ppm range that is typical in stockyards and
hutches in poultry breeding. Response times for increasing ammo-
nia concentration were similar (3–7 s) while the reverse processes
took 8–20min depending on the oxide layer.
Anodized aluminum has excellent reflection property that
makes it suitable for remote measurements. The anodizing process
could be easily controlled which results in reproducible sensing
layer thickness that could be produce in large quantities.
Acknowledgments
The authors are thankful to F. Kaposvari for his kind assistance
in the SEM measurements.
This work was supported by the Hungarian Research Foundation
(OTKA T046798).
References
[1] B. Timmer, W. Olthuis, A. van den Berg, Ammonia sensors and their
applications—a review, Sensors and Actuators B 107 (2005) 666–677.
[2] Y D.Wang, X H. Wu, Q. Su,Y F. Li, Z L. Zhou, Ammonia-sensingcharacteristics
of Pt and SiO
2
doped SnO
2
materials, Solid-State Electronics 45 (2001) 347–350.
[3] M. Fehér, P.A. Martin, A. Rohrbacher, A.M. Soliva, J.P. Maier, Inexpensive near-
infrared diode-laser-based detection system for ammonia, Applied Optics 32
(12) (1993) 2028–2030.
[4] B.A. López de Mishima, H.T. Mishima, Ammonia sensor based on propylene
carbonate, Sensors and Actuators B 131 (2008) 236–240.
[5] H. Guo, S. Tao, Silver nanoparticles doped silica nanocomposites coated on an
optical fiber for ammoniasensing,SensorsandActuators B 123 (2007) 578–582.
[6] G.J. Mohr, T. Werner, I. Ohme, C. Preininger, I. Klimant, B. Kovács, O.S. Wolfbeis,
Novel opticalsensormaterials based onthesolubilizationofpolar dyes inapolar
polymers, Advanced Materials 9 (1997) 1108–1113.
[7] A. Persad, K. Chow, W. Wang, E. Wang, A. Okafor, N. Jespersen, J. Mann, A.
Bocarsly, Investigation of dye-doped sol–gels for ammonia gas sensing, Sensors
and Actuators B 129 (2008) 359–363.
[8] A. Lobnik, O.S. Wolfbeis, Sol–gel based optical sensor for dissolved ammonia,
Sensors and Actuators B 51 (1998) 203–207.
[9] J. Moreno, F.J. Arregui,I.R.Matias,Fiber optic ammonia sensingemploying novel
thermoplastic polyurethane membranes, Sensors and Actuators B 105 (2005)
419–424.
[10] S. Tao, L. Xu, J.C. Fanguy, Optical fiber ammonia sensing probes using reagent
immobilized porous silica coating as transducers, Sensors and Actuators B 115
(2006) 158–163.
Á. Markovics et al. / Sensors and Actuators B 139 (2009) 252–257 257
[11] W. Cao, Y. Duan, Optical fiber-based evanescent ammonia sensor, Sensors and
Actuators B 110 (2005) 252–259.
[12] Y. Fujiwara, Y. Amao, Novel optical oxygen sensing material: 1-pyrenedecanoic
acid and perfluorodecanoic acid chemisorbed onto anodic oxidized aluminum
plate, Sensors and Actuators B 99 (2004) 130–133.
[13] Y. Fujiwara, Y. Amao, Optimising oxygen-sensitivity of optical sensor using
pyrene carboxylic acid by myristic acid co-chemisorption onto anodic oxidized
aluminum plate, Talanta (2004) 655–660.
[14] E. Palibroda, T. Farcas, A. Lupsan, A new image of porous aluminium oxide,
Materials Science and Engineering B 32 (1995) 1–5.
[15] I. Tsangaraki-Kaplanoglou, S. Theohari, T. Dimogerontakis, Y M. Wang, H H.
(Harry) Kuo, S. Kia, Effect of alloy types on the anodizing process of aluminum,
Surface & Coatings Technology 200 (2006) 2634–2641.
[16] G.E. Thompson, Porous anodic alumina: fabrication, characterization and appli-
cations, Thin Solid Films 297 (1997) 192–201.
[17] Y.Sui,J.M. Saniger, Characterization ofanodicporous alumina byAFM,Materials
Letters 48 (2001) 127–136.
[18] S. Ono, M. Saito, H. Asoh, Self-ordering of anodic porous alumina formed in
organic acid electrolytes, Electrochimica Acta 51 (2005) 827–833.
[19] W. Cai, G. Wilde, Highly ordered nanostructures with tunable size, shape and
properties: a new way to surface nano-patterning using ultra-thin alumina
masks, Progress in Materials Science 52 (2007) 465–539.
[20] S. Mátéfi-Tempfli, M. Mátéfi-Tempfli, L. Piraux, Characterization of nanopores
ordering in anodic alumina, Thin Solid Films 516 (2008) 3735–3740.
[21] T. Nagaura, F. Takeuchi, S. Inoue, Fabrication and structural control of anodic
alumina films with inverted cone porous structure using multi-step anodizing,
Electrochimica Acta 53 (2008) 2109–2114.
Biographies
Ákos Markovicsreceived his MScinphysics in2004 from theUniversity of Pécs.Dur-
ing these 5 years, his interest turned towards chemistry and started further studies.
He received his MSc in chemistry in 2007, and currently he is a PhD student at the
Department of General and Physical Chemistry.
Géza Nagy is a full professor of physical chemistry at the University of Pécs. He
obtained MSc from Kossuth Lajos University Debrecen, Hungary, PhD from Technical
University of Budapest, DSc from Hungarian Academy of Sciences. He worked as
postdoc fellow with G.G. Guilbault at LSUNO (New Orleans, LA), with R.N. Adams
(KU, Lawrence), as visiting scholar at UF (Gainesville, FL) with Roger Bates, at UNC
(Chapel Hill) with R.P. Buck, at TU (Austin, TX) with A.J. Bard. He is author of more
than 200 scientific papers.
Barna Kovács studied chemistry at the University of Szeged and obtained his
diploma in 1989. After finishing his doctoral work in 1991 on potentiometric surfac-
tant sensitive electrodes, he moved to Graz and worked as postdoc in the group of
O.S. Wolfbeis. From 1994 to 1999 he has been working at the University of Pécs as
assistant. In 2000 he received associate professor position. From 2003 he is head of
the analytical department of the South-Trans-Danubian Cooperative Research Cen-
ter. His main interests are luminescent-based analytical techniques and sensors for
environmental analysis.