- Trang chủ >>
- Khoa Học Tự Nhiên >>
- Vật lý
Electrical porous silicon chemical sensor for detection of organic solvents
Bạn đang xem bản rút gọn của tài liệu. Xem và tải ngay bản đầy đủ của tài liệu tại đây (433.96 KB, 11 trang )
Sensors and Actuators B 106 (2005) 347–357
Electrical porous silicon chemical sensor for detection of
organic solvents
M. Archer
a,∗
, M. Christophersen, P.M. Fauchet
a,b
a
Department of Biomedical Engineering, Center for Future Health, University of Rochester,
601 Elmwood Avenue, Rochester, NY 14642, USA
b
Department of Electrical and Computer Engineering, Center for Future Health, University of Rochester,
601 Elmwood Avenue, Rochester, NY 14642, USA
Received 20 April 2004; received in revised form 17 August 2004; accepted 18 August 2004
Available online 25 September 2004
Abstract
A novel electrical sensor platform containing a porous silicon (PSi) layer on a crystalline silicon substrate has been developed in which the
electrical contacts are made exclusively on the backside of the substrate allowing complete exposure of the surface to the sensing molecules.
The PSi layers were 20 m thick with an average pore diameter of 1m. Real-time measurements of capacitance (C) and conductance (G)
were performed and the response produced by the addition of different organic solvents was evaluated. The observed response is attributed to
the combined effect of achange in dielectric constant inside the porousmatrix and amodification in the depletionlayer width inthe crystalline
silicon structure. A space charge region modulation model was used to explain the effect induced by molecules of different dipole moments,
dielectric constants, polarizabilities and water solubilities.
© 2004 Elsevier B.V. All rights reserved.
Keywords: Macroporous silicon; Electrical sensors; Organic solvent detection; Chemical sensor
1. Introduction
Porous silicon(PSi) isproduced by electrochemicaldisso-
lution of crystalline silicon in a hydrofluoric acid based elec-
trolyte. The resulting structure consists of pores alternating
with crystalline silicon rods attached to a crystalline silicon
substrate. PSi is characterized by a large internal surface area
sensitive to the presence of charged molecules, which can
be exploited for sensor development. Since the discovery of
the room temperature photoluminescence (PL) of PSi [1,2] a
great amount of work has been devoted to establish itsorigin.
The surface of PSi plays a crucial role in its electrical [3–5]
and optical behavior [6,7]. The observed change in conduc-
tivity upon exposure to different organic solvents and other
molecules such as oxygen, suggests the existence of at least
∗
Corresponding author. Tel.: +1 585 2731559; fax: +1 585 2732981.
E-mail address: (M. Archer).
two response mechanisms. The first one relies on a change
in the charge distribution within the crystallites due to the
alignment of polar molecules on the surface [8,9]. The sec-
ond one involves charge transfer reactions mediated by sur-
face traps during adsorption [10] and oxidation of molecules
on thesurface ofporous silicon[9].Thesecond mechanismis
supportedbytheobserved shiftinthePLpeak ofPSi uponex-
posure to valence band and conduction band quenchers with
different redox potentials [11]. Although a complete model
does not exist, it is clear that PSi is sensitive to charge and
that the response upon exposure to certain organic solvents
is reversible [12]. Aside from its electrical and optical prop-
erties, PSi offers a wide range of morphological properties
as well as possible surface modifications that are useful for
sensing applications [13].
We have taken advantage of the electrical activity of
porous silicon and the tunability of its morphology to de-
velop a novel electrical sensor platform. Recently, we de-
0925-4005/$ – see front matter © 2004 Elsevier B.V. All rights reserved.
doi:10.1016/j.snb.2004.08.016
348 M. Archer et al. / Sensors and Actuators B 106 (2005) 347–357
tected DNA hybridization and the presence of ethanol via a
change in the conductance [14] of mesoporous silicon layers
(pore diameter 20–50 nm) in structures with two concentric
circular electrical contacts made on the backside of the crys-
talline silicon substrate. We explained our findings as due
to charge redistribution in the crystalline silicon substrate
induced by the changes in the PSi layer. In this paper, we
present an optimized design of our porous silicon sensor in
which the size of the device is greatly reduced, the geome-
try of the backside electrodes is modified and a porous layer
having a different morphology is used. Systematic experi-
ments with different organic solvents in the liquid phase and
realistic modeling of the structures are also presented.
Four different geometrieshave beenusedto measure elec-
trical properties of PSi. These include metal contacts evapo-
rated only onthe porous layer surface [15]orin a “sandwich”
configuration [8,9,16,17], the use of coplanar contacts on the
porous layer [10] and interdigitated electrodes using pnjunc-
tions surrounded by PSi [18,19]. In all cases the response
of the device depends on the characteristics of the electrical
contact with the PSi. In comparison, in our devices, the field
propagates from the crystalline silicon substrate to the PSi
layer. Since no electrical contact is made on the porous layer,
any influence of the contact barrier and chemical reactions
that may occur between the metal and the organic solvent is
eliminated. The observed response is therefore related only
to the presence of molecules inside the porous layer and their
interaction with the surface of the layer.
2. Materials and methods
2.1. Sensor fabrication
The porous layers were fabricated by electrochemical dis-
solution of p-type silicon (ρ ∼ 10–20 cm) under galvano-
static (constant current) conditions with a current density of
4 mA/cm
2
. Theelectrolyteusedwas4 wt.%hydrofluoric acid
(49 wt.%) in N,N dimethylformamide (DMF) [20]. The use
of a mildoxidizer such as DMFresults in straightandsmooth
pore walls withpore diameter inthemicrometer range. These
conditions were selected to increase the pore diameter and to
enhance the sensitivity to changes in the space charge region.
The porous layers were etched for 70min resulting in 20m
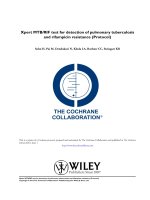
thick layers. Fig. 1 shows a SEM picture of the layers.
As will be shown in Section 3, a thin layer of surface ox-
ide is required for proper operation of the devices. The layers
were thus chemically oxidized by immersion in 30wt.% hy-
drogen peroxide (H
2
O
2
) for a period of 48h at room temper-
ature (22
◦
C). Although the oxide layer produced by this oxi-
dation technique is very thin [21], Fourier transform infrared
(FTIR) [22] and spectroscopicellipsometry [23] studies have
demonstrated the presence of vibrational modes and modi-
fications of the dielectric function characteristic of oxidized
porous silicon. The oxide is hydrophilic enough to allow the
infiltration of water soluble molecules without the need of
Fig. 1. Scanning electron microscopy (SEM) cross sectional view of a
macroporous silicon layer produced form p-type silicon (ρ ∼ 10–20 cm)
with an organic electrolyte. The bright areas correspond to c-Si rods and the
dark areas to pores propagating from the surface parallel to the c-Si rods.
a thicker thermally grown oxide. After oxidation the porous
layers wererinsedwithdeionizedwater andethanol anddried
under a stream of nitrogen. The oxide on the backside of the
crystalline siliconsubstrate was strippedwith a15% HFsolu-
tion (7:1, water: 49 wt.% HF) prior to the contact placement.
The wafers were cleaved into sections of 4 × 7mm and two
coplanar electrical contacts were placed 700m apart on the
crystalline silicon substrate. In our approach, the PSi surface
is completely exposed to the sensing molecules and no metal
contacts are made to it, avoiding the introduction of foreign
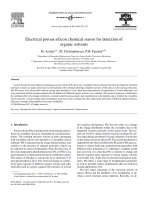
materials into the porous matrix. Fig. 2 shows a schematic
cross-sectional view of our device and images of the front
and backsides showing the electrical contacts and the actual
dimensions. In order to avoid any of the solvents tested from
reaching the backside contacts, the sensors were fixed on a
glass slide, which ensures a horizontal surface for a uniform
distribution of the solvent on the porous layer and protects
the backside of the device.
2.2. Measurement setup
Real-time capacitance (C) and conductance (G)
measurements were performed with an inductance–
capacitance–resistance (LCR) multifrequency meter. The
measurement parameters (frequency and bias voltage) and
the data acquisition and storage were controlled with a
LabView
TM
routine. The dc bias voltage and the amplitude
of the ac signal were selected to enhance the signal to noise
ratio and the reproducibility of the C–V measurements. For
this purpose we first varied the dc voltage from −10 to
10 V, the ac signal from 90 to 2 Vrms and the frequency
from 100Hz to 100kHz. Above ±5Vdc and 1Vacrms
the reproducibility of the results was low and the signal
to noise ratio was reduced. In all further experiments, we
selected a dc bias of 0 V and an ac signal of 90 mVrms
M. Archer et al. / Sensors and Actuators B 106 (2005) 347–357 349
Fig. 2. (a) Schematic cross sectional view of the porous silicon sensor. The electrical contacts are placed on the back part of the layer (c-Si) by aluminum
evaporation or colloidal silver paint 700m apart. (b) Pictures of the front and backsides of the device.
Fig. 3. (a) Phase angle (Θ) and (b) impedance (Z) as a function of frequency. The measurements were done in a dry sample (no infiltration of the porous layer)
with a dc bias of 0 V and an ac signal of 90 mV.
and then determined the optimal frequency based on the
measured values of impedance (Z) and phase angle (Θ).
The results are shown in Fig. 3. At low frequencies the
device behaves as a resistor and, as the frequency increases,
the phase angle shifts towards a capacitive behavior and
the impedance is reduced. We selected a frequency of
100 kHz to reduce the effect of parasitic capacitances and
of interface states at the contact site [24]. The measure-
ments under these experimental conditions correspond
to a parallel C–G circuit. All the experiments were per-
formed at room temperature (22
◦
C) under a controlled
humidity ambient (40–50% relative humidity). A schematic
representation of the measurement setup is shown in
Fig. 4.
Fig. 4. Schematic of the measurement setup. An inductance–capacitance–
resistance(LCR)metercontrolledbyLabView
TM
isusedtomeasure the real-
time changes of capacitance (C) and conductance (G). The measurements
are performed under a low humidity ambient.
2.3. Measurements with organic solvents
To evaluate the response of our sensor to organic solvents,
we exposed thedevice to moleculeswithdifferent dipolemo-
ments, polarizabilities and dielectric constants. The solvents
were separatedin two groups,polar andnon-polar molecules.
Water was analyzed independently. The characteristics of the
solvents used are shown in Table 1 [25] Four characteristics
were selected to understand the response:
• Dielectric constant: related tothe electric field distribution
inside the porous layer.
• Dipole moment:relatedto the local fields on the surface of
the porous layer.
• Polarizability: related to the orientation of the molecule
with respect to the porous layer surface.
• Bond character: related to water solubility (polar
molecules are more soluble in water than non polar
molecules).
Prior to the addition the sensor was allowed to stabilize
for at least 20 min under the temperature and humidity con-
ditions indicated in Section 2.2. Individual experiments were
performed on different layers by adding 10l of solvent. We
have investigated the sensitivity of the sensor to volumes in
the range of 2–10 l and our results suggest that the volume
of the solvent is not related to the magnitude but rather to
the duration of the response (time during which the layer
remains wet). A more detailed characterization of the volu-
350 M. Archer et al. / Sensors and Actuators B 106 (2005) 347–357
Table 1
Values of dielectric constant (ε), dipole moment (µ) and electronic polarizability (α) of the organic solvents tested [25]
Solvent dc dielectric constant Dipole moment (D) Electronic polarizability (×10
24
cm
3
) Bond character
Acetonitrile 37.5 3.45 4.4 Polar
Acetone 20.7 2.85 6.33 Polar
Ethanol 24.5 1.69 5.41 Polar
Chloroform 4.81 1.15 9.5 Polar
Benzene 2.27 0 10.32 Non-polar
Toluene 2.83 0.43 12.26 Non-polar
Water 80 1.82 1.45 Polar
metric sensitivity of the device would require the handling of
subnanoliter volumes. Within this range the response could
besignificantlyinfluencedbythesolvent’s vaporpressureand
its surface tension, which in turn would affect the infiltration
of the solvent into the porous layer. In our experiments, the
response of the capacitance (C) and the conductance (G)was
measured as the percentage change of the signal with respect
to the reference value.
3. Model
3.1. Space charge region modulation (SCRM) model
In order to understand our results and to compare them
with those in the literature we have developed a space charge
region modulation (SCRM) model. We will first describe our
sensor as a field effect device and derive an equivalent elec-
trical circuit. The principles ofdetectionand the assumptions
made in the analysis will then be discussed. Finally, the cor-
relation of the electrical response with the electrical charac-
teristics of the molecules will be presented in Section 4.
In a field effect transistor (FET) current flows through a
channel when a voltage is applied between the source and
drain terminals. The conductance in the channel, which is
directly proportional to its dimensions and the number of
carriers can be modulated by changing either of these two
variables. This modulation is done by applying an electric
field through a metal gate terminalwhichcan be placed at the
same plane between the source and drain (e.g., MESFET) or
parallel to them (e.g., JFET). When FETs areusedaselectro-
chemical transducers the metal gate is substituted by an elec-
trolyte or a synthetic selective membrane and modulation of
the conductance in the channel results from thechangeinpo-
tential at the semiconductor surface when chemical species
are present. In our device the gate electrode is substituted by
the porous layer and the channel is the c-Si substrate. Al-
though the experiments are carried out under a controlled
humidity ambient, the presence on the porous layer surface
of at least a monolayer of water is unavoidable. This initial
condition of the porous layer surface renders it with a larger
hydrophilic character, which influences its adsorption prop-
erties. When a molecule is infiltrated in the porous layer its
interaction with the surface will change the field distribution
in the c-Si rods. The porous layer then becomes a charged
layer that can modulate the field in the c-Si channel by two
mechanisms: (1) change in thespacecharge region by charge
redistribution and (2) change in the width of the conductive
channel.
IntheSCRMmodel, adsorbedmolecules changethespace
charge region ordepletion layer of thecrystalline silicon rods
and even affect the crystalline silicon substrate. In lightly
doped Si small changes in the surface charge produce a large
change in the space charge region width. Since the oxide that
covers the surface is thin the effect of electrical charges on
the oxide surface can influence the underlying silicon. These
two characteristics constitute the principle of detection and
transductionofourPSisensor. Wenotethattheyhaverecently
been exploited for the development of other devices such as
cantilever field effect sensors [26].
When thesurfaceof theporous layeris exposed toa liquid,
electrostatic equilibrium at the solid/liquid interface must be
established. This produces an electric field that results in an
electrical double layer formed by the space charge region
(in the semiconductor) and the Gouy layer (equivalent to the
space charge region in the electrolyte). Adsorbed ions be-
tween these two layers form the Helmholtz region, which to-
gether with the semiconductor space charge region, accounts
for most of the potential drop (Galvani potential) across the
double layer. While the Helmholtz region is primarily sensi-
tive to the adsorption/desorption of ions and the electrolyte
composition, the role of the semiconductor space charge re-
gion is to compensate charge until equilibrium is reached
[21]. The response of our device is produced by the charge
compensation in the c-Si along with changes in the dielec-
tric constant of the porous layer. The change in the space
charge region will depend on the sign of the charge “felt”
by the c-Si rod and its magnitude, which is also influenced
by the orientation of the molecule with respect to the sur-
face. If the effect is that of a positive charge then the width
of the space charge region increases, the opposite being true
for negative charges. Water soluble molecules tend to as-
sociate closer to the surface therefore inducing a stronger
effect.
3.2. Simulations and equivalent circuit
In order to evaluate the field distribution in our device
we performed a simulation of the electric field using com-
mercially available software (Ansoft, Maxwell 2-D). Fig. 5
M. Archer et al. / Sensors and Actuators B 106 (2005) 347–357 351
Fig. 5. Simulation of the electric field distribution in the cross section of a c-Si substrate with two parallel electrodes. An ac voltage of 1 V peak to peak at
100 kHz excitation frequency and a dc voltage of 0V were used as experimental parameters.
shows the calculated electric field distribution for 15 cm
p-type Si with two parallel contacts placed on the back. The
applied ac voltage is 1 V peak to peak at 100 kHz excita-
tion frequency and the dc voltage is 0 V. The field intensity
is larger near the contacts and gradually decreases towards
the top c-Si surface. This field distribution is very similar to
the one reported by Ramos et al. [27] for dielectrophoresis
applications with a similar electrode geometry. The current
density distribution is also such that its magnitude is larger at
the interface with the electrodes close to the gap, and grad-
ually reduces towards the surface of the c-Si substrate. The
simulation shows that the electric field can reach the top of
the c-Si where the PSi layer is located. As mentioned before
the response of our device is based on changes in the porous
layer induced by the presence of molecules. This effect was
simulated by considering a uniform sheet of charge on the
top surface in the presence of a dc voltage of 1 V and an ac
voltageof 0V betweenthe electrodes.As anexamplea lineof
charge of 34 nC was used for this simulation. We calculated
this value from the number of silanol (Si
OH) groups per
unit area on chemically oxidized silica surfaces as reported
in theliterature [28].Thecalculations weremade considering
a density of ∼3 × 10
12
silanols/cm
2
[21,28] distributed over
a line of charge of 7 mm length and 1 mm width with each
silanol group contributing to one elemental charge (1.6 ×
10
−19
C). Although this is just an approximation under ide-
Fig. 6. Simulation of the electrostatic field distribution in the cross section of the c-Si substrate with a uniform line of charge of 34nC on the top surface. A dc
voltage of 1V and an ac voltage of 0 V were used as the experimental parameters.
alized conditions (all silanols protonated) the same approach
has been used in other sensor devices [26] with satisfactory
results. Fig. 6 shows the calculated dc electric field distribu-
tion under these conditions. A modification in the charge at
the top silicon surface induces a strong variation in the field
distribution (1 order of magnitude) with respect to the undis-
turbed condition (results not shown) and therefore a change
in the measured electrical properties.
The results of the simulations and the following assump-
tions were used in the model:
• The interface states at the metal–semiconductor junction
donotaffecttheresponse.Ajunction capacitanceispresent
at each electrical contact and its value remains constant at
the given excitation frequency [24].
• The porous layer is modeled as a composite material made
of alternating pores (or void space) and crystalline silicon
rods with bulk silicon properties.
• The electric field (E) and the current density (J) reach the
porous layer.
• The infiltration of the porous layer with materials of dif-
ferent physical properties produces a change in the width
of the depletion region of the c-Si rods and a change in
dielectric constant of the void space.
• The PSi layer can be considered as a charged layer in con-
tact with thec-Si substrate. Changes in thecharge distribu-
tion within the porous layer extend into the c-Si substrate.
352 M. Archer et al. / Sensors and Actuators B 106 (2005) 347–357
Fig. 7. Schematic section of the sensor showing a PSi layer composed of
void space or pores and c-Si rods, and the c-Si substrate. Each element in
the porous layer is modeled as a parallel capacitor–resistor element, C
pore
|| R
pore
for the pores and C
rod
|| R
rod
for the c-Si rods. The c-Si substrate is
represented by G
subs
and C
junct
is the metal-silicon junction capacitance at
the contactthat remains constant. The fieldstrength hasa maximum value at
the substrateand gradually reduces towards the porous layer. Theequivalent
circuit is shown on the right.
Fig. 7 shows a schematic representation of a section of the
PSi device composed of pores, c-Si rods and a c-Si substrate.
In the porous layer the pores and the rods are modeled as
impedances composed of a parallel capacitor–resistor (RC)
element. Z
pore
(C
pore
|| R
pore
) accounts for the pores and Z
rod
(C
rod
|| R
rod
) for the c-Si rods. The c-Si substrate is rep-
resented by Z
subs
(G
subs
) and two junction impedances at
the contacts sites Z
junc
(C
junct
). The equivalent impedance is
given by:
Z
eq
=
[(Z
subs
)(Z
pore
+ Z
rod
)]
Z
subs
+ Z
pore
+ Z
rod
+ 2Z
junct
(1)
In addition, C
rod
∝ 1/W
d
, C
pore
∝ ε, and G
subs
∝ (aN
A
),
where W
d
represents the width of the space charge region,
N
A
the number of carriers per cm
3
and a the conductive c-Si
channel width. When the pores are empty, R
pore
is infinite so
no current flows through. Conduction in the c-Si rods of the
porous layer does not depend solely on the doping density
(N
A
) but also on the presence of a depletion layer, the ma-
jority carrier distribution underneath it and the orientation of
the interconnected crystalline silicon rods with respect to the
current paths.We have evaluatedthis effectinself-supporting
layerswiththesamecontactgeometry.Inthis casetheelectric
fieldwasconfined completelyintheporouslayer.A reference
conductance valueof 60–100nShas beenmeasured whenthe
pores are empty. In our devices, PSi is attached to the sub-
strate, the electric field in the porous layer is thus weaker and
itsinfluenceonthe measuredconductivityisminimal.Indeed,
we measure a higher reference conductance between 0.1 and
0.2 mS. This change in magnitude is due to the presence of
the c-Si substrate and the metal–semiconductor contact. The
model can therefore be further simplified by neglecting R
rod
and R
pore
and considering only C
pore
and C
rod
in the porous
layer impedance. It is also worthy to clarify that a Schot-
tky barrier is considered at the metal–semiconductor contact.
This is based on calculations of the difference in the work
functions between silver contact and the low-doped p-type
c-Si. This assumption is difficult to address experimentally
since the measured conductance includes the contribution of
the c-Si substrate and not only that of the junction.
When the PSi layer is infiltrated with charged molecules
the electricaldouble layer changes.Charge redistributionand
changes in the dielectric constant take place. Fig. 8 shows a
schematic of the effect produced by positive charge on the
surface and the simplified electrical equivalent circuit. The
molecule’s charge on the surface changes the width of the
space charge region (W
d
) and the majority carrier distribu-
tion underneath it, which in turn influences C
rod
while the
change in dielectric constant modifies C
pore
. Majority car-
rier redistribution in the c-Si substrate and a reduction of the
width of the conduction channel (a) modify G
subs
.
4. Results and discussion
4.1. Response to polar molecules
Fig. 9 shows the real-time evolution of the normalized ca-
pacitance (C) and conductance (G) of the sensor after expo-
sure to10l of chloroform,acetone,ethanol, andacetonitrile
at room temperature. The device’s response is different for
each solvent and suggests that they can be identified by at
least three parameters: magnitude, sign, and duration of the
response (related to the evaporation rate of the solvent). The
reversibility of the response with ethanol and acetone is con-
sistent with the reported literature [12,29] for luminescent
PSi. In Table 2, we present for each solvent the maximum
Fig. 8. Schematic representation of the effect induced by the presence of a
positive charge on the surface of the porous layer. The space charge region
width (W
d
) increases within the crystalline silicon rod and active carriers
(N
A
) are redistributed below the space charge region. The width of the con-
ductance channel a is reduced as a result of the increased depletion region.
The simplified electricalequivalent circuit ofthemodel is shownon the right
along with the change of each variable.
M. Archer et al. / Sensors and Actuators B 106 (2005) 347–357 353
Fig. 9. Real-time capacitance (C) and conductance (G) measurements of individual porous silicon sensors upon exposure to (a) chloroform, (b) acetone, (c)
ethanol, and (d) acetonitrile. In each case 10 l of the solvent was added at a time indicated by the black arrow.
change in capacitance (%C) and conductance (%G) with
respect to reference. A negative (positive) value corresponds
to a reduction (increase) below (above) the reference value.
Fig. 10 shows that the results of Table 2 are correlated with
the dielectric constant.
According to the SCRM model infiltration of the pores
with a different material changes C
pore
. We need to explain
why chloroform,ethanol andacetone producea negative shift
with respect to reference. If the only variable involved in the
response was C
pore
then as the solvent penetrates the pores a
reduction in the capacitance would never be observed. This
suggests that a mechanism other than pore filling needs to
be considered and that the other physical properties (water
solubility and dipole moment) of the molecules affect C
rod
,
specifically via the electrical double layer as described ear-
lier. The four polarsolvents evaluated in this partofthestudy
possess different degrees of water solubility and a dielectric
constant larger than three. The water solubility influences
the adsorption on the surface and the value of the dielectric
constant the type of polarizability. For a dielectric constant
Table 2
Maximum percentage changes in capacitance (%C) and conductance
(%G) with respect to the reference value for the polar molecules tested
Solvent (%C)(%G)
Chloroform −44 −46
Acetone −13 −21
Ethanol −7 −10
Acetonitrile 53 37
A negative sign indicates a reduction of the variable below the reference
value.
below 2.5, molecules exhibit only electronic polarizability
and, above this value, a certain degree or orientation polar-
ization (for example water). The polarizability plays a role in
the response since it defines the orientation of the molecule
with respect to the electric field and the surface and therefore
its effect in the space charge region.
In order to explain the effects in both the pores and the
rods, we will first consider the simplified model presented
in Fig. 8. The porous silicon capacitance (C
PSi
) consists of a
series arrangement of C
pore
and C
rod
, therefore:
C
PSi
=
C
rod
C
pore
C
pore
+ C
rod
(2)
Fig. 10. Measured change in capacitance (%C) and conductance (%G)
with respectto thereference value as a function of the dielectric constant for
chloroform, acetone, ethanol and acetonitrile.
354 M. Archer et al. / Sensors and Actuators B 106 (2005) 347–357
If C
rod
C
pore
then C
PSi
≈ C
rod
and, since C
rod
decreases
as a result of the increase in W
d
, then the change will be
negative (−C
PSi
). If C
rod
C
pore
then C
PSi
≈ C
pore
and
the change will be positive (+C
PSi
). Chloroform, acetone
and ethanol produce a decrease in capacitance. Out of these
three molecules chloroform is the less water soluble with the
lowest dipole moment, which suggests that it is interacting
weakly with the surface and that the orientation of the dipole
array is inducing an effect “felt” as a large positive charge
that depletes the c-Si rod making C
rod
C
pore
. As the water
solubility increases along with the dipole moment and the
dielectric constant, the positive charge-like effect is reduced
making C
rod
≈ C
pore
. Acetonitrile, which has a larger dipole
moment,largerdielectricconstantanda highwatersolubility,
induces a positive shift by making C
rod
C
pore
. The mod-
ulation of the space charge region width in the c-Si rods is
similar to what has been reported for silicon nanowires [29]
and is strongly dependent on the surface charge.
Fig. 11presentsasimplesimulationofthe modelvariables
over time for molecules acting as a positive and a negative
charge on the surface. Both the time scale and the values
shown are arbitrary values for illustrative purposes only. In
these simulationswe havefurther assumedthat theequivalent
capacitance (C
eq
) is given by the porous silicon capacitance
(C
PSi
) in series with a fixed junction capacitance (C
junct
)at
each contact and that the equivalent conductance (G
eq
)is
given by the substrate conductance (G
subs
). The conductance
is considered to be directly proportional to the number of
carriers in the c-Si substrate (N
A
) as well as the width of the
channel (a). Starting with a dry device (air in the pores) three
stages in the response are identified: exposure (addition of
the solvent), stabilization (complete infiltration of the pores)
and evaporation (drying of the pores). According to these
simulations the effect of acetonitrile is that of a negatively
charged molecule, which produces the response in Fig. 11b
whilechloroform, ethanolandacetone actasa positivecharge
(Fig. 11a).
As it can be seen in Fig. 9, neither chloroform nor ace-
tonitrile return to the reference value after the solvent has
evaporated, even after flushing the chamber with nitrogen.
This suggests that a chemical reaction has taken place, in-
Fig. 11. Effect of the modification in the model parameters C
pore
, C
rod
, and C
PSi
in the equivalent capacitance (C
eq
) and conductance (G
eq
) when molecules
acting as a positive charge (a) and a negative charge (b) interact with the surface. The exposure phase corresponds to the initial contact with the organic solvent
that infiltrates into the layer. The stabilization period corresponds to the complete infiltration of the layer. As the solvent evaporates the signal returns to the
reference value.
troducing states that act as a charged layer at the surface.
The effect of chloroform on oxidized PSi is not documented
but in hydrogen-terminated silicon (no oxide) other chlori-
nated hydrocarbons produce a reversible effect in its lumi-
nescence [30]. Thedifference in reversibility suggeststhat an
irreversible modification of the oxidized surface takes place.
Similar considerations apply for acetonitrile, which has not
been studied on oxidized surfaces but can be chemically ad-
sorbed on clean silicon surfaces [31]. The relevance of the
oxide properties on the sensitivity of PSi has been widely in-
vestigated by Sailor and coworkers [13]. It is also interesting
to notice that acetonitrile and chloroform have the highest
ionization potential of the four solvents tested (12.194 and
11.37 eV, respectively). The energy of chemisorption is the
difference between the work function of the semiconductor
and the ionization energy of the molecule [32]. If chemisorp-
tion is taking place then changes in the surface charge influ-
ence the response of the device. When the samples initially
exposedtoacetonitrileweresubsequentlyexposedtoethanol,
no response was observed which confirms that exposure to
acetonitrile produced a permanent surface modification. This
wasfurther confirmedwhenthe sensorswerereexposedto the
solventfor severaltimes allowingtherecovery ofthe baseline
between additions. For ethanol and acetone, in which the re-
sponse was reversible, the variation of the maximum change
in capacitance (%C) andconductance(%G) was no more
than ±1% with a maximum shift in the baseline of 5% over
a 20min timeline. For acetonitrile and chloroform, the re-
sponse is not reversible therefore the same sensor could not
be tested but the reproducibility of the response in different
sensors was good (±5%).
4.2. Influence of the channel width (a) in the response
It was mentioned before that the value of G
subs
depended
on the change in the space charge region width (W
d
)by
changing the majority carrier distribution underneath and
the width of the conduction channel (a). Neither of these
two variables can be probed directly or their independent
contribution extracted from the experimental value of
conductance. Nevertheless the channel width can be also
M. Archer et al. / Sensors and Actuators B 106 (2005) 347–357 355
Table 3
Maximumpercentagechanges inconductance(%G)with respecttotheref-
erence value for PSi layers of different thicknesses upon addition to ethanol
PSi thickness (m) (%G)
10 −6
20 −7
40 −10
60 −15
80 −13
100 −12
changed by increasing the porous silicon thickness, which
in turn reduces the thickness of the c-Si substrate. Although
this is a geometric modification of the channel rather than
a space charge width related in can provide some insight
into the relevance of this variable in the response. For this
purpose, PSi layers of different thicknesses varying from 10
to 100 m were tested using ethanol. The experiments were
done as explained in Section 2.2 and the percentage change
in conductance (%G) was measured with respect to the
reference value. The results are presented in Table 3.
These results show a correlation of a decreasing con-
ductance (larger – %G) as the channel becomes narrower
(thicker PSi layers) up to 80 m. This supports our assump-
tion that G
subs
is affected by the channel width (a). It is
likelythatthe maximumresponse occurswithin thefirst 50or
60 m PSi thickness and after this depth has been infiltrated
the sensitivity of W
d
to any further charge compensation is
reduced. At this point the effect of W
d
and the carrier dis-
tribution may be defining the limits of sensitivity rather than
the geometry changes.
4.3. Response to water
It has been demonstrated that water increases the conduc-
tance [8,33] and capacitance [15,34] of PSi. This is the basis
for PSi humidity sensors. A change in dielectric constant,
dipole moment and possible chemisorption or physioadsorp-
tion on the surface of porous silicon has been proposed to
explain the response. An additional characteristic is the in-
trinsic dipolemoment of thewater moleculethat confers pure
orientation polarizability.
Fig. 12. Real-time capacitance (C) and conductance (G) measurements of the porous silicon sensor upon exposure to water. (a) The first part of the response
with a coupled behavior in capacitance (C) and conductance (G) is observed over the first minutes of the response. (b) Over a large period of time the two
responses are different.
TheexperimentalresultsshowninFig. 12canbeexplained
with the SCRM model and the factors previously mentioned.
We identified two phases intheresponse. The first one shown
in Fig. 12a is characterized by a reduction in conductance
coupled with a reduction in capacitance. In the second phase
of the response the capacitance increases slowly above the
reference value while the conductance remains uncoupled
from this behavior as shown in the complete response in
Fig. 12b.
The firstpart oftheresponseshown inFig. 12aisproduced
by apositivechargeon the surface. Thisis in accordancewith
the observations made by Moeller et al. [33], which suggest
that during water adsorption states behaving as acceptors can
be introduced changing the surface charge. In our model this
in turn changes the characteristics of the electrical double
layer and therefore the space charge region. Charge redistri-
bution in the c-Si rods decreases C
rod
and G
subs
is modified
as majority carriers accumulate below the space charge re-
gion and the conductive channel width (a) is reduced. After
adsorption on the surface has reached a steady state C
rod
and G
subs
remain constant and the increase in capacitance is
produced by C
pore
. Since the permittivity of molecules with
orientation polarization decreases at high frequencies [35]
C
pore
changes in such way that C
rod
C
PORE
, making C
PSi
≈ C
pore
and producing a positive signal (+C
PSi
).
4.4. Response to non-polar molecules
Schechter and coworkers [8] reported an enhancement of
PSi conductivity withexposure tomoleculeswith zero dipole
moment. They suggested that the conductivity enhancement
could be related to other factors aside from the dipole mo-
ment. To investigate this possibility we performed experi-
ments using benzene (µ =0D) and toluene (µ = 0.43D).
Both exhibit a very low water solubility and given the value
of their dielectric constant (ε = 2.27 for benzene, ε = 2.38 for
toluene) the polarization of these molecules is purely elec-
tronic. The characteristic response in capacitance and con-
ductance along with the measured change in these variables
is shown in Fig. 13.
Since we do no have an independent way to probe the
influence of the field on the molecule inside the pores the
356 M. Archer et al. / Sensors and Actuators B 106 (2005) 347–357
Fig. 13. Real-time capacitance (C) and conductance (G) measurements of porous silicon sensors upon exposure to (a) benzene and (b) toluene. In each case
10 l of the solvent was added as indicated by the black arrow.
results will be explained based on the predictions of the
SCRM model. The hydrophobicity (low water solubility) of
toluene and benzene and their low dielectric constant ex-
plain the small change in capacitance and conductance, and
the sign of the maximum change (indicative of a positive
charge). Assuming that these molecules interact weakly with
the surface, do not produce permanent chemical modifica-
tions (reversibility of the response) and do not have a perma-
nent dipole moment the only parameter left to influence the
response is the electronic polarizability (α). The propagation
of the field inside the structures is orienting the molecules
perpendicular to the pore wall surface and the lack of orien-
tation polarizability eliminates any counteracting effect. The
orientation of the dipole array is “felt” as a positive charge.
According totheSCRMmodel,thiseffectandtheweakinter-
action of the molecule with the surface produce a very small
increase in the space charge region width (W
d
) therefore de-
creasing slightly C
rod
, which impacts on the charge redistri-
bution atthesubstrate (G
subs
). A small changeinC
pore
is also
expecteddue to thelowdielectric constant.These results sug-
gest that the interaction of the molecule with the surface and
the orientationofthe dipoleplaya crucialrolein the response
of the device. Reversibility of toluene and benzene has also
been reported in as anodized luminescent PSi [12,30].
5. Conclusions
The large surface area of porous silicon and the sensitiv-
ity of its surface to charge molecules make it an ideal can-
didate in sensor development. We have evaluated the use of
a new electrical sensing device based on macroporous sili-
con (pore diameter 1-2 m) layers in which the contacts are
made on the backside of the substrate. This approach allows
complete exposure of the surface without the presence of
metallic contacts on the surface. The sensitivity of this de-
vice is not only related to the dipole moment and the dielec-
tric constant of the molecules but also to their interaction
with the surface and the alignment of their dipole. Molecules
with different electrical and chemicalcharacteristicsproduce
a change in magnitude and sign in the capacitance and con-
ductance. To explain our results, we proposed a space charge
region modulation (SCRM) model that considers the effect
of changes in the dielectric constant of the porous silicon
matrix along with the interaction of different molecules with
the surface. The simulations performed consider the simul-
taneous change in dielectric constant and charge distribution
induced bymoleculeswithdifferent propertiesand theresults
obtained are in accordance with our experimental results.
In this paper, we demonstrated the use of our device as
a chemical sensor capable of producing a different response
upon exposure to water, ethanol, acetone, chloroform, ace-
tonitrile, benzene and toluene. The sensitivity to charged
molecules can however extend the use of these devices to
biological applications. We have also demonstrated the use
of oursensor forselectiveand reproducibledetectionof DNA
hybridization in real-time [36].
Acknowledgements
This work was supported in part by a grant from the In-
fotonics Center of Excellence and the sponsors of the Center
for Future Health. M.A. was the recipient of a dermatology
training grant.
References
[1] L.T. Canham, Silicon quantum wire array fabrication by electrochem-
ical and chemical dissolution of wafers, Appl. Phys. Lett. (1990) 57.
[2] V. Lehmann, U. Gosele, Porous silicon formation: a quantum wire
effect, Appl. Phys. Lett. (1991) 58.
[3] C. Cadet, D. Deresmes, D. Villaume, D. Stievenard, Influence of
surface defects on the electrical behavior of aluminum-porous silicon
junctions, Appl. Phys. Lett. 64 (1994) 2827–2829.
[4] V. Lehmann, F. Hofmann, F. Moeller, U. Gruning, Resitivity of
porous silicon: a surface effect, Thin Solid Films 255 (1995) 20–22.
[5] L.A. Balagurov, D.G. Yarkin, E.A. Petrova, Electronic transport in
porous silicon of low porosity made on a p+ substrate, Mater. Sci.
Eng., B 69/70 (2000) 127–131.
[6] J. Rehm, G. McLendon, L. Tsybeskov, P.M. Fauchet, How methanol
affects the surface of blue and red emitting porous silicon, Appl.
Phys. Lett. 66 (1995) 3669–3671.
M. Archer et al. / Sensors and Actuators B 106 (2005) 347–357 357
[7] L. Tsybeskov, P.M. Fauchet, Correlation between photoluminescence
and surface species in porous silicon: Low-temperature annealing,
Appl. Phys. Lett. 64 (1994) 1983–1985.
[8] M. Ben-Chorin, A. Kux, I. Schechter, Adsorbate effects on photolu-
minescence and electrical conductivity of porous silicon, Appl. Phys.
Lett. (1994) 64.
[9] I. Schechter, M. Ben-Chorin, A. Kux, Gas sensing properties of
porous silicon, Anal. Chem. 67 (1995) 3727–3732.
[10] S. Green, P. Kathirgamanathan, Effect of oxygen on the surface
conductance of porous silicon: towards room temperature sensor ap-
plications, Mater. Lett. 52 (2002) 106–113.
[11] J. Rehm, G.L. McLendon, P.M. Fauchet, Conduction and valence
band edges of porous silicon determined by electron transfer, J. Am.
Chem. Soc. 118 (1996) 4490–4491.
[12] T.A. Schmedake, F. Cunin, J.R. Link, M.J. Sailor, Standoff detection
of chemicals using porous silicon “Smart Dust” particles, Adv. Mater.
14 (2002) 1270–1272.
[13] T. Gao, J. Gao, M.J. Sailor, Tuning the response and stability of
thin film mesoporous silicon vapor sensors by surface modification,
Langmuir 18 (2002) 9953–9957.
[14] M. Archer, P.M. Fauchet, Electrical sensing of DNA hybridization
in porous silicon layers, Phys. Stat. Sol. (a) 198 (2003) 503–507.
[15] R.C. Anderson, R.S. Muller, C.W. Tobias, Investigation of porous
silicon for vapor sensing, Sens. Actuat. A A21/A23 (1990) 835–839.
[16] A. Motohashi, M. Ruike, M. Kawakami, H. Aoyagi, A. Kinoshita,
A. Satou, Identification of water molecules in low humidity and pos-
sibility of quantitative gas analysis using porous silicon gas sensor,
Jpn. J. Appl. Phys., Part 1 35 (1996) 4253–4256.
[17] A. Motohashi, M. Kawakami, H. Aoyagi, A. Kinoshita, A. Satou,
Gas identification by a single gas sensor using porous silicon as the
sensitive material, Jpn. J. Appl. Phys., Part 1 34 (1995) 5840–5843.
[18] K. Watanabe, T. Okada, I. Choe, Y. Sato, Organic vapor sensitivity
in a porous silicon device, Sens. Actuat. B 33 (1996) 194–197.
[19] S J. Kim, S H. Lee, C J. Lee, Organic vapour sensing by current
response of porous silicon layer, J. Phys. D: Appl. Phys. 34 (2002)
3505–3509.
[20] H. Foell, M. Christophersen, J. Carstensen, G. Hasse, Formation and
application of porous silicon, Mater. Sci. Eng. R39 (2002) 93–139.
[21] H.H. Okorn-Schmidt, Characterization of silicon surface preparation
processes for advanced gate dielectrics, IBM J. Res. Dev. 43 (1999)
351–365.
[22] A. Nakajima, T. Itakura, S. Watanabe, N. Nakayama, Photolumi-
nescence of porous Si, oxidized then deoxidized chemically, Appl.
Phys. Lett. 61 (1992) 46–48.
[23] U. Frotscher, U. Rossow, M. Ebert, C. Pietryga, W. Richter, M.G.
Berger, R. Arens-Fischer, H. Munder, Investigation of different ox-
idation processes for porous silicon studied by spectroscopic ellip-
sometry, Thin Solid Films 276 (1996) 36–39.
[24] M. El Yacoubi, R. Evrand, N.D. Nguyen, N. Schmeits, Electri-
cal conduction by interface states in semiconductor heterojunctions,
Semicond. Sci. Technol. 15 (2002) 341–348.
[25] Chemical Rubber Company Handbook of Chemistry and Physics,
80th ed., Cleveland, OH, 2000.
[26] J. Fritz, E.B. Cooper, S. Gaudet, P.K. Sorger, S.R. Manalis, Elec-
tronic detection of DNA by its intrinsic molecular charge, Proc. Natl.
Acad. Sci. U.S.A. 99 (2002) 14142–14146.
[27] A. Ramos, H. Morgan, N.G. Green, A. Castellanos, Ac electroki-
netics: a review of forces in micoroelectrode structures, J. Phys. D:
Appl. Phys. 31 (1998) 2338–2353.
[28] Y. Dong, S.V. Pappu, Z. Xu, Detection of local density distribution
of isolated silanol groups on planar silica surfaces using nonlinear
optical molecular probes, Anal. Chem. 70 (1998) 4730–4735.
[29] Y. Cui, Q. Wei, H. Park, C.M. Lieber, Nanowire nanosensors for
highly sensitive and selective detection of biological and chemical
species, Science 293 (2001) 1289–1292.
[30] M.J. Sailor, in: L.T. Canham (Ed.), Properties of Porous Silicon,
Institute of Electrical Engineers, London, UK, 1997.
[31] F. Tao, Z.H. Wang, M.H. Quiao, Q. Liu, W.S. Sim, G.Q. Xu, Cova-
lent attachment of acetonitrile on Si(1 0 0) through Si
C and Si
N
linkages, J. Chem. Phys. 115 (2001) 8563–8569.
[32] A. Many, Y. Goldstein, N.B. Grover, Semiconductor Surfaces, Wiley,
New York, 1965.
[33] F. Moeller, M. Ben-Chorin, F. Koch, Post-treatment effects on elec-
trical conduction in porous silicon, Thin Solid Films 255 (1995)
16–19.
[34] Z.M. Rittersma, A. Splinter, A. Boedecker, W. Benecke, A novel
surface-micromachined capacitive porous silicon humidity sensor,
Sens. Actuat. B 68 (2002) 210–217.
[35] S J. Kim, J Y. Park, S H. Lee, S H.J. Yi, Humidity sensors using
porous silicon with mesa structure, Phys. D: Appl. Phys. 33 (2000)
1781–1784.
[36] M. Archer, M. Christophersen, P.M. Fauchet, Macroporous silicon
electrical sensor for DNA hybridization detection, Biomedical Mi-
crodevices 6 (3) (2004) 203–224.
Biographies
Marie Archer received her Masters Degree in Biomedical Engineering
from the University of Rochester in May 2003. The topic of her Ph.D.
research was the characterizat
ion of electrical porous silicon based sensors
for their use in biodetection. She carried out her research at the Center
for Future Health under the supervision of Professor Philippe Fauchet
and received her Ph.D. degree in May 2004.
Marc Christophersen received his Masters Degree in Engineering in
November 1998 from the Christian-Albrechts University in Kiel, Ger-
many. The same year, he started his Ph.D. research on anodic pore for-
mation in semiconductors at the Department of Materials Science. Dur-
ing this period, he worked as an invited scientist at the University of
Florida under the supervision of Professor Dr. Hummel. He received his
Ph.D. degree in engineering (Doctor in Engineering) on June 2002 and
was awarded “summa cum laude” for his research work. Marc Christo-
phersen is a co-author of over 40 publications in scientific journals and
holds three German patents for semiconductor structuring. He worked
for Professor Dr. Fauchet’s group at the University of Rochester from
July 2002 till September 2003 as a postdoctoral fellow at the Center for
Future Health. His research at University of Rochester involved the use
of porous semiconductors for photonic crystals, MEMS structuring and
biosensor applications.
Professor Philippe Fauchet has 20 years of experience in semiconductor
optoelectronics, ultrafast phenomena and lasers, nanoscience and nan-
otechnology with silicon, biosensors, electroluminescent materials and
devices, and optical diagnostics. His research on porous Si and nanoscale
Si, and applications to LEDs and displays, biosensors, and nanoscale Si
electronic devices, has led to dozens of plenary, invited and contributed
publications, and numerous invited conference presentations and seminars
in North America, Japan and Europe. He chaired dozens of symposia and
conferences devoted to various topics in his fields of interest He has also
given many tutorials and short courses. Dr. Fauchet received an IBM
Faculty Development Award in 1985, an NSF Presidential Young Inves-
tigator Award in 1987, an Alfred P. Sloan Research Fellowship in 1988,
the Princeton University Alfred Rheinstein Class of 1911 Faculty Award
in 1888, and the 1990–1993 Prix Guibal & Devillez for his work on
porous silicon. Dr. Fauchet is the author nearly 300 publications, and has
edited five books. He is a Fellow of the Optical Society of America, the
American Physical Society, and the Institute of Electrical and Electronic
Engineering, and a member of the Materials Research Society.