- Trang chủ >>
- Khoa Học Tự Nhiên >>
- Vật lý
synthesis and high gas sensitivity of tin oxide nanotubes
Bạn đang xem bản rút gọn của tài liệu. Xem và tải ngay bản đầy đủ của tài liệu tại đây (937.62 KB, 5 trang )
A
vailable online at www.sciencedirect.com
Sensors and Actuators B 131 (2008) 313–317
Synthesis and high gas sensitivity
of tin oxide nanotubes
G.X. Wang
a,b,∗
, J.S. Park
b
,
M.S. Park
b
, X.L. Gou
a,b
a
School of Mechanical, Materials and Mechatronic Engineering, University of Wollongong, NSW 2522, Australia
b
Institute for Superconducting & Electronic Materials, University of Wollongong, NSW 2522, Australia
Received 24 August 2007; received in revised form 14 November 2007; accepted 14 November 2007
Available online 24 November 2007
Abstract
Semiconductor tin oxide (SnO
2
) nanotubes have been synthesised in bulk quantities using a sol–gel template (AAO membrane) synthetic
technique. The morphology and crystal structure of SnO
2
nanotubes were characterised by a field emission scanning electron microscope (FESEM)
and a transmission electron microscope (TEM). The as-prepared SnO
2
nanotubes are polycrystalline with an outer diameter of 200 nm, an inner
diameter of about 150 nm and a length extending to tens of micrometers. SnO
2
nanotube sensors exhibited high sensitivity towards ethanol gas.
© 2007 Elsevier B.V. All rights reserved.
Keywords: Tin oxides; Nanotubes; Sol–gel; Gas-sensors; Nanocrystallites
1. Introduction
One-dimensional (1D) nanostructures including nanotubes,
nanowires, and nanoribbons have attracted both intensive and
extensive research, which can be mainly attributed to their
unique chemical and physical properties, and their intriguing
technological applications [1,2]. In particular, 1D semicon-
ductor nanostructures provide building-blocks for fabricating
functional nanoscale electronic, optoelectronic, photonic, chem-
ical and biomedical devices based on the bottom-up paradigm
[3–7].
Among all the potential applications, nanoscale chemical and
biological sensors are generally considered as one of the impor-
tant areas for nanotechnology to enter into practical applications
[8]. The high surface-to-volume ratio of 1D nanostructures
induces extremely high sensitivity to adsorbed chemical or bio-
logical species on the surface of nanosensors. Lieber et al. have
developed silicon nanowire sensors and implemented them as
the real-time sensors for detecting pH and biological species
∗
Corresponding author at: School of Mechanical, Materials and Mecha-
tronic Engineering, University of Wollongong, Northfield Avenue, NSW 2522,
Australia. Fax: +61 2 42215731.
E-mail address: (G.X. Wang).
[9]. The principle of the Si nanowire sensors is based on the
conductance (surface charge) change caused by protonation and
deprotonation associated with the adsorbed molecular species.
Single and multiple In
2
O
3
nanowire sensors have shown high
sensitivity to NO
2
and NH
3
gas [10,11]. SnO
2
is a wide-
bandgap (3.6 eV) semiconductor. The electronic conductivity
of SnO
2
is significantly influenced by the effects on its sur-
face states of molecular adsorption. It has been widely explored
as an effective gas sensor, traditionally in the forms of thin or
thick films with low sensitivity and long response time [12].
Recently, SnO
2
nanobelts have been tested for their sensitiv-
ity to environmental pollutants such as CO and NO
2
[13].
Photochemical SnO
2
nanoribbon sensors have been fabricated
for detecting low concentration of NO
2
at room temperature
under UV light [14]. Polycrystalline SnO
2
nanowire sensors
were also developed for sensing ethanol, CO and H
2
gas [15].
SnO
2
nanohole array sensors exhibited reversible response to
H
2
[16].
Herein, we describe the synthesis of polycrystalline SnO
2
nanotubes using the sol–gel template method, and the fabrica-
tion of SnO
2
nanotube sensors. Due to their one dimensional
and tubular structure, SnO
2
nanotube sensors exhibited high
sensitivity and quick response time for detecting ethanol and
ammonia gas.
0925-4005/$ – see front matter © 2007 Elsevier B.V. All rights reserved.
doi:10.1016/j.snb.2007.11.032
314 G.X. Wang et al. / Sensors and Actuators B 131 (2008) 313–317
2. Experimental
Anodic aluminium oxide (AAO) membranes (Whatman,
200 nm pore, 60 m in thickness, and 47 mm in diameter)
were used as the template for preparing SnO
2
nanotubes. The
chemicals used were tin(II) chloride dehydrate (SnCl
2
·2H
2
O,
Aldrich, A.C.S. reagent), sodium hydroxide (Aldrich, 98%) and
hydrochloric acid (36%, Merck). SnO
2
nanotubes were synthe-
sised via a sol–gel and sintering process following these steps:
(i) 3.38 g SnCl
2
, 4.7 ml ethanol and 0.3 ml HCl were mixed
together and aged for 24 h, during which time the colour of the
solution changed from white to pale yellow and finally form-
ing a transparent and highly viscous gel. Then, 0.3 ml deionised
water was added to the as-prepared gel to form a solution; (ii)
the AAO templates were impregnated by vacuum suction. The
solution was forced to pass through the pores of the template
and adhere on the pore walls; (iii) the impregnated template was
dried at 100
◦
C and then sintered at 500
◦
C for 3 h to convert the
tin hydroxide to tin oxide; (iv) after sintering, the AAO mem-
brane was dissolved in 6 M NaOH solution. The undissolved
SnO
2
nanotubes were collected and washed through a filter-
ing process to remove Na
+
and Al
3+
. The crystal structures and
morphologies of the SnO
2
nanotubes were characterised using
X-ray diffraction (XRD, Philips 1730), field emission scanning
electron microscopy (FE-SEM, JEOL JSM-6700F) and trans-
mission electron microscopy (TEM, JEOL 2011). The specific
surface area was measured by the Brunauer–Emmett–Teller
(BET) method at 77 K using a NOVA 1000 high-speed gas
sorption analyzer (Quantachrome Corporation, USA). The gas
sensing properties of the as-prepared SnO
2
nanotubes and SnO
2
nanopowders (61 nm in average particle size (APS), Nanostruc-
tured & Amorphous Materials Inc., USA) were measured using
a WS-30A gas sensor measurement system. SnO
2
nanotubes and
nanopowders were mixed with polyvinyl acetate (PVA) binder
to form a slurry, and then pasted on to ceramic tubes (2 mm in
diameter) between Au electrodes, which were connected with
four platinum wires. The fabricated sensors were fitted into the
gas-sensing measurement apparatus. Given amounts of ethanol
and ammonia gas were injected into the testing chamber by a
micro-syringe injector. The gas sensing response was defined as
the ratio R
air
/R
gas
, where R
air
and R
gas
are the electrical resis-
tance of the sensors in air and in gas, respectively. The gas
sensing measurement was carried out at a working temperature
of 200
◦
C.
3. Results and discussion
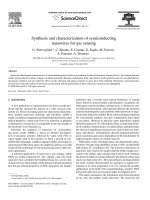
Fig. 1 shows the X-ray diffraction patterns of SnO
2
nanopow-
ders and SnO
2
nanotubes. All diffraction lines can be indexed
to the tetragonal rutile phase (JCPDS #41-1445). It should be
noted that SnO
2
nanotubes have much broader diffraction peaks
and lower diffraction intensities than that of SnO
2
nanopowders,
indicating a much small crystal size for the nanotubes. The aver-
age crystal size of SnO
2
nanotubes was calculated to be about
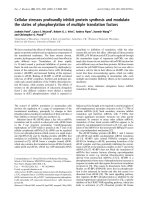
15 nm using the Scherrer equation d = κλ/β cos θ. The general
morphology of SnO
2
nanotubes was observed by FE-SEM and is
shown in Fig. 2. The as-prepared SnO
2
nanotubes have lengths of
Fig. 1. X-ray diffraction patterns of SnO
2
nanotubes and nanopowders.
a few micrometers. The SnO
2
nanotubes were partially broken,
which could have been induced during the sintering process or
the subsequent filtering process. The inset in Fig. 2 is a top view
of the SnO
2
nanotube bundle, from which we can clearly see the
hollow and tubular structure with an outer diameter of 200 nm.
We measured the BET surface areas of commercial nanosize
SnO
2
powders and as-prepared SnO
2
nanotubes. SnO
2
nano-
size powders have a BET surface area of 15.2 m
2
/g, while SnO
2
nanotubes have a surface area of 45.6 m
2
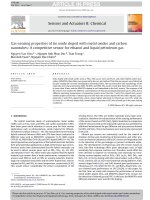
/g. The crystal structure
of the SnO
2
nanotubes was further analysed by TEM and high
resolution TEM (HRTEM). A general TEM image of a SnO
2
nanotube is shown in Fig. 3(a). The SnO
2
nanotubes are poly-
crystalline, with the small nanosize crystals bonded together
through the sintering process. Selected area electron diffrac-
tion (SAED) was performed on the individual SnO
2
nanotubes
(the inset in Fig. 3(a)). The indexed ring patterns confirmed the
tetragonal crystal structure of the SnO
2
nanocrystals that form
the nanotube. Fig. 3(b) shows a high resolution TEM image of
a SnO
2
nanotube, in which the individual crystal sizes are in
Fig. 2. FESEM image of SnO
2
nanotubes. The inset is a top view of SnO
2
nanotube bundle.
G.X. Wang et al. / Sensors and Actuators B 131 (2008) 313–317 315
Fig. 3. (a) TEM image of a single SnO
2
nanotube. Inset: selected area electron-
diffraction pattern. (b) HRTEM image of a portion of a SnO
2
nanotube.
the range of 10–20 nm. The lattice spacing was measured to be
0.47 nm.
SnO
2
nanotubes were tested as chemical sensors of ethanol
and ammonia gas. As a comparison, the sensing properties of
SnO
2
nanopodwers (APS: 61 nm) were also tested. The gas sen-
sitivities were measured in air at 25
◦
C under a relative humidity
(RH = 40–50%). Through pre-testing, we first determined that
the optimised sensor working temperature was 200
◦
C, at which
both SnO
2
nanotubes and SnO
2
nanopowders exhibited an opti-
mal performance. Subsequently, all sensing measurements were
conducted at this working temperature. Fig. 4(a) shows the
real-time gas sensing response towards ethanol vapor for SnO
2
nanotube and nanopowder sensors. The ethanol vapor concen-
trations were varied. Initially, the SnO
2
nanotube sensor showed
similar response to the SnO
2
nanopowders at the very low
concentration (10 ppm). However, as the ethanol vapor concen-
tration increased, the SnO
2
nanotube sensor demonstrated larger
response. In general, on increasing the gas concentrations, the
response increase proportionally. Fig. 4(b) shows the gas sens-
ing response versus the ethanol concentrations in the range of
10–1000 ppm. It should be noted that SnO
2
nanotubes have more
than 1.5 times larger response than the corresponding nanopow-
ders. This result is comparable to the previously reported ethanol
Fig. 4. (a) Real-time sensing response to ethanol gas in air. Inset: equivalent
electrical circuit for SnO
2
nanopowder sensor and SnO
2
nanotube sensor. (b)
Sensing response vs. ethanol vapor concentration.
gas sensing performance using nanocrystalline SnO
2
powders
with an average crystallite size of 8 nm [17].
By analysing the transient response characteristics of SnO
2
nanotube and nanopowder sensors, we found that the response
time to gas on and recovery time to gas off take less than 5 s.
When examining the shape of the response curves in Fig. 4(a), we
can see that the SnO
2
nanotube sensor required more response
time to reach its maximum value at all concentrations when the
gas was on; similarly, there was also a delay before recovery
when the gas was off. This retard response behavior of SnO
2
nanotube sensor is typically related to the small crystal size and
1D structure of the nanotubes. It can be explained by using the
equivalent electric circuit models shown in the inset in Fig. 4(a).
SnO
2
nanopowders could be considered as a simple resistor
because individual crystals are loosely agglomerated. There-
fore, the SnO
2
nanopowder sensor shows straight lines in the
response profiles. On the other hand, the SnO
2
nanotubes can be
modeled as a capacitor connected in parallel with a resistor and
then serially connected with another resistor. The capacitance
behavior mainly comes from the grain boundaries between the
tiny nanosize crystals that form the nanotubes [18]. This model
316 G.X. Wang et al. / Sensors and Actuators B 131 (2008) 313–317
Fig. 5. Real-time sensing response to ammonia gas in air.
can satisfactorily explain the retarded response behavior of the
SnO
2
nanotube sensor.
The responses towards ammonia are shown in Fig. 5. When
attempting to detect ammonia gas, the SnO
2
nanopowder sensor
showed no response at low concentration, and a slight change
in the resistance at high concentrations, but the response was
unstable and had serious fluctuations. In contrast, the SnO
2
nan-
otube sensor was active even at 10 ppm. Its response towards
ammonia increased proportionally with the increasing gas con-
centration. However, the overall sensing response performance
towards ammonia gas is much lower than that to ethanol gas for
both SnO
2
nanosize powders and nanotubes.
The response curves in Figs. 4 and 5 clearly indicated a
sensing mechanism that could be described as gas surface
chemisorption and electron acceptance, resulting in a decrease
in the sensor resistance. SnO
2
is an n-type wide band gap
semiconductor. Its electronic conduction originates from point
defects, which either are oxygen vacancies or foreign atoms that
act as donors or acceptors. In the ambient environment, SnO
2
nanocrystals are expected to adsorb both oxygen and mois-
ture, in which moisture may be adsorbed as hydroxyl groups.
The adsorbed O
2−
and OH
−
groups trap electrons from the
conduction band of SnO
2
nanocrystals, inducing the formation
of a depletion layer on the surface of the SnO
2
nanocrystals
[19]. When exposed to ethanol vapour, CH
3
CH
2
OH molecules
are chemisorbed at the active sites on the surface of the SnO
2
nanocrystals. These ethanol molecules will be oxidised by the
adsorbed oxygen and lattice oxygen (O
2−
)ofSnO
2
at the sensor
working temperature. During this oxidation process, electrons
will transfer to the surface of the SnO
2
nanocrystals to lower
the number of trapped electrons, inducing a decrease in the
resistance. A similar mechanism should be ascribed to the detec-
tion of NH
3
gas because NH
3
is commonly considered to work
as a reducing agent and to donate electrons [20]. Therefore,
when exposed to NH
3
molecules, a SnO
2
sensor responds with
the increased conductivity. SnO
2
nanotubes consist of small
nanocrystals joined together into 1D tubular structure, resulting
in many more active sites for gas chemisorption. In addition,
both the inner and outer walls of SnO
2
nanotubes can adsorb a
large number of gas molecules. Consequently, SnO
2
nanotubes
show an enhanced sensitivity compared to the corresponding
nanopowders.
4. Conclusions
In summary, polycrystalline SnO
2
nanotubes have been pre-
pared via the sol–gel template method. FE-SEM observation
shows the tubular 1D nanostructure. TEM and HRTEM analy-
sis confirmed the polycrystalline nature and tetragonal crystal
structure of the SnO
2
nanotubes. The SnO
2
nanotubes exhibited
an enhanced sensitivity to ethanol gas.
Acknowledgements
This work was supported by the Australian Research Council
(ARC) through ARC Discovery project “Synthesis of nanowires
and their application as nanosensors for chemical and biological
detection” (DP0559891).
Appendix A. Supplementary data
Supplementary data associated with this article can be found,
in the online version, at doi:10.1016/j.snb.2007.11.032.
References
[1] C.M. Lieber, Nanoscale science and technology: building a big future from
small things, MRS Bull. 28 (2003) 486–491.
[2] Y.N. Xia, P.D. Yang, Y.G. Sun, Y.Y. Wu, B. Mayers, B. Gates,
Y.D. Yin, F. Kim, H.Q. Yan, One-dimensional nanostructures: syn-
thesis, characterization, and applications, Adv. Mater. 15 (2003) 353–
388.
[3] Y. Huang, X.F. Duan, Q.Q. Wei, C.M. Lieber, Directed assembly of one-
dimensional nanostructures into functional networks, Science 291 (2001)
630–633.
[4] Y. Huang, X.F. Duan, Y. Cui, L.J. Lauhon, K.H. Kim, C.M. Lieber, Logic
gates and computation from assembled nanowire building blocks, Science
294 (2001) 1313–1317.
[5] X.F. Duan, Y. Huang, C.M. Lieber, Nonvolatile memory and pro-
grammable logic from molecule-gatednanowires, Nano Lett. 2(2002)487–
490.
[6] M.S. Gudiksen, L.J. Lauhon, J.F. Wang, D.C. Smith, C.M. Lieber, Growth
of nanowire superlattice structures for nanoscale photonics and electronics,
Nature 415 (2002) 617–620.
[7] X.F. Duan, Y. Huang, Y. Cui, J.F. Wang, C.M. Lieber, Indium phosphide
nanowires as building blocks for nanoscale electronic and optoelectronic
devices, Nature 409 (2001) 66–69.
[8] M. Yun, N.V. Myung, R.P. Vasquez, C. Lee, E. Menke, R.M. Penner, Elec-
trochemically grown wires for individually addressable sensor arrays, Nano
Lett. 4 (2004) 419–422.
[9] Y. Cui, Q. Wei, H.K. Park, C.M. Lieber, Nanowire nanosensors for highly
sensitive and selective detection ofbiologicaland chemical species, Science
293 (2001) 1289–1292.
[10] D.H. Zhang, Z.Q. Liu, L. Chao, T. Tao, X.L. Liu, S. Han, B. Lei,
C.W. Zhou, Detection of NO
2
down to ppb levels using individ-
ual and multiple In
2
O
3
nanowire devices, Nano Lett. 4 (2004) 1919–
1924.
[11] C. Li, D.H. Zhang, B. Lei, X.L. Liu, C.W. Zhou, Surface treatment and
doping dependenceofIn
2
O
3
nanowiresasammonia sensors, J.Phys.Chem.
B 107 (2003) 12451–12455.
[12] V. Lantto, in: G. Sberveglieri (Ed.), Gas Sensor, Kluwer Academic Pub-
lishers, The Netherlands, 1992, pp. 117–167.
G.X. Wang et al. / Sensors and Actuators B 131 (2008) 313–317 317
[13] E. Comini, G. Fraglia, G. Sberveglieri, Z.W. Pan, Z.L. Wang, Stable and
highly sensitive gas sensors based on semiconducting oxide nanobelts,
Appl. Phys. Lett. 81 (2002) 1869–1871.
[14] M. Law, H. Kind, B. Messer, F. Kim, P.D. Yang, Photochemical sensing
of NO
2
with SnO
2
nanoribbon nanosensors at room temperature, Angew.
Chem. Int. Ed. 41 (2002) 2405–2408.
[15] Y.L. Wang, X.C. Jiang, Y.N. Xia, A solution-phase, precursor route
to polycrystalline SnO
2
nanowires that can be used for gas sens-
ing under ambient conditions, J. Am. Chem. Soc. 125 (2003) 16176–
16177.
[16] T. Hamaguchi, N. Yabuki, M. Uno, S. Yamanaka, M. Egashira, Y. Shimizu,
T. Hyodo, Synthesis and H
2
gas sensing properties of tin oxide nan-
otube arrays with various electrodes, Sens. Actuators B 113 (2006)
852–856.
[17] E.R. Leite, I.T. Weber, E. Longo, J.A. Varela, A new method to control
particle size and particle size distribution of SnO
2
nanoparticles for gas
sensor applications, Adv. Mater. 12 (2000) 965–968.
[18] W. G
¨
opel, K.D. Schierbaum, SnO2 sensors: current status and future
prospects, Sens. Actuators B 26/27 (1995) 1–12.
[19] S.J. Gentry, P.T. Walsh, Poison-resistant catalytic flammable gas sensing
element, Sens. Actuators 5 (1984) 239–254.
[20] C. Li, D. Zhang, X. Liu, S. Han, T. Tang, J. Han, C. Zhou, In
2
O
3
nanowires as chemical sensors, Appl. Phys. Lett. 82 (2003) 1613–
1615.
Biographies
G.X. Wang received his PhD degree in Materials Science and Engineering in
2001 from University of Wollongong, Australia. He is currently working as a
senior lecturer atSchoolof Mechanical, Materials and MechatronicEngineering,
University of Wollongong. His major research interests include nanostructured
functional materials, materials chemistry in energy storage and conversion, and
development of chemical and biological sensors.
J.S. Park received his Master degree in Materials Engineering in 2005 from
Andong National University, Korea. Currently, he is a PhD candidate at Insti-
tute for Superconducting and Electronic Materials, University of Wollongong,
Australia.
M.S. Park received his Master degree in Materials Science and Engineering
in 2005 from Korea Advanced Institute of Science and Technology, Korea. He
is a currently PhD candidate at Institute for Superconducting and Electronic
Materials, University of Wollongong, Australia.
X.L. Gou received his PhD degree in Chemistry in2006fromNankai University,
China. He is a research fellow at Institute for Superconducting and Electronic
Materials, University of Wollongong, Australia. His research interests include
chemical synthesis of functional nanosize inorganic materials and development
of gas sensors.