- Trang chủ >>
- Khoa Học Tự Nhiên >>
- Vật lý
Preparation, characterization and gas sensitivity ofpolypyrrole/g-Fe2O3hybrid materials
Bạn đang xem bản rút gọn của tài liệu. Xem và tải ngay bản đầy đủ của tài liệu tại đây (2.41 MB, 5 trang )
Preparation,
characterization
and
gas
sensitivity
of
polypyrrole/
g
-Fe
2
O
3
hybrid
materials
§
Lina
Geng
a,
*
,
Shihua
Wu
b
a
Department
of
Chemistry,
Hebei
Normal
University,
Shijiazhuang
050016,
People’s
Republic
of
China
b
Department
of
Chemistry,
Nankai
University,
Tianjin
300071,
People’s
Republic
of
China
1.
Introduction
Organic–inorganic
hybrid
materials
composed
of
oxides
and
conducting
polymers
that
can
synergize
or
complement
the
properties
of
pure
organic
and
inorganic
materials
have
been
used
in
many
applications,
such
as
in
electronics,
optics,
coating
and
catalysis
[1–5].
Polymer/ferric
oxide
hybrids
in
particular
have
superior
properties
to
those
of
pure
polymer
and
ferric
oxide,
with
both
magnetic
and
polymer
properties,
and
have
demonstrated
wide
uses
in
medicine,
biochemistry
and
industry
[6,7].
Gas
sensors
have
been
developed
to
measure
gas
concentration,
monitor
emissions
in
combustion
processes
and
provide
feedback
control
[8].
The
study
of
organic–inorganic
hybrid
materials
for
application
in
gas
sensors
is
a
current
research
hotspot,
as
these
hybrids
can
compensate
for
the
drawbacks
of
single
inorganic
sensors
with
high
operating
temperatures
and
low
selectivity
and
of
organic
sensors
with
poor
processability
and
long
response–
recovery
time
[9,10].
Itoh
et
al.
[11]
developed
a
(PNMA)
x
MoO
3
hybrid
thin
film
and
found
in
evaluating
its
VOC
(volatile
organic
compound)
–
sensing
properties
that
the
selectivity
of
organic/
MoO
3
hybrids
can
be
controlled
by
modifying
the
organic
components.
Nardis
et
al.
[12]
reported
that
cobalt
porphyrin/
tin
dioxide
has
superior
selectivity
to
methanol
vapor
and
lower
working
temperatures
than
pure
SnO
2
.
Meanwhile,
Hosono
and
Matsubara
[13,14]
synthesized
a
PPy/MoO
3
thin
film
and
PPy/
MoO
3
pressed
pellet
and
found
that
PPy/MoO
3
materials
have
better
selectivity
compared
with
polar
VOCs.
Suri
et
al.
[15]
reported
on
a
PPy/iron
oxide
material
that
is
sensitivity
to
humidity
and
to
N
2
,
O
2
,
CO
2
and
CH
4
gases
at
different
pressures.
Our
previous
experiments
confirmed
that
PPy/ZnO,
PPy/WO
3
and
PAni/SnO
2
hybrids
are
superior
to
single
polymer
and
oxide
sensing
material
in
terms
of
selectivity
and
working
temperature
[16–18].
In
this
work,
PPy/
g
-Fe
2
O
3
hybrids
were
prepared
by
simultaneous
gelation
and
polymerization
processes
and
then
characterized
by
FT-IR,
XRD,
TG–DTA
and
HRTEM.
The
gas
sensitivities
of
PPy/
g
-Fe
2
O
3
hybrids
compared
to
pure
PPy
and
g
-Fe
2
O
3
under
CO,
H
2
,
NH
3
,
ethanol
and
acetone
atmosphere
at
low
operating
temperatures
(<100
8C)
were
evaluated.
The
sensing
mechanism
of
polypyrrole/
g
-Fe
2
O
3
is
also
discussed.
2.
Experimental
2.1.
Preparation
and
characterization
of
PPy/
g
-Fe
2
O
3
Pyrrole
monomers
were
distilled
under
reduced
pressure,
placed
in
a
desiccator
and
stored
at
4
8C
until
use.
Methoxy
ethanol
was
added
to
Fe(NO
3
)
3
Á9H
2
O
in
a
100
ml
round
bottom
flask
Materials
Research
Bulletin
48
(2013)
4339–4343
A
R
T
I
C
L
E
I
N
F
O
Article
history:
Received
7
April
2013
Received
in
revised
form
1
July
2013
Accepted
7
July
2013
Available
online
15
July
2013
Keywords:
A.
Composites
B.
Sol–gel
chemistry
C.
Differential
scanning
calorimetry
(DSC)
C.
Thermogravimetric
analysis
(TGA)
A
B
S
T
R
A
C
T
Polypyrrole
(PPy)/
g
-Fe
2
O
3
hybrid
materials
were
prepared
by
sol–gel
polymerization
in
situ
and
characterized
by
Fourier
transform
infrared
(FT-IR),
X-ray
powder
diffraction
(XRD),
thermogravimetric
and
differential
thermal
analysis
(TG–DTA)
and
high-resolution
transmission
electron
microscope
(HRTEM).
The
gas
sensitivities
in
CO,
H
2
,
NH
3
,
ethanol
or
acetone
atmospheres
were
determined
at
30
8C,
60
8C
and
90
8C.
FT-IR
and
XRD
patterns
suggest
that
ferric
oxide
in
the
hybrids
was
g
-Fe
2
O
3
,
with
a
diameter
of
approximately
5
nm.
TG–DTA
and
HRTEM
analyses
showed
that
different
reactant
molar
ratios
of
pyrrole
monomer:
Fe(NO
3
)
3
Á9H
2
O
resulted
in
different
microstructures
of
g
-Fe
2
O
3
and
molecular
weights
of
PPy.
An
increased
amount
of
Fe(NO
3
)
3
Á9H
2
O
increased
the
degree
of
uniformity
of
the
molecular
weight
of
PPy
and
resulted
in
a
change
of
g
-Fe
2
O
3
microstructure
from
granular
to
stick
particles.
The
results
of
gas
sensitivities
showed
that
the
PPy/
g
-Fe
2
O
3
hybrids
exhibited
high
sensitivity
to
NH
3
at
mild
operating
temperature
(<100
8C).
Furthermore,
the
sensing
mechanism
was
also
discussed.
ß
2013
The
Authors.
Published
by
Elsevier
Ltd.
All
rights
reserved.
§
This
is
an
open-access
article
distributed
under
the
terms
of
the
Creative
Commons
Attribution-NonCommercial-No
Derivative
Works
License,
which
permits
non-commercial
use,
distribution,
and
reproduction
in
any
medium,
provided
the
original
author
and
source
are
credited.
*
Corresponding
author.
Tel.:
+86
311
80787400;
fax:
+86
311
87881815.
address:
(L.
Geng).
Contents
lists
available
at
SciVerse
ScienceDirect
Materials
Research
Bulletin
jo
u
rn
al
h
om
ep
age:
ww
w.els
evier.c
o
m/lo
c
ate/mat
res
b
u
0025-5408/$
–
see
front
matter
ß
2013
The
Authors.
Published
by
Elsevier
Ltd.
All
rights
reserved.
/>containing
a
magnetic
stir
bar,
and
then
distilled
pyrrole
was
added
dropwise
to
the
stirred
solution
for
the
molar
ratio
of
pyrrole
monomer:
Fe(NO
3
)
3
Á9H
2
O
=
1:3
or
1:4
(the
products
are
denoted
as
S1
and
S2).
The
solution
was
continuously
stirred
and
heated
at
a
slow
rate
to
evaporate
the
solvent,
and
a
black
powder
precipitate
was
obtained.
The
chemical
reaction
equations
were
as
follows:
FeðNO
3
Þ
3
þ
3CH
3
OCH
2
CH
2
OH
¼
FeðOCH
2
CH
2
OCH
3
Þ
3
þ
3HNO
3
MðORÞ
n
þ
H
2
O
¼
MðORÞ
x
ðOHÞ
nÀx
þ
ðn
À
xÞHOR
½FeðOCH
2
CH
2
OCH
3
Þ
3
isabbreviatedasMðORÞ
n
ÀÀMÀÀOH
þ
HOÀÀMÀÀ
¼
ÀÀMÀÀOÀÀMÀÀ
þ
H
2
O
ÀÀMÀÀOR
þ
ROÀÀMÀÀ
¼
ÀÀMÀÀOÀÀMÀÀ
þ
ROH
After
washing
with
water
followed
by
ethanol,
the
products
were
dried
in
an
oven
and
then
annealed
at
different
temperatures
of
100
8C,
130
8C,
150
8C
or
180
8C.
The
properties
of
the
PPy/ferric
oxide
hybrids
were
analyzed
using
several
structural
methods:
FT-IR
(Avatar
360
FT-IR
spectrophotometer),
XRD
(DMAX-2500
diffractometer
with
Cu
K
a
radiation
at
40
kV
and
100
mA),
TG–DTA
(ZRY-2P
Simultaneous
Thermal
Analyzer)
and
HRTEM
(Philips
T20ST,
operated
at
200
kV).
2.2.
Determination
of
gas
sensing
characteristics
CO,
H
2
,
NH
3
,
ethanol
and
acetone
were
selected
for
testing
the
gas
sensitivity
of
the
materials.
The
detection
system
and
electric
circuit
have
been
described
in
our
previously
studies
[15–17].
Briefly,
the
materials
were
fabricated
on
an
aluminum
tube
with
Au
electrodes
and
platinum
wires.
A
Ni–Cr
alloy
through
the
tube
was
used
as
a
heating
filament.
The
voltage
of
the
sensor
was
measured
indirectly
by
an
external
resistor
in
the
testing
circuit.
Gas
sensitivity
is
defined
as
S
=
V
g
/V
a
,
where
V
a
and
V
g
are
the
voltages
of
the
sensor
in
clear
air
and
in
the
test
gas,
respectively
[19,20].
All
experiments
were
carried
out
at
a
fixed
humidity
of
60%.
3.
Results
and
discussion
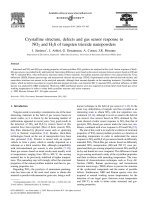
The
FT-IR
spectra
of
S1
and
S2
annealed
at
150
8
C
were
compared
with
that
of
PPy
in
the
range
of
400–4000
cm
À1
(Fig.
1).
The
characteristic
bands
of
PPy
were
observed
at
1560,
1398,
1298,
1211,
1047,
930
and
790
cm
À1
,
which
were
close
to
those
reported
in
the
literature
[21]:
stretching
vibration
(1560
cm
À1
)
of
the
C55C
bond,
stretching
vibration
(1298
cm
À1
)
of
the
C55C
bond,
stretching
vibration
(1211
cm
À1
)
of
the
C–N
bond,
and
the
pyrrole
ring
bonds
(1407,
1398,
1047,
930,
790
cm
À1
).
In
the
S1
(150
8C)
and
S2
(150
8C)
spectra,
characteristic
peaks
of
PPy
were
also
found
at
1407,
1398,
1047,
930
and
790
cm
À1
,
and
the
g
-Fe
2
O
3
specific
bands
appeared
in
681,
578
and
468
cm
À1
.
In
the
spectra,
the
C55O
bond
in
pyrrolidone
at
about
1700
cm
À1
due
to
the
overoxidation
of
PPy
was
clearly
seen.
The
obvious
absorption
peak
at
$1390
cm
À1
corresponded
to
KBr.
The
XRD
patterns
revealed
that
the
diffraction
peaks
of
the
S1
and
S2
samples
annealed
at
different
temperatures
appeared
at
the
same
crystal
face
(Fig.
2).
These
peaks
were
consistent
with
those
from
the
Joint
Committee
on
Powder
Diffraction
Standards
(JCPDS)
data
file
(25-1402)
and,
along
with
the
FT-IR
spectra
analysis,
indicated
the
iron
oxide
in
S1
and
S2
was
g
-Fe
2
O
3
.
The
diffraction
4000
3500
3000
2500
2000
1500
1000
500
0
10
20
30
40
50
60
70
S2
S1
PPy
Transmittance (%)
Waveleng
th (nm
-1
)
Fig.
1.
FT-IR
spectra
of
PPy,
S1
(150
8C)
and
S2
(150
8C)
.
0 102030405060708090
0
500
1000
1500
2000
2500
3000
4
3
2
1
440
513
426
400
220
313
Intensity (a.u.)
2 The
ta (deg
.)
1.10
0
o
C
2.13
0
o
C
3.15
0
o
C
4.18
0
o
C
0
10
20
30
40
50
60
70
80
90
0
500
1000
1500
2000
2500
3000
4
3
2
1
440
513
426
400
220
313
Intensity (a.u.)
2 The
ta (deg
.)
1.10
0
o
C
2.13
0
o
C
3.15
0
o
C
4.18
0
o
C
(a)
(b)
Fig.
2.
XRD
patterns
of
sample
S1
(a)
and
S2
(b)
annealed
at
different
temperatures.
L.
Geng,
S.
Wu
/
Materials
Research
Bulletin
48
(2013)
4339–4343
4340
intensity
increased
with
increasing
annealing
temperature,
and
the
particle
sizes
of
S1
and
S2
samples
annealed
at
150
8C
were
5.3
nm
and
4.7
nm,
respectively,
according
to
the
Scherrer
formula.
The
S1
and
S2
samples
annealed
at
100
8C
were
heated
at
the
rate
of
10
8C/min.
The
TG–DTA
curve
for
S1
showed
three
exothermic
and
two
weight
loss
processes
in
the
range
of
20–
550
8C
(Fig.
3a).
The
two
points
of
weight
losses
in
the
TG
curve
corresponded
to
the
first
and
second
exothermic
processes
in
the
DTA
curve,
while
the
third
exothermic
process
had
no
quality
change.
These
two
exothermic
peaks
coupled
with
weight
losses
near
219
8C
and
308
8C
were
caused
by
the
degradation
of
PPy,
as
the
molecular
weight
of
PPy
in
S1
was
not
uniform,
the
small
forms
degraded
first,
while
the
larger
ones
degraded
later.
The
total
weight
loss
percentage
of
S1
(100
8C)
was
31.9%.
The
third
exother-
mic
peak
near
441
8C
was
the
crystal
phase
transition
of
g
-Fe
2
O
3
to
a
-Fe
2
O
3
and
therefore
caused
no
weight
loss.
The
two
exothermic
peaks
and
one
point
of
weight
loss
in
the
TG–DTA
curve
of
S2
(100
8C)
occurred
in
the
range
of
20–600
8C
(Fig.
3b).
The
base
of
the
first
exothermic
peak
near
261
8C
was
wide,
which
spanned
the
temperature
range
of
the
two
exothermic
processes
near
219
8C
and
308
8C
of
S1
(100
8C)
.
This
result
could
be
explained
by
the
molecular
weights
of
the
PPy
species
in
S2
(100
8C)
being
close,
and
therefore
degradation
of
PPy
appeared
continuous
during
heating.
The
total
weight
loss
percentage
of
S2
(100
8C)
was
29%,
similar
to
that
of
S1
(100
8C)
.
As
with
S2
(100
8C)
,
the
second
exothermic
peak
of
S2
(100
8C)
near
458
8C
was
the
crystal
phase
transition
of
g
-Fe
2
O
3
to
a
-Fe
2
O
3
,
which
did
not
result
in
weight
loss.
Although
the
percentages
of
weight
loss
of
S1
(100
8C)
and
S2
(100
8C)
were
similar,
the
number
of
exothermic
peaks
were
different
due
to
differences
in
molecular
weights
of
PPy
in
the
two
samples
(Fig.
3a
and
b).
In
addition,
the
phase-transition
temperature
of
S2
(100
8C)
was
17
8C
higher
than
that
of
S1
(100
8C)
.
These
results
could
be
explained
further
from
the
TEM
and
HRTEM
micrographs.
Fig.
4a
shows
the
polymer
characteristics
(i.e.,
amorphous
particles
and
blurry
boundaries)
of
S1
(150
8C)
,
even
though
it
was
the
hybrid
of
PPy
and
g
-Fe
2
O
3
.
The
crystal
lines
of
g
-
Fe
2
O
3
were
not
obvious
even
with
HRTEM
(Fig.
4b),
which
was
due
to
the
g
-Fe
2
O
3
being
enwrapped
by
PPy
(Fig.
5).
From
the
TEM
and
HRTEM
micrographs
of
S2
(150
8C)
,
the
amorphous
polymer,
granular
and
stick
g
-Fe
2
O
3
particles
could
be
seen,
and
the
length
and
width
of
the
stick
form
was
about
200
nm
and
15
nm,
respectively.
Only
g
-Fe
2
O
3
diffraction
peaks
appeared
in
the
XRD
patterns
of
S2,
indicating
that
the
granular
and
stick
particles
were
all
g
-type
ferric
oxide.
This
result
indicates
that
the
different
molar
ratios
of
py
to
Fe(NO
3
)
3
Á9H
2
O
can
affect
the
morphology
of
iron
oxide.
Brezoi
and
Ion
[22]
had
reported
that
the
amount
of
py
could
influence
the
crystal
phase
of
iron
oxide
in
PPy/
iron
oxide
hybrids.
Xia
and
Wang
[23]
and
He
[24]
all
reported
that
polymer
conformation
does
influence
the
crystal
shape
of
inorganic
oxide.
However,
these
authors
did
not
discuss
the
specific
effect
of
proportion
of
reactants
on
the
morphology
of
inorganic
oxide
in
the
crystal
phase.
Fig.
3.
TG–DTA
curves
of
sample
S1
(100
8C)
(a)
and
S2
(100
8C)
(b).
Fig.
4.
TEM
(a)
and
HRTEM
(b)
micrographs
of
sample
S1
(150
8C)
.
L.
Geng,
S.
Wu
/
Materials
Research
Bulletin
48
(2013)
4339–4343
4341
In
the
gas
sensing
study,
S1
and
S2
were
made
for
thick
film
sensors,
and
their
sensitivities
for
CO,
H
2
,
NH
3
,
ethanol
and
acetone
gases
were
tested
at
30
8C,
60
8C
and
90
8C.
PPy/
g
-Fe
2
O
3
hybrids
prepared
with
reactants
at
two
differ ent
ratios
and
four
annealing
temperatures
all
showed
no
gas
sensitivity
to
3000
ppm
CO,
H
2
,
ethanol
and
acetone
at
30
8C,
60
8C
or
90
8C,
but
showed
good
response
to
2000
ppm
NH
3
under
the
three
operating
temperatures.
In
addition,
S1
and
S2
showed
similar
sensitivity
characteristics.
The
response–recovery
curves
of
S1
(150
8C)
(Fig.
6a)
and
S2
(150
8C)
(Fig.
6b)
showed
that
they
had
good
reversible
and
quick
response–
recovery
times
to
2000
ppm
NH
3
at
the
operating
temperatures
of
30
8C,
60
8C
and
90
8C
(Fig.
6).
The
response
and
recovery
times
of
S1
(150
8C)
were
12–36
s
and
20–22
s,
respectively,
at
different
working
temperatures,
and
those
of
S2
(150
8C)
were
17–40
s
and
20–23
s.
The
results
shown
in
Fig.
6
also
suggest
that
the
testing
voltage
increased
when
the
NH
3
gas
was
inputted,
which
was
due
to
the
increase
in
resistances
and
decreased
conductivities
of
0
50 10
015
020
025
030
0
0.06
0.08
0.10
0.12
0.14
0.16
0.18
0.20
0.22
0.24
0.26
gas ou
t
gas in
3
2
1
Voltage (V)
Time (s)
1.30
o
C
2.60
o
C
3.90
o
C
0
50 10
015
020
025
030
0
0.02
0.04
0.06
0.08
0.10
0.12
0.14
0.16
0.18
0.20
0.22
0.24
0.26
0.28
0.30
0.32
gas ou
t
gas in
3
2
1
Voltage (V)
Time (s)
1.30
o
C
2.60
o
C
3.90
o
C
(b)
(a)
Fig.
6.
Response–recovery
curves
of
S1
(150
8C)
(a)
and
S2
(150
8C)
(b)
to
2000
ppm
NH
3
at
different
working
temperatures.
Fig.
7.
Varied
sensitivities
of
S1
(a)
and
S2
(b)
(annealed
at
different
temperatures)
with
different
concentrations
of
NH
3
at
90
8C.
Fig.
5.
TEM
(a)
and
HRTEM
(b)
micrographs
of
sample
S2
(100
8C)
.
L.
Geng,
S.
Wu
/
Materials
Research
Bulletin
48
(2013)
4339–4343
4342
S1
(150
8C)
and
S2
(150
8C)
in
the
NH
3
atmosphere.
Thus,
the
PPy/
g
-
Fe
2
O
3
hybrids
showed
characteristics
of
an
n-type
semiconductor,
although
they
contained
both
p-
and
n-type
semiconductors.
This
finding
may
be
attributed
to
the
relatively
high
content
of
g
-Fe
2
O
3
in
the
hybrids.
However,
the
pure
g
-Fe
2
O
3
prepared
as
described
in
reference
[25]
showed
no
gas
sensitivity
at
the
operating
temperatures
of
30
8C,
60
8C
or
90
8C,
which
was
due
to
g
-Fe
2
O
3
being
an
insulator
at
normal
temperatures.
The
sensitivities
of
S1
and
S2
annealed
at
100
8C,
130
8C,
150
8C
and
180
8C
under
different
concentrations
of
NH
3
gases
at
90
8C
increased
linearly
with
increasing
concentrations
of
NH
3
(Fig.
7).
The
sensitivity
curves
of
S1
and
S2
tested
at
30
8C
and
60
8C
were
similar
with
that
at
90
8C
(data
not
shown).
These
results
suggest
that
S1
and
S2
based
sensors
can
be
used
in
low
operating
temperatures
(<100
8C)
to
detect
a
wide
testing
range
NH
3
gas
concentrations.
Our
previous
studies
reported
that
PPy/ZnO
and
PPy/WO
3
had
good
selectivity
to
NO
x
and
H
2
S
respectively,
but
had
no
sensitivity
to
NH
3
at
the
high
concentration
of
2000
ppm
[16,26].
Therefore,
PPy/
g
-Fe
2
O
3
hybrids
can
be
developed
in
further
applications
as
NH
3
selectivity
sensors.
4.
Conclusions
The
reactant
ratio
of
pyrrole
monomer:
Fe(NO
3
)
3
Á9H
2
O
and
annealing
temperature
of
PPy/
g
-Fe
2
O
3
hybrids
prepared
by
sol–gel
polymerization
in
situ
were
shown
here
to
influence
their
micro-
structure
and
gas
sensitivity.
Increasing
amounts
of
Fe(NO
3
)
3
Á9H
2
O
increased
the
degree
of
PPy
uniformity
and
resulted
in
the
microstructure
change
of
g
-Fe
2
O
3
from
granular
to
stick
particle
form.
Furthermore,
the
PPy/
g
-Fe
2
O
3
hybrids
were
all
selectively
sensitive
to
NH
3
gas
at
low
temperatures
(<100
8C)
and
could
overcome
the
shortcomings
of
the
long
response
time
of
PPy
and
high
operating
temperature
of
g
-Fe
2
O
3
.
Therefore,
the
hybrids
presented
important
and
practical
features
for
manufacture
of
gas
sensors.
Acknowledgment
This
work
was
supported
by
grants
from
the
National
Natural
Science
Foundation
of
China
(31201305).
Appendix
A.
Supplementary
data
Supplementary
data
associated
with
this
article
can
be
found,
in
the
online
version,
at
/>07.020.
References
[1]
S.
Miura,
H.
Naito,
Y.
Kanemitsu,
Y.
Matsuura,
K.
Matsukawa,
H.
Inoue,
Thin
Solid
Films
438/439
(2003)
253–256.
[2]
Y.Y.
Yu,
W.C.
Chen,
Mater.
Chem.
Phys.
82
(2003)
388–395.
[3]
J.G.
Magdalena,
L.O.
Duan,
Brmsby,
C.S.
Alice,
R.H.W.
John,
Chem.
Commun.
6
(2001)
67–68.
[4]
M.D.
Soucek,
A.H.
Johnson,
J.M.
Wegner,
Prog.
Org.
Coat.
51
(2004)
300–311.
[5]
I.L.
Lehr,
S.B.
Saidman,
Corros.
Sci.
49
(2007)
2210–2225.
[6]
B.P.
Tripathi,
V.K.
Shahi,
Prog.
Polym.
Sci.
36
(2011)
945–979.
[7]
X.
Zhao,
L.
Lv,
B.
Pan,
W.
Zhang,
S.
Zhang,
Q.
Zhang,
Chem.
Eng.
J.
170
(2011)
381–394.
[8]
J.W.
Fergus,
Sens.
Actuators
B
123
(2007)
1169–1179.
[9]
R.
Tan,
Y.
Guo,
J.
Zhao,
Y.
Li,
T.
Xu,
W.
Song,
Trans.
Nonferrous
Met.
Soc.
China
21
(2011)
1568–1573.
[10]
S.
Pirsa,
N.
Alizadeh,
Sens.
Actuators
B
147
(2010)
461–466.
[11]
T.
Itoh,
I.
Matsubara,
W.
Shin,
N.
Izu,
M.
Nishibori,
Sens.
Actuators
B
128
(2008)
512–520.
[12]
S.
Nardis,
D.
Monti,
C.D.
Natable,
A.D.
Amico,
P.
Siciliano,
A.
Forleo,
M.
Epifani,
A.
Taurino,
R.
Rella,
R.
Paolesse,
Sens.
Actuators
B
103
(2004)
339–343.
[13]
K.
Hosono,
I.
Matsubara,
N.
Murayama,
S.
Woosuck,
N.
Izu,
Chem.
Mater.
17
(2005)
349–354.
[14]
I.
Matsubara,
K.
Hosono,
N.
Murayama,
S.
Woosuck,
N.
Izu,
Bull.
Chem.
Soc.
Jpn.
77
(2004)
1231–1237.
[15]
K.
Suri,
S.
Annapoorni,
A.K.
Sarkar,
R.P.
Tandon,
Sens.
Actuators
B
81
(2002)
277–282.
[16]
L.
Geng,
Y.
Zhao,
X.
Huang,
S.
Wang,
S.
Zhang,
W.
Huang,
S.
Wu,
Synt.
Met.
156
(2006)
1078–1082.
[17]
L.
Geng,
X.
Huang,
Y.
Zhao,
P.
Li,
S.
Wang,
S.
Zhang,
S.
Wu,
Solid
State
Electron
50
(2006)
723–726.
[18]
L.
Geng,
Y.
Zhao,
X.
Huang,
S.
Wang,
S.
Zhang,
S.
Wu,
Sens.
Actuators
B
120
(2007)
568–572.
[19]
J.
Lee,
Sens.
Actuators
B
140
(2009)
319–336.
[20]
L.
Geng,
Trans.
Nonferrous
Met.
Soc.
Chin.
19
(2009)
s678–s683.
[21]
M.A.
Depaoli,
R.J.
Waltaman,
A.F.
Diaz,
J.
Bargon,
Polym.
Sci.
Polym.
Chem.
Ed.
23
(1985)
1687–1698.
[22]
D.V.
Brezoi,
R.M.
Ion,
Sens.
Actuators
B
109
(2005)
171–175.
[23]
H.S.
Xia,
Q.
Wang,
Chem.
Mater.
14
(2002)
2158–2165.
[24]
Y.J.
He,
Mater.
Chem.
Phys.
92
(2005)
134–137.
[25]
G.
Jiang,
J.
Jiang,
Chem.
J.
Chin.
U.
25
(2004)
405–408.
[26]
L.
Geng,
Synt.
Met.
160
(2010)
1708–1711.
L.
Geng,
S.
Wu
/
Materials
Research
Bulletin
48
(2013)
4339–4343
4343