Characterization and deactivation of sulfided red mud used as hydrogenation catalyst
Bạn đang xem bản rút gọn của tài liệu. Xem và tải ngay bản đầy đủ của tài liệu tại đây (885.74 KB, 15 trang )
/
ELSEVIER
A PI D
PL
E
CTLS
A AY S
I
A: EEA
GNRL
Applied Catalysis A: General 128 (1995) 259-273
Characterization and deactivation of sulfided red
mud used as hydrogenation catalyst
Jorge Alvarez, Roberto R o s a l ,
H e r m i n i o Sastre, F e r n a n d o V. D i e z *
Department of Chemical Engineering, Universi~ of Oviedo 33071-Oviedo, Spain
Received 26 January 1995; revised 29 March 1995; accepted 29 March 1995
Abstract
Red mud is a residue in the production of alumina by the Bayer process. It contains oxides of iron
and titanium, and has been shown to be active in sulfided form as hydrogenation catalyst. The evolution
of sulfided red mud activity and selectivity with reaction time was studied for the hydrogenation of a
light fraction of an anthracene oil. Texture, morphology and composition of fresh red mud, and
catalyst samples collected at different reaction times, were characterized by nitrogen adsorption, SEM
and SEM-EDX. It was found that the catalyst looses surface area and superficial iron as the reaction
proceeds. The decrease of catalytic activity can be explained by a combination of both phenomena.
Keywords: Red mud; Deactivation; Hydrogenation; Scanning electron microscopy
1. Introduction
Red mud is a material containing mainly oxides of iron, aluminium, titanium,
silicon, calcium and sodium, and is produced as a residue in the manufacture of
alumina by the Bayer process. Sulfided red mud was found to be active as a
hydrogenation catalyst as early as 1950 [ 1 ]. Further studies showed the catalytic
activity of sulfided red mud for the liquefaction of coal [2--4], biomass [5], and
for the hydrogenation of pure organic compounds such as naphthalene, phenanthrene and pyrene [4,6].
In a previous work [7], sulfided red mud was tested as a catalyst for the hydrogenation of anthracene oil, a fraction obtained by distillation of coal tar, containing
two- to four-rings condensed aromatic hydrocarbons. These compounds can transform into hydroaromatics by catalytic hydrogenation, yielding a hydrogenated
* Corresponding author. E-mail , tel. ( + 34-8) 5103508, fax. ( + 34-8)
5103434.
0926-860X/95/$09.50 © 1995 Elsevier Science B.V. All rights reserved
SSDI 0 9 2 6 - 8 6 0 X ( 95 ) 00083-6
260
J. Alvarez et al. /Applied Catalysis A: General 128 (1995) 259-273
solvent with high hydrogen-donor capacity. Hydrogenated anthracene oil can be
used in processes such as coal liquefaction [ 8,9], oil-coal coprocessing [ 10], and
coke production by carbonization of low-rank coals with pitch-like materials [ 11 ].
In the aforementioned work [7], it was found that, although to a lesser degree
than if commercial catalysts such as Ni/Mo on y-alumina are used, anthracene oil
hydrogenated in the presence of sulfided red mud contained appreciable concentrations of hydroaromatics, especially dihydroanthracene, dihydrophenanthrene and
tetrahydrofluoranthene, that are reported [ 12,13] to be among the most active
hydrogen donors. Hydrogenation reactions were carried out in a bench-scale continuous trickle bed at 623 K, 10 MPa, and constant catalytic activity.
In order to evaluate the practical usefulness of a catalyst, it is very important to
determine the time on stream after which the catalytic activity falls to an unacceptable level. In this work, the evolution with time of the activity and selectivity
of red mud used as a catalyst for the hydrogenation of anthracene oil was studied.
Reactions were carried out at constant temperature, pressure and flow-rates. Catalyst
samples were collected after different reaction times and characterized by BET
nitrogen adsorption, scanning electron microscopy (SEM), and scanning electron
microscopy-energy-dispersive X-ray (SEM-EDX).
2. Experimental
2.1. Materials
Red mud, as a residue of the caustic digestion of bauxite, contains all the elements
present in bauxite that are insoluble or partially soluble in caustic soda, concentrated
about five times, plus sodium and calcium coming from the reagents added during
the digestion process. Mineralogically, the main constituents of red mud are hematites, rutile, goethite, sodalite, boehmite and gibbsite. The red mud used in this work
was supplied by the San Cipri~in (La Corufia, Spain) plant of the Spanish aluminium
company Inespal. The main constituents of the red mud were analyzed by atomic
absorption spectrometry and volumetric methods after acid dissolution and alkaline
fusion. Details of the analytical method are given elsewhere [ 14], while the composition of the red mud can be found in Table 1.
Sulfided red mud catalytic activity was tested by hydrogenating a light fraction
of anthracene oil supplied by Nalon-Chem (Asturias, Spain), with the composition
given in Table 2.
2.2. Catalyst characterization
Catalyst pore structure and surface area was measured by nitrogen adsorption
with a Micromeritics Asap 2000 apparatus.
J. Alvarez et al. /Applied Catalysis A: General 128 (1995) 259-273
261
Table 1
Bulk and EDX composition of red mud
Element
Bulk composition (wt.-%)
EDX composition (wt-.%)
Fe
Ti
AI
Na
Ca
Si
19.7
13.0
7.9
3.7
5.1
4.7
P
V
C1
not measured
not measured
not measured
21.7
11.9
7.4
3.0
4.9
3.6
0.7
0.3
0.3
Catalyst morphology was studied by SEM in a JSM-6100 apparatus, the catalyst
samples being previously gold-coated. The SEM apparatus is equipped with a Link
X-ray microanalizer that provides a quantitative chemical analysis of a catalyst
surface layer to a depth of about I/zm, and supplies information on the distribution
of certain elements, providing maps in which the brightness of every pixel depends
on the concentration of this element. For this kind of analysis, catalyst samples
must be polished and carbon coated.
2.3. Reaction studies
The hydrogenation experiments were carried out in a continuous trickle bed
reactor with a 9 mm internal diameter, 45 cm long stainless steel cylinder. 2.0 g of
red mud were placed in the central section of the reactor, the upper and lower
sections being filled with 0.25-0.08 mm particles of low-area inert alumina. Red
Table 2
Composition of anthracene oil (wt.-%)
Naphthalene
Acenaphthene
Dibenzofuran
Fluorene
9,10-Dihydroanthracene
Phenanthrene
Anthracene
Carbazole
Fluoranthene
Pyrene
2-Methylnaphthalene
Dibenzothiophene
Methylanthracene
Methylphenanthrene
Methylpyrene
Chrysene
Triphenilene
4.0
5.9
3.1
4.9
0.8
18.2
4.4
2.9
10.2
6.2
1.0
1.2
1.1
1.2
1.5
1.7
1.8
262
J. AIvarez et al. /Applied Catalysis A: General 128 (1995) 259-273
mud was sulfided in situ before use by passing a mixture of 10% hydrogen sulfide
in hydrogen at atmospheric pressure through the reactor, heated to 673 K, for 4 h.
The liquid feed, consisting of 20 wt.-% anthracene oil dissolved in toluene, for
easier handling, flowed downwards through the reactor, concurrently with hydrogen. 1 wt.-% carbon sulphide was added to the liquid feed to maintain the catalyst
in the sulfided form. Reaction products were collected in a cylindrical receiver, and
liquid samples were withdrawn by emptying the receiver at different time intervals.
Hydrogenated anthracene oil was analyzed by gas chromatography using a capillary
fused silica column with apolar stationary phase SE-30. Peak assignment was
performed by gas chromatography-mass spectrometry.
All the experiments were carried out under the same reaction conditions: pressure
10 MPa, temperature 623 K, hydrogen flow-rate 4.10 - 6 N m3/s, and liquid flowrate (at room conditions) 0.6 ml/min. Further details of the reaction experimental
set up and procedure are given in ref. [7].
60
50
A
v
40
tO
°m
¢n
30
c
o
u
20
10'
0
!
0
!
5
10
--,
15
20
25
time
30
35
of run (h)
L
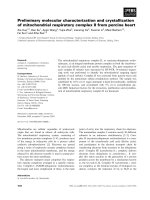
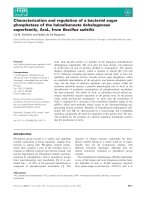
Fig. 1. Evolution of conversions with run time for: ( 0 ) anthracene, ([]) phenanthrene, ( • ) fluoranthene, ( • )
pyrene.
Table 3
Textural characteristics of different red mud samples, obtained by nitrogen adsorption
Fresh
After reaction time:
Unsulfided
BET specific surface (mZ/g)
BJH desorption pore volume (cm3/g)
BET average pore diameter (nm)
Sulfided
3h
12 h
40 h
24.3
0.086
12.1
29.5
0.090
10.5
27.9
0.067
10.6
18.3
0.045
10.0
16.2
0.034
8.9
263
J. Alvarez et al. /Applied Catalysis A: General 128 (1995) 259-273
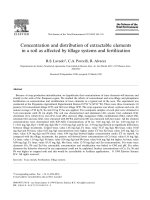
0.10
A
0.08
E
v
0.06
"~
0.04
o
O
a.
0.02
0.~
.
.
.
.
.
.
.
.
.
.
.
.
.
10
.
.
.
100
Pore diameter (rim)
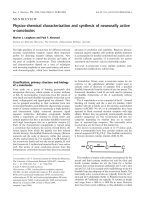
Fig. 2. Pore volume distributions of the red mud: (â) fresh, unsulfided; (O) fresh, sulfided; ( ã ) after 3 h; (O)
after 12 h; (II) after 40 h.
3. Results and discussion
The anthracene oil constituents that were hydrogenated to a measurable degree
at reaction conditions were: anthracene, phenanthrene, fluoranthene, and pyrene,
yielding as hydrogenated products 9,10-dihydroanthracene, 9,10-dihydrophenanthrene, 1,2,3,10b-tetrahydrofluoranthene and 4,5-dihydropyrene, respectively. It
has been shown [ 15] that hydrogenation of those compounds accounts for more
than 75% of the total hydrogen consumption. Fig. 1 shows the evolution of the
conversion of the different compounds with reaction time. The evolution of the
catalyst activity followed the usual path of an initial period of fast activity decay,
followed, after 6 h approximately, by a period of about 25 h of slowly declining
activity. After about 38 h of run, the activity quickly decreased to a point at which
the only reactant converted was anthracene. Although the profile of the evolution
of conversion with time was similar for all the reactants, there are some differences:
phenanthrene showed a less sharp decline of conversion in the initial deactivation
period, and anthracene showed not only a higher conversion, but also a slower
decrease of conversion during the full time of reaction. If the average conversion
is taken as:
average conversion = E'c°mp°unds in feed - E compounds in product
compounds in feed
where E compounds is the sum of the concentrations of anthracene, phenanthrene,
fluoranthene and pyrene, the average conversion of 0.254 measured after 3 h,
decreased to 0.123 after 12 h and to 0.018 after 40 h.
Catalyst samples were collected after 3 h, and 12 h reaction time, corresponding
to the catalyst in the period of declining activity, and 40 h, corresponding to the
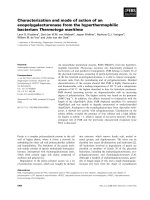
Fig. 3. SEM photographs of the surface of red mud: (a) fresh, unsulfided; (b) fresh, sulfided; (c) after 12 h run time; (d) after 40 h run time.
b-,
Fig. 4. SEM photographs of the surface of red mud: (a) fresh, sulfided; (b) fresh, sulflded; (c) after 12 h run time; (d) after 12 h run time.
e~
~2
266
J. Alvare~ et al. /Applied Catalysis A: General 128 (1995) 259-273
Table 4
EDX composition of sulfided red mud after different reaction times in the presence of H~S (wt.-%)
Element
Reaction time
Oh
Fe
Ti
S
A1
Ca
Si
Na
CI
P
V
3h
12h
40h
36.7
17.9
14.5
11.3
7.6
6.2
4.0
1.0
0.8
0.3
36.2
13.8
14.5
12.1
5.1
6.6
2.4
1.0
0.6
0.4
35.8
13.4
19.4
14.9
5.1
4.1
2.4
3.7
1.0
0.4
33.7
14.2
20.1
16.0
5.1
3.5
2.2
4.0
0.7
0.3
catalyst being almost completely deactivated. These samples, and samples of fresh
unsulfided and sulfided catalyst, were characterized by nitrogen adsorption and
SEM.
The results of textural characterization by nitrogen adsorption of the catalyst
samples are given in Table 3 and Fig. 2. Sulfidation slightly increased the red mud
surface area and decreased the average pore diameter. The run strongly affected
the surface area and pore volume: after 12 h reaction time, the surface area decreased
to 62%, and pore volume to 50%. During the next 28 h, catalyst pore volume and
surface area continued decreasing, but less markedly.
Fig~ 3 and Fig. 4 present SEM photographs of the red mud in different conditions.
In Fig. 3 the change of the catalyst morphology as the reaction proceeded can be
observed: the granulated, uniform surface of fresh unsulfided and sulfided red mud
was transformed in a non-uniform surface formed by particles of increasing size.
At higher magnifications (Fig. 4), it can be observed that fresh red mud is made
up of particles partially covered by small granules. After 12 h run, besides zones
similar in appearance to the fresh red mud (Fig. 4a), other zones appeared formed
by larger, flat-surfaced particles, which were less covered by granules than fresh
red mud (Fig. 4c and d).
Table 4 gives the concentration of the different red mud samples measured by
SEM-EDX. As the reaction proceeded, iron decreased slightly, while titanium,
calcium, silicon and sodium decreased more markedly. The elements that increased
their composition were sulfur and aluminium, and especially chlorine.
Maps of the elements in the catalyst samples obtained by EDX are shown in
Figs. 5-9. In these maps, the brightness of every pixel is related to the intensity of
emission of the characteristic Ka line of each element. White corresponds to a high
concentration of a given element, and black to the absence of this element, while
greys correspond to intermediate concentrations. The pictures were obtained by
setting two different levels of brightness, for the elements in high concentration
J. Alvarez et al. /Applied Catalysis A: General 128 (1995) 259-273
267
Fig. 5. SEM-EDX maps of distribution of elements: fresh, unsulfided red mud.
(iron, aluminium, titanium and sulfur), and in low concentration ( sodium, chlorine,
silicon and calcium). Fig. 5, corresponding to fresh, unsulfided red mud, shows the
elements distributed uniformly on the surface. Sulfur and chlorine are present in
very small amounts. After sulfidation (Fig. 6), the superficial concentration of
aluminium and sulfur increased, aluminium being concentrated in a part of the
surface, in which iron is absent. Titanium, sulfur, silicon and calcium were asso-
268
J. Alvarez et al. /Applied Catalysis A: General 128 (1995) 259-273
Fig. 6. SEM-EDX maps of distribution of elements: flesh, sulfided red mud.
ciated with iron. After 12 h reaction time, aluminium occupied most of the surface,
the rest being covered by iron and associated elements (titanium, sulfur, silicon
and calcium). The presence of chlorine in the surface increased considerably, and
was also associated with iron. A small amount of sodium appeared, associated with
iron and chlorine. The same tendency of aluminium to occupy progressively the
catalyst surface, and the decreasing presence of iron, was observed after 40 h
reaction time (Fig. 9).
J. Alvarez et al. /Applied Catalysis A: General 128 (1995) 259-273
269
Fig. 7. SEM-EDX maps of distribution of elements: red mud after 3 h run time.
The brightness of every pixel of the EDX maps, B, can be quantified on a scale
of 0 (black) to 1 (maximum degree of brightness). Fig. 10 shows the cumulative
brightness distributions (fraction of the sample surface that has a brightness less
than a given level B) for the iron maps of the different catalyst samples. From this
figure, it can be observed that the surface with little presence of iron (relative
brightness less than 0.1 ) increased slightly after sulfiding (from 10.4% total surface
270
J. Alvarez et al./ Applied Catalysis A: General 128 (1995) 25~273
Fig. 8. S E M - E D X maps of distribution of elements: red m u d after 12 h run time.
to 15.1%), and very markedly after 12 h reaction time (57.1%), reaching 77.2%
after 40 h reaction time. XBiSi (Si being the surface fraction corresponding to a
brightness B~) can be taken as an alternative measure of iron content in the 1 txm
surface layer. If iron content for fresh unsulfided red mud measured in this way is
taken as a reference, the relative iron content for fresh sulfided red mud was 0.94,
after 3 h reaction time 0.90, after 12 h reaction time 0.66, and after 40 h, 0.26. The
J. Alvarez et al. /Applied Catalysis A: General 128 (1995) 259-273
271
Fig. 9. SEM-EDX maps of distribution of elements: red mud after 40 h run time.
decrease of iron quantified by this method was much more marked than that given
by the SEM-EDX data of Table 4.
Average conversion, as defined previously, shows an almost linear relationship
with the relative catalyst iron content in the 1 /xm surface layer, defined as the
product of the surface area and iron content measured from the EDX maps. The
decrease in iron, assumed to be the active phase as iron sulfide, fully explains the
deactivation observed during the reaction run.
272
.L Alvarez et al. /Applied Catalysis A: General 128 (1995) 259-273
100
_
_
_
=
=
-
-
_
:.
-
-
8
o
-~ 4o
.m
0.0
0.2
0.4
Relative
0.6
0.8
1.0
brightness
Fig. 10. Cumulative brightness distributions for the Fe EDX maps of the red mud: (C)) fresh, unsulfided; (O)
fresh, sulfided; ( • ) after 3 h; (U]) after 12 h; ( l l ) after 40 b.
It was not possible to compare SEM photographs with EDX maps directly, as
they are obtained from different catalyst samples prepared by different treatments.
Nevertheless, observing SEM photographs of Fig. 3 and Fig. 4, and EDX maps of
Figs. 5-9, one can speculate that iron and titanium corresponded to small granules,
homogeneously distributed on the surface of fresh red mud, while the surface of
the larger flat-surfaced particles present in aged red mud, would mainly consist of
alumina. On the surface of the aged catalyst, iron would be present as small granules
deposited non-uniformly on the larger particles.
Acknowledgements
This work was supported by the Spanish Interministerial Commission for Science
and Technology under Grant MAT92-0807. The authors are grateful to Mr. Alfredo
Quintana, of the Electron Microscopy Service of the University of Oviedo.
References
[ 1]
[2]
[3]
[4]
[5]
[6]
[7]
[8 ]
S. Weller, M.G. Pelipetz, S. Friedman and H.H. Storch, Ind. Eng. Chem., 42 (1950) 330.
D. Garg and E.N. Givens, Ind. Eng. Chem. Process Des. Dev., 24 (1985) 66.
S. Sato, M. Morita, T. Hashimoto, I. Mitunori, K. Chiba and H. Tagaya, Fuel, 68 (1989) 622.
A. Eamsiri, R. Jackson, K.C. Pratt, V. Christov and M. Marshall, Fuel, 71 (1992) 449.
B. Klopties, W. Hodek and F. Bandermann, Fuel, 69 (1990) 448.
K.C. Pratt and V. Christoverson, Fuel, 61 (1982) 460.
J.J. Llano, R. Rosal, H. Sastre and F.V. Dfez, Fuel, 73 (1994) 688.
D.D. Whitehurst, T.O. Mitchell and M. Farcasiu, Coal Liquefaction, Academic Press, New York, 1980.
J. Alvarez et a l . / Applied Catalysis A: General 128 (1995) 259-273
273
[9] K. Chiba, H. Tagoya, T. Kobayashi and Y. Shibuya, Ind. Eng. Chem. Res., 26 (1987) 1329.
[ 10] S.E. Moschopedis, J.G. Hawkins, J.F. Fryer and J.G. Speight, Fuel, 59 (1980) 647.
[11] T. Yotono and H. Marsh, in H.D. Schultz (Editor), Coal Liquefaction Products: NMR Spectroscopic
Characterization and Production Processes, Wiley, New York, 1983, p. 125.
[ 12 ] I. Mochida, O. Kazumasa and Y. Korai, Fuel, 64 ( 1985 ) 906.
[ 13] C.E. Snape, F.J. Derbyshire, H.P. Kottenstte and N.W. Smith, Am. Chem. Soc. Div. Fuel Chem. Prep., 34
(1989) 793.
[ 14] J.J. Alvarez Rodrfguez, M.Sc. Dissertation, University of Oviedo, 1994.
[ 15] R. Rosal, F.V. Dfez and H. Sastre, Fuel, 71 (1992) 761.