- Trang chủ >>
- Khoa Học Tự Nhiên >>
- Vật lý
using the free-to-total prostate-specific antigen
Bạn đang xem bản rút gọn của tài liệu. Xem và tải ngay bản đầy đủ của tài liệu tại đây (229.87 KB, 10 trang )
JGIM
REVIEW
739
Using the Free-to-total Prostate-specific Antigen
Ratio to Detect Prostate Cancer in Men
with Nonspecific Elevations of Prostate-specific
Antigen Levels
Richard M. Hoffman, MD, MPH, David L. Clanon, MD, Benjamin Littenberg, MD,
Joseph J. Frank, PhD, John C. Peirce, MD, MA, MS
BACKGROUND:
Prostate-specific antigen (PSA) levels between
4.0 to 10.0 ng/ml have poor specificity in prostate cancer
screening, leading to unnecessary biopsies.
OBJECTIVE:
To determine whether the free-to-total PSA ratio
(F/T PSA) improved the diagnostic accuracy of these nonspe-
cific PSA levels.
MEASUREMENTS AND MAIN RESULTS:
M
EDLINE
was searched
from 1986 to 1997. Additional studies were identified from
article bibliographies and by searching urology journals. Two
investigators independently identified English-language stud-
ies providing F/T PSA ratio test-operating characteristics
data on
Ն
10 cancer patients with PSA values between 2.0 and
10.0 ng/ml. Twenty-one of 90 retrieved studies met selection
criteria. Two investigators independently extracted data on
methodology and diagnostic performance. Investigator-selected
cut points for the optimal F/T PSA ratio had a median likeli-
hood ratio of 1.76 (interquartile range, 1.40 to 2.11) for a
positive test and 0.27 (0.20 to 0.40) for a negative test. As-
suming a 25% pretest probability of cancer, the posttest
probabilities were 37% following a positive test and 8% fol-
lowing a negative test. The summary receiver operating char-
acteristic curve showed that maintaining test sensitivity above
90% was associated with false positive rates of 60% to 90%.
Methodologic problems limited the validity and generalizabil-
ity of the literature.
CONCLUSIONS:
A negative test reduced the posttest probabil-
ity of cancer to approximately 10%. However, patients may
find that this probability is not low enough to avoid undergo-
ing prostate biopsy. The optimal F/T PSA ratio cut point and
precise estimates for test specificity still need to be deter-
mined.
KEY WORDS:
prostatic neoplasm; prostate-specific antigen;
diagnostic accuracy; free PSA.
J GEN INTERN MED 2000;15:739–748.
T
he prostate-specific antigen (PSA) assay is currently
considered the most useful tumor marker for detect-
ing prostate cancer. Both the American Cancer Society
and the American Urologic Association recommend an-
nual cancer screening with both PSA and digital rectal ex-
aminations.
1,2
However, not all observers find the data on
PSA persuasive. The National Cancer Institute, the Amer-
ican College of Physicians, and the U.S. Preventive Ser-
vices Task Force have all refused to recommend routine
screening because there is no conclusive evidence that
PSA testing reduces disease-specific morbidity or mortal-
ity.
3–5
Another major concern is that PSA lacks specificity
and screening leads to many unnecessary prostate biop-
sies, particularly for PSA values between 4.0 and 10.0
ng/ml. In this range, Catalona et al. found that the posi-
tive predictive value for PSA was only about 26%, al-
though nearly 80% of the cancers were organ confined.
6
This diagnostic “gray zone” (PSA values between 4.0 to
10.0 ng/ml) has led to different strategies to improve the
specificity of PSA, including measuring PSA velocity (rate of
change over time),
7
PSA density (PSA per unit of prostate
volume),
8
and age-specific reference ranges.
9
However, none
of these strategies have been widely accepted or proven ef-
fective in prospective trials. Recently, investigators have
begun measuring the ratio of free-to-total PSA. Serum
PSA exists in a free form as well as complexed to a num-
ber of protease inhibitors.
10–13
Most PSA is bound to alpha-
1-antichymotripsin (ACT),
11,14
and assays for total PSA
measure both this bound fraction and free PSA. Empirical
evidence has shown that cancer patients have a higher per-
centage of PSA bound to ACT than normal controls.
11,15,16
While the PSA-ACT complex can be measured directly,
these assays have very high intra-assay and inter-assay co-
efficients of variation and are considered unreliable.
12,17,18
Received from the Medicine Service, Albuquerque Department
of Veterans Affairs Medical Center (RMH, DLC) and University
of New Mexico School of Medicine, Albuquerque, NM (RMH); De-
partment of Medicine, The University of Vermont, Burlington,
Vt (BL); the Department of Medical Education and Research,
Good Samaritan Regional Medical Center, Phoenix, Ariz (JCP,
JJF); and the Laboratory Sciences of Arizona, Phoenix, Ariz (JJF).
This work was presented in part at the Society of General In-
ternal Medicine annual meeting, Washington, DC, May 1997.
Address correspondence and reprint requests to Dr. Hoff-
man: Albuquerque VA Medical Center, 111GIM, 1501 San Pedro
Dr. SE, Albuquerque, NM 87108 (e-mail: ).
740
Hoffman et al., Free-to-total PSA Ratio
JGIM
Most investigators recommend measuring free and total
PSA and calculating the free-to-total ratio.
13,16,18
Initially, studies using free PSA assays focused on
PSA ranges between 4.0 to 10.0 ng/ml because men with
levels
Ն
10.0 ng/ml are at high risk for cancer and men
with levels below 4.0 ng/ml—the upper limit of normal—
would not routinely be biopsied. Subsequently, however,
a 7.9% prevalence of prostate cancer was reported in men
with PSA levels between 2.9 to 4.0 ng/ml,
19
and men with
levels between 2.0 to 3.0 ng/ml were found to have an in-
creased risk of developing cancer compared with men
with levels less than 1.0 ng/ml.
20
Consequently, some in-
vestigators now recommend measuring free PSA when to-
tal PSA levels are between 2.0 and 10.0 ng/ml.
21,22
In 1998, the U.S. Food and Drug Administration ap-
proved the Hybritech Tandem free PSA assays.
23
Using
the free-to-total PSA ratio as a criterion for prostate bi-
opsy could substantially change prostate cancer screen-
ing practices. We conducted a meta-analysis to evaluate
the methodologic quality of the free PSA literature and to
determine the diagnostic performance of the free-to-total
PSA ratio for detecting prostate cancer when PSA levels
are between 2.0 and 10.0 ng/ml.
METHODS
Literature Search and Data Abstraction
M
EDLINE
was searched from January 1986 through
July 1997, combining the MeSH headings “prostate-spe-
cific antigen” and “prostatic neoplasm” and then linking
them with the MeSH heading “alpha-1-antichymotrypsin”
or with the text words “free” or “gamma-seminoprotein.”
Articles were also identified from bibliographies of review
articles and retrieved articles, and the tables of contents
from the January 1994 through December 1997 issues of
the journals
Urology
and
Journal of Urology.
Article selection criteria included English-language
studies using free PSA assays and providing data on sen-
sitivity and specificity. Studies had to evaluate at least 10
prostate cancer patients and 10 histologically confirmed
noncancer controls. Studies using only gamma-semino-
protein assays or the ratio of alpha-1-antichymotrypsin to
total PSA (neither of which directly correlate with the free-
to-total PSA ratio) were excluded as were studies that did
not provide diagnostic performance data. Two investiga-
tors reviewed all titles and abstracts, retrieving all articles
that potentially met the selection criteria. Studies re-
ported only in abstract form were retrieved but not in-
cluded in the analysis; however,
MEDLINE
author searches
were performed to see if the results were subsequently
published. We retrieved one study first identified only as
an abstract.
24
Retrieved articles were abstracted for study
design features and data on test operating characteristics
for the free-to-total PSA ratio. Reviewers examined arti-
cles independently; if there were any disagreements on
data abstraction, the reviewers tried to reach consensus
or used a third reviewer to referee.
Quality Assessment
All studies meeting selection criteria were included in
the meta-analysis. However, we also used methodologic
quality criteria based on published guidelines to evaluate
study validity and generalizability.
25–30
Study validity was
assessed by whether a study selected an appropriate ref-
erence (gold) standard, appropriately performed the diag-
nostic test, independently interpreted test results, and
avoided work-up bias. Generalizability was assessed by
the spectrum of study patients and the technical details
of the test. Precision of results was based on the number
of subjects with cancer. We described the number of
studies meeting methodologic criteria and used these
classifications for sensitivity analyses.
The most appropriate reference standard was consid-
ered to be either radical prostatectomy or multiple sys-
tematic transrectal prostate needle biopsies with long-
term clinical follow-up for men with negative biopsies.
Studies using either transurethral resections of the pros-
tate or biopsies without long-term clinical follow-up have
a moderate risk of bias because sampling errors can af-
fect diagnostic test performance. Appropriately perform-
ing the free PSA assay was based on specimen handling,
including storage temperature and duration, and the mo-
lar response of the immunoassay. Specimens retained be-
yond 24 hours should be frozen, and free PSA remains
significantly more stable when frozen at
Ϫ
70
Њ
C than at
Ϫ
20
Њ
C.
31,32
Equimolar antibodies—directed at two distinct
epitopes that are not blocked by ACT binding—most ac-
curately determine the free-to-total PSA ratio.
13,17,33
Independent interpretation of test results (blinding) is
defined by the absence of test-review or diagnostic-review
bias.
25
Test-review bias occurs when the diagnostic test
interpretation is influenced by the results of the reference
standard test. Diagnostic review bias occurs when the re-
sults of the diagnostic test affect the interpretation of the
reference standard test. We looked for explicit statements
that the study was blinded. Work-up bias (verification
bias) was considered possible when the reference stan-
dard was not uniformly applied to all patients undergoing
the diagnostic test, especially if patients with positive (or
negative results) were preferentially referred for further
testing.
25,29,30
Work-up bias was minimized when the ref-
erence standard was uniformly applied to consecutive or
randomly selected subjects.
Generalizability of study results depends upon the
clinical spectrum of study subjects.
25
The important pa-
tient characteristics for prostate cancer testing include
age, race, digital rectal examination findings, urinary
symptoms, presence of benign prostatic hyperplasia, and
cancer stage.
34
Additionally, investigators should explic-
itly describe study eligibility criteria. Finally, the gener-
alizability of free PSA immunoassays can be further
JGIM
Volume 15, October 2000
741
increased by calibrating against a purified standard of
PSA-ACT and free PSA, thus minimizing interassay
variability.
18,35,36
Diagnostic Performance
Diagnostic performance was assessed according to
standard epidemiologic definitions.
37
Sensitivity is the
proportion of cancer cases with abnormal free-to-total
PSA ratios. Specificity is the proportion of noncancer con-
trols with normal free-to-total PSA ratios. We determined
the likelihood ratio, which compares the proportion of
people with and without the target disorder within a stra-
tum of diagnostic test results. For each study where in-
vestigators selected a single best free-to-total PSA ratio
cut point, we computed the likelihood ratio for positive
and negative tests, the associated 95% confidence inter-
vals, and the nonparametric trapezoidal area under the
receiver operating characteristic curve.
38
These diagnostic
performance data were described by median values and
interquartile ranges.
We used the median likelihood ratios to evaluate the
relative effects of positive and negative test results on
probability revision with Bayes’ theorem
37
:
For PSA levels between 4.0 and 10.0 ng/ml, the probabil-
ity of cancer is approximately 25%,
6,39
which becomes the
pretest probability for the above equation. Probability is
converted to odds with the equation:
Using Bayes’ theorem, we plotted the investigator-selected
cut point for each study against the posttest probabilities
for both positive and negative results. Regression lines,
fitted with Statistica (Statsoft, Inc., Tulsa, OK), were not
extrapolated beyond the range of empiric data.
Summary Receiver Operating
Characteristic Curves
Summary receiver operating characteristic curves
were obtained following the methods of Moses and Litten-
berg.
40,41
The true positive (TPR) and false positive rates
(FPR) from each study were converted to their logistic
transforms using the following equations:
The purpose of this transformation was to linearize the
data for linear regression analysis. To avoid having cells
with zero, we added one-half to all counts in each cell.
Two additional terms were defined:
S was the sum of the two transforms and was related to
Posttest odds for prostate cancer
Pretest odds for prostate cancer
Likelihood ratio for the diagnostic test results
×
=
odds probability 1 probability–()⁄=
Logit TPR()In TPR 1 TPR=()⁄{}=
Logit FPR()In FPR 1 FPR=()⁄{}=
Sitlog TPR() itlog FPR()+=
Ditlog TPR() it FPR()log–=
the diagnostic cut point selected by the investigators. D,
the logarithm of the ratio TPR/FPR, was a measure of how
well the test discriminated between diseased and nondis-
eased subjects. The relationship between S and D was es-
timated with SAS
42
by using a weighted least squares re-
gression to fit the linear model: D
ϭ
bS
ϩ
i. After estimating
the slope and intercept of the transformed line, we back-
transformed the line to yield a summary curve consistent
with the TPR and FPR reported for each study.
We tested for homogeneity by plotting the 95% confi-
dence intervals for the TPR and FPR for individual studies
against the summary receiver operating characteristic
curve. If the confidence intervals for all studies over-
lapped the summary curve, then the studies were consid-
ered to be homogeneous. Sensitivity analyses were per-
formed by classifying studies into subgroups according to
methodologic criteria and comparing the D statistics. The
nonparametric Mann Whitney
U
test was used for statisti-
cal comparisons.
RESULTS
Overall, we retrieved 90 articles from an initial 252
references identified by the literature search, but only 54
studies presented original diagnostic performance data.
An additional 16 studies were excluded because we could
not abstract data for PSA values between 2.0 and 10.0
ng/ml.
14,16,43–56
We also excluded 5 studies with inade-
quate sample sizes,
57–61
6 with superseded data,
62–67
3 re-
porting only gamma-seminoprotein data,
68–70
and 3 re-
porting only ACT ratio data.
11,16,71
The remaining 21
studies reported diagnostic performance data for the free-
to-total PSA ratio when total PSA levels ranged from ei-
ther 4.0 to 10.0 ng/ml,
35,73–88
2.5 to 10.0 ng/ml,
89,90
or
2.6 to 4.0 ng/ml.
91
Seventeen of the 21 studies presented
data on investigator-selected cut points.
73–81,83,84,86–90
Table 1 shows the number of studies meeting the
methodologic criteria used to evaluate validity and gener-
alizability. Thirteen studies used needle biopsy as the sin-
gle reference standard, but none of them used long-term
clinical follow-up to define true negative test results. The
other studies used a combination of reference standards
including 4
72,80,85,86
using radical prostatectomy. Two
studies did not perform biopsies on all control sub-
jects.
75,86
The majority of studies used appropriate speci-
men handling and equimolar assays, but only 1 study
calibrated the free PSA assay against a reference stan-
dard.
35
Only 3 studies explicitly indicated that test inter-
pretations were blinded.
77,81,83
Nine studies evaluated
fewer than 30 cancer cases. Six studies used free PSA
testing in screening populations
74,76,77,83,89,91
; the remaining
studies either tested referral populations, often with fro-
zen stored serum samples, or did not describe indications
for testing. The majority of studies failed to either describe
eligibility criteria or to report on age, race, symptoms, dig-
ital rectal examination findings, and cancer stage.
Table 2 shows the diagnostic performance data for
the 17 studies presenting an investigator-selected cut
742
Hoffman et al., Free-to-total PSA Ratio
JGIM
point for PSA values between 2.0 to 10.0 ng/ml. Investi-
gators generally selected these cut points to maximize
sensitivity, although several studies selected cut points to
maximize accuracy (overall proportion of true positive and
true negative tests)
75,80,90
and 1 study maximized specific-
ity.
79
In these studies, the median likelihood ratio of a
positive test was 1.76 (25th percentile, 1.40; 75th percen-
tile, 2.11) and the median likelihood ratio of a negative
test was 0.27 (0.20, 0.40). The associated median area
under the receiver operating characteristic curve was
0.68 (0.64, 0.71). Assuming a 25% pretest probability of
cancer, Bayesian analysis with these median likelihood
ratios led to a posttest cancer probability of 37% (32%,
41%) following a positive test and 8% (6.2%, 11.7%) fol-
lowing a negative test.
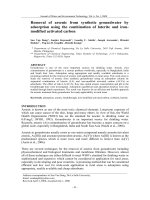
Figure 1 shows the investigator-selected cut points
plotted against posttest probabilities, again assuming a
pretest probability of 25%. For negative tests (the lower
line), the relationship was linear with a slope of approxi-
mately zero (
Ϫ
0.002, SE
ϭ
0.002), indicating that the
posttest probability did not depend on the cut point. Fol-
lowing a negative test, the probability of cancer was re-
duced by over 50%. We found a logarithmic relationship
between the cut point and posttest probability for positive
Table 1. Number of Studies Meeting Criteria for High Quality by Methodologic Category (
N
؍
21)
Methodologic Category Criteria for Acceptable Quality
n
(%)
Reference standard Radical prostatectomy or systematic prostate biopsies
with
Ն
1 year of clinical follow-up
4 (19)
Avoidance of work-up bias Uniform application of reference standard 13 (62)
Consecutive or random sampling 8 (38)
Free PSA assay Specimen handling: fresh specimen or long-term
storage at
Ϫ
70
°
C 14 (67)
Assay: equimolar 15 (71)
Calibrated against a reference standard 1 (5)
Independence of interpretations Explicit statement of binding 3 (14)
Sample size
Ն
30 cancers 12 (57)
Spectrum of patients Age 17 (81)
Race 4 (19)
Asymptomatic (screening) 6 (29)
Digital rectal examination results 6 (29)
Benign prostatic hyperplasia 18 (86)
Cancer stage 16 (76)
Study eligibility criteria presented 15 (71)
Table 2. Performance Characteristics of Investigator-Selected Optimal Free-To-Total Ratio Cut Points
*
PSA Range F/T PSA Ratio LR Positive LR Negative AUROC
Study Subjects Cancers (%) (ng/ml) cut point, % (95% CI) (95% CI) (95% CI)
Alivizatos et al.
73
102 22 (22) 4.0 to 10.0 20 2.08 (1.41 to 3.06) 0.42 (0.22 to 0.82) 0.69 (0.57 to 0.81)
Bangma et al.
74
427 99 (23) 4.0 to 10.0 20 1.67 (1.44 to 1.93) 0.37 (0.24 to 0.56) 0.66 (0.60 to 0.72)
Bjork et al.
75
31 12 (39) 4.0 to 10.0 17 2.11 (1.01 to 4.40) 0.49 (0.22 to 1.08) 0.68 (0.48 to 0.88)
Catalona et al.
76
113 50 (44) 4.0 to 10.0 20.3 1.49 (1.21 to 1.83) 0.21 (0.08 to 0.53) 0.65 (0.55 to 0.75)
Catalona et al.
77
773 379 (49) 4.0 to 10.0 25 1.18 (1.12 to 1.25) 0.27 (0.17 to 0.43) 0.57 (0.53 to 0.61)
Egawa et al.
78
78 28 (36) 4.0 to 10.0 17 2.88 (1.75 to 4.77) 0.34 (0.18 to 0.64) 0.75 (0.63 to 0.85)
Filella et al.
79
59 11 (19) 4.0 to 10.0 8 10.9 (2.82 to 42.1) 0.57 (0.34 to 0.95) 0.71 (0.51 to 0.91)
Jung et al.
80
43 26 (60) 4.0 to 10.0 16 3.95 (1.73 to 9.07) 0.20 (0.10 to 0.43) 0.87 (0.75 to 0.99)
Luderer et al.
81
57 25 (44) 4.0 to 10.0 20 1.76 (1.22 to 2.54) 0.24 (0.09 to 0.67) 0.69 (0.55 to 0.83)
Partin et al.
83
217 139 (64) 4.0 to 10.0 20 1.35 (1.16 to 1.56) 0.17 (0.08 to 0.37) 0.62 (0.54 to 0.70)
Prestigiacomo et al.
72
46 18 (39) 4.0 to 10.0 15 2.05 (1.35 to 3.11) 0.10 (0.02 to 0.47) 0.74 (0.60 to 0.88)
Prestigiacomo et al.
84
98 44 (45) 4.0 to 10.0 20 1.63 (1.27 to 2.11) 0.20 (0.08 to 0.52) 0.68 (0.58 to 0.78)
Van Cangh et al.
86
185 61 (33) 4.0 to 10.0 25 1.38 (1.19 to 1.61) 0.28 (0.13 to 0.60) 0.62 (0.54 to 0.70)
Vashi et al.
87
248 117 (47) 4.0 to 10.0 24 1.09 (1.01 to 1.18) 0.40 (0.17 to 0.94) 0.54 (0.46 to 0.62)
Wang et al.
88
62 23 (37) 4.0 to 10.0 15 1.77 (1.31 to 2.39) 0.09 (0.02 to 0.46) 0.71 (0.59 to 0.83)
Reissigl et al.
89
106 37 (35) 2.5 to 10.0 22 1.40 (1.19 to 1.65) 0.09 (0.02 to 0.44) 0.64 (0.54 to 0.74)
Toubert et al.
90
161 62 (39) 2.5 to 10.0 15 5.81 (3.27 to 10.3) 0.40 (0.28 to 0.56) 0.77 (0.69 to 0.85)
Catalona et al.
91
317 72 (23) 2.6 to 4.0 27 1.10 (1.00 to 1.21) 0.54 (0.26 to 1.12) 0.54 (0.46 to 0.62)
*Three investigators did not select optimal cut points.
39,85,88
PSA indicates prostate-specific antigen; F/T, free to total; LR, likelihood ratio; CI,
confidence interval; AUROC, area under the receiver operating curve.
JGIM Volume 15, October 2000 743
tests. The probability of cancer was greater than 70% for
cut points less than 10%, but less than 40% for cut
points above 20%.
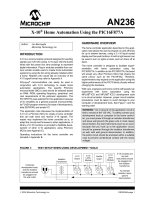
Figure 2 shows the estimated summary receiver oper-
ating characteristic curve based on the 17 studies with
investigator-selected cut points. The summary curve
shows that setting the free-to-total PSA ratio cut point to
achieve a true positive rate above 90% led to false positive
rates ranging from 60% to 90%. Conversely, setting the
cut point to achieve a false positive rate less than 10% led
to true positive rates ranging from 30% to 50%.
Graphical tests showed no significant heterogeneity
among studies, implying that between-study differences
in true positive and false positive rates arose from the dif-
ferent cut points selected by the investigators. As shown
in Table 3, we also performed sensitivity analyses based
on avoidance of work-up bias, specimen handling, type of
free PSA assay, blinding, purpose of testing, cohort as-
sembly, avoidance of spectrum bias, and sample size. Al-
though discriminating power as represented by the intercept
(D) of the (S, D) space regression line was consistently
lower in studies with greater methodologic rigor (except
for specimen handling), the differences did not achieve
statistical significance.
Several studies provided data for PSA levels below 4.0
ng/ml.
78,86,87,91
Median likelihood ratios were 1.64 (25th
percentile, 1.28; 75th percentile, 2.56) for positive tests,
0.27 (0.16, 0.45) for negative tests, and 0.67 (0.59, 0.76)
for the area under the receiver operating characteristic
curve. The literature suggested a 10% pretest probability
of prostate cancer for PSA values less than 4.0 ng/ml.
92
Therefore, the posttest cancer probability was 15.4% (12.5%,
22.1%) following a positive test and 2.9% (1.7%, 4.8%) fol-
lowing a negative test. However, the only screening study,
which evaluated 317 men with PSA values between 2.6 to
4.0 ng/ml, had a likelihood ratio of only 1.10 (95% confi-
dence interval, 1.00 to 1.21) for a positive test and a like-
lihood ratio of 0.54 (0.26, 1.12) for a negative test. In this
screening population, the posttest cancer probability was
10.9% (10.0%, 11.9%) following a positive test and 5.7%
(2.8%, 11.1%) following a negative test. The area under the
receiver operating characteristic curve was 0.54 (0.46, 0.62).
DISCUSSION
The free-to-total PSA ratio has been recommended as
an effective strategy to improve the specificity of total PSA
for “gray zone” values between 2.0 and 10.0 ng/ml. Our
meta-analysis showed that using the investigator-selected
free-to-total PSA cut point yielded modest revisions of
probability estimates for cancer. The median likelihood
ratio for a positive test was 1.76 (interquartile range, 1.40
to 2.11), a value which generates minimal changes in
posttest probabilities.
27
The median likelihood ratio for a
negative test was 0.27 (0.20, 0.40). Although this likeli-
hood ratio is considered to generate only small probability
changes,
27
a negative test substantially reduced the prob-
ability of prostate cancer from 25% to 8%.
When we plotted the investigator-selected cut points
against posttest probabilities, we found that the probabil-
ity revision following a negative test was independent of
FIGURE 1. Investigator-selected cut points for the free-to-total
PSA ratio are plotted against the posttest probabilities for posi-
tive and negative tests. Curves are based on a pretest proba-
bility of 25%.
FIGURE 2. The estimated summary receiver operating char-
acteristic curve based on the 17 studies presenting data on
investigator-selected cut points for the free-to-total PSA ratio.
744 Hoffman et al., Free-to-total PSA Ratio JGIM
the study cut point within the range of cut points that
were considered. In contrast, the posttest probability fol-
lowing a positive test depended upon the cut point. The
lower the cut point, the more likely that a patient had
prostate cancer, with the probability nearly doubling as
the cut point dropped from 20% to 10%. However, we can-
not endorse using a lower cut point because few studies
selected cut points less than 15% and more cancers will
be missed at lower cut points. Nonetheless, these results
suggested that using multiple cut points, especially for
evaluating positive tests, may provide more precise infor-
mation about the posttest probability for cancer.
Our results indicated that the free-to-total PSA ratio
did not have a high discriminating power. This finding
was supported by the relatively low median area under
the receiver operating characteristic curve of 0.68. Most of
the investigators chose an optimal free-to-total PSA cut
point that set the sensitivity around 95% to minimize the
chance of missing a cancer. The summary receiver oper-
ating characteristic curve showed that sensitivities above
90% were associated with very high false positive rates.
Investigators were willing to accept poor specificity
for the free-to-total PSA ratio because measuring free PSA
could reduce the number of unnecessary biopsies. How-
ever, potential spectrum bias and imperfect reference
standards made the estimates of specificity unreliable for
a screening population. Spectrum bias
25,30,93
was possible
because the majority of studies evaluated subjects re-
ferred to urologists with prostate abnormalities. The mag-
nitude and direction of this bias was difficult to assess be-
cause the indications for enrolling patients and performing
biopsies usually were not provided, and few studies pre-
sented complete demographic and clinical descriptions.
Another source of bias came from relying on the relatively
insensitive prostate needle biopsy for a reference stan-
dard. The transrectal prostate needle biopsy has false
negative rates of at least 20%.
94,95
Diagnostic test proper-
ties can change with disease prevalence when the refer-
ence test negative group contains many diseased sub-
jects.
96,97
Because the median cancer prevalence in these
studies of men with PSA values between 4.0 and 10.0 ng/ml
was 39%, specificity might be expected to differ in a
screening population in which disease prevalence is much
lower.
97
The literature also provided no consensus on the op-
timal free-to-total PSA cut point because assays and
specimen handling were not comparable across studies.
Only 4 studies clearly performed assays on fresh speci-
mens; the remaining studies either did not describe spec-
imen handling or else used specimens frozen for unre-
ported lengths of time. However, free PSA and PSA have
been shown to undergo significant degradation during
frozen storage. This implies that the free-to-total PSA ra-
tios reported for samples with long-term or uncertain
storage may be unreliable.
31,32,76
Inter-assay differences in
immunoresponsiveness between the skewed and equimo-
lar response assays can also affect the estimated ra-
tios.
13,17,33,98
Stamey has reported overcoming this prob-
lem by calibrating against a PSA-ACT and free PSA
standard.
36
However, only 1 group of investigators
35
cali-
brated their assay against such a standard.
Test-retest variability is an important problem with
free PSA assays. While the studies in our meta-analysis
generally reported a coefficient of variation for percent
free PSA less than 8% for control specimens, other inves-
tigators have shown higher coefficients of variation, rang-
ing from 10% to 16%, with serial blood sampling.
99,100
Without further data, investigators cannot yet establish
an optimal cut point for using the free-to-total PSA ratio
in prostate cancer screening.
We found additional methodologic flaws that threat-
ened the validity and generalizability of study results.
Work-up bias potentially occurred in the studies failing to
test all subjects with the same reference standard and
Table 3. Sensitivity Analysis for Summary Reciever Operating Characteristic Curve: Comparison of Median D Values* for
Studies Stratified by Presence and Absence of Methodologic Features. (
N
؍ 17)
Feature Present
Yes,
n
No,
n
Methodologic Feature Studies (subjects) Median D Value Studies (subjects) Median D Value
P
Value
†
Avoidance of work-up bias
‡
11 (2,262) 1.86 6 (540) 2.35 .31
Appropriate specimen handling
§
10 (2,048) 1.99 7 (754) 1.86 .84
Equimolar assay 11 (2,047) 1.86 6 (755) 2.59 .19
Explicit blinding 3 (1,047) 1.86 14 (1,755) 2.03 .45
Screening cohort 5 (1,636) 1.86 12 (1,166) 2.03 .34
Consecutive or random selection 6 (1,005) 1.76 11 (1,797) 2.01 .48
Avoidance of spectrum bias
ʈ
6 (1,658) 1.97 11 (1,144) 1.98 .76
Sample size Ն30 9 (2,325) 1.86 8 (477) 2.20 .15
*The D value is the logarithm of the true positive rate/false positive rate and is a measure of the test’s discriminating power.
†
Mann-Whitney U test comparing median D values.
‡
All subjects within a study underwent the same reference test evaluation.
§
Assay performed on specimens that were fresh or stored at
Ϫ
70
Њ
C.
ʈ
Clinical description included age, digital rectal examination finding, and cancer stage.
JGIM Volume 15, October 2000 745
when subjects were not consecutively or randomly se-
lected. Many studies were retrospective and patient selec-
tion was based on having both a biopsy and enough
stored serum to run assays. Additionally, the selection of
reference standards was flawed. The definitive reference
standard, radical prostatectomy, was used in only a few
studies and was not applied to all subjects. Transrectal
prostate needle biopsy, the most frequently used reference
standard, has a high false negative rate.
94,95
However, no
study used long-term clinical follow-up to determine the
validity of the false negative biopsy.
Generalizing study results was difficult because few
studies provided explicit eligibility criteria or described
the subjects’ ages, clinical symptoms, digital rectal exam-
ination findings, and cancer stages. Although investigators
reported on various different free PSA assays, only 1 study
calibrated their results against a reference standard. Fi-
nally, few studies had large enough sample sizes to ensure
adequate precision for estimating diagnostic accuracy.
Although sensitivity analyses did not show statisti-
cally significant differences between subgroups defined by
quality criteria, our power to detect such an effect was low
with only 17 eligible studies. Nonetheless, the discrimi-
nating power was consistently lower in studies with
greater methodologic rigor.
Four studies provided data on using the free-to-total
PSA ratio when the total PSA was less than 4.0 ng/ml.
The only screening study, which excluded men with ab-
normal digital rectal examinations, reported likelihood ra-
tios that generated extremely small probability revisions.
Additionally, the area under the receiver operating char-
acteristic curve was 0.54, indicating poor discriminating
power. None of the other studies stratified data by digital
rectal examination findings, leaving them susceptible to
patient selection bias because men undergoing biopsies
with a normal PSA level are more likely to have abnormal
digital rectal examinations. Therefore, using free-to-total
PSA ratios when total PSA is less than 4.0 ng/ml is not
supported by the available literature.
Our study results potentially could be limited by
missing relevant studies. However, we conducted an ex-
haustive literature search, including a hand search of
leading urology journals. We did not include foreign lan-
guage studies, although we reviewed the English-language
abstracts. The homogeneity of study results seen in the
summary receiver operating characteristic curve and the
lack of significant differences in the sensitivity analyses
suggest that we have appropriately summarized the avail-
able literature.
Based on our meta-analysis of the free-to-total PSA
ratio, we concluded that the test did not have good dis-
criminating power and that likelihood ratios for positive
tests had minimal effect on probability revision. A nega-
tive test result in a screening population could reduce the
posttest probability for cancer to approximately 10%. This
information may be helpful in clinical decision making
and could reduce the number of unnecessary biopsies.
However, patients may find that this probability is not low
enough to avoid undergoing a prostate biopsy.
Methodologic flaws in reference standards and the
potential for work-up and spectrum biases limited the valid-
ity and generalizability of the free PSA literature. No opti-
mal cut point could be determined from the meta-analysis
and estimates for test specificity—the potential reduction
in unnecessary biopsies—were imprecise.
Further research is needed to accurately assess the
diagnostic performance and utility of the free-to-total PSA
ratio. The test should be evaluated in prospective studies
consecutively enrolling subjects from screening popula-
tions. Data should be reported on age, digital rectal exam-
ination findings, symptoms, and ethnicity; the most im-
portant population to study is men with indeterminate
PSA values and normal digital rectal examinations. Using
free PSA assays calibrated against a purified reference
standard would increase the generalizability of recom-
mended cut points. Investigators should also consider re-
porting diagnostic performance data for multiple cut points.
Similar design criteria should be applied for evaluating
other recently proposed strategies for improving the speci-
ficity of PSA, including prostate-specific membrane antigen,
human kallikrein 2, and newer assays of complexed PSA.
101
This work was supported by the VA Medical Center, Albuquer-
que, NM.
The authors thank Daniel Kent, MD, for his insightful com-
ments on an earlier draft of this paper.
REFERENCES
1. Mettlin C, Jones G, Averette H, Gusberg SB, Murphy GP. Defin-
ing and updating the American Cancer Society guidelines for the
cancer related check-up: prostate and endometrial cancers. CA
Cancer J Clin. 1993;43:42–6.
2. American Urological Association. Early detection of prostate can-
cer and use of transrectal ultrasound. American Urological Asso-
ciation 1992 Policy Statement Book. Baltimore, Md: Williams &
Wilkins; 1992.
3. PDQ. (Physician Data Query) [database online]. Bethesda, Md:
National Cancer Institute: 1984 – [updated 9/99]. Screening for
prostate cancer. Available from: National Cancer Institute; Na-
tional Library of Medicine, Bethesda, Md: CDP Technologies,
Inc., New York, NY; Lexis-Nexis, Miamisburg, Ohio.
4. American College of Physicians. Screening for prostate cancer.
Ann Intern Med. 1997;126:480–4.
5. U.S. Preventive Services Task Force. Guide to clinical preventive
services. 2nd ed. Baltimore: Williams & Wilkins; 1996.
6. Catalona WJ, Richie JP, Ahmann FR, et al. Comparison of digital
rectal examination and serum prostate specific antigen in the
early detection of prostate cancer: results of a multicenter clini-
cal trial of 6,630 men. J Urol. 1994;151:1283–90.
7. Carter HB, Pearson JD, Metter EJ, et al. Longitudinal evaluation
of prostate-specific antigen levels in men with and without pros-
tate disease. JAMA. 1992;267:2215–20.
8. Benson MC, Whang IS, Olsson CA, McMahon DJ, Cooner WH.
The use of prostate specific antigen density to enhance the pre-
dictive value of intermediate levels of serum prostate specific an-
tigen. J Urol. 1992;147:817–21.
9. Oesterling JE, Jacobsen SJ, Chute CG, et al. Serum prostate-
746 Hoffman et al., Free-to-total PSA Ratio JGIM
specific antigen in a community-based population of healthy
men. Establishment of age-specific reference ranges. JAMA. 1993;
270: 860–4.
10. Lilja H, Christensson A, Dahlén U, et al. Prostate-specific antigen
in serum occurs predominantly in complex with ␣
1
-antichymo-
trypsin. Clin Chem. 1991;37:1618–25.
11. Stenman UH, Leinonen J, Alfthan H, Rannikko S, Tuhkanen K,
Alfthan O. A complex between prostate-specific antigen and
␣
1
-antichymotrypsin is the major form of prostate-specific antigen
in serum of patients with prostatic cancer: assay of the complex
improves clinical sensitivity for cancer. Cancer Res. 1991;51:222–6.
12. Christensson A, Laurell CB, Lilja H. Enzymatic activity of pros-
tate-specific antigen and its reactions with extracellular serine
proteinase inhibitors. Eur J Biochem. 1990;194:755–63.
13. McCormack RT, Rittenhouse HG, Finlay JA, et al. Molecular
forms of prostate-specific antigen and the human kallikrein gene
family: a new era. Urology. 1995;45:729–44.
14. Lilja H. Regulation of the enzymatic activity of prostate-specific
antigen and its reactions with extracellular protease inhibitors in
prostate cancer. Scand J Clin Lab Invest Suppl. 1995;220:47–56.
15. Leinonen J, Lövgren T, Vornanen T, Stenman UH. Double-label
time-resolved immunofluorometric assay of prostate-specific an-
tigen and of its complex with ␣
1
-antichymotrypsin. Clin Chem.
1993;39:2098–103.
16. Christensson A, Björk T, Nilsson O, et al. Serum prostate specific
antigen complexed to ␣
1
-antichymotrypsin as an indicator of
prostate cancer. J Urol. 1993;150:100–5.
17. Abrahamsson PA, Lilja H, Oesterling JE. Molecular forms of se-
rum prostate-specific antigen. The clinical value of percent free
prostate-specific antigen. Urol Clin North Am. 1997;24:353–65.
18. Vessella RL, Lange PH. Issues in the assessment of prostate-
specific antigen immunoassays. An update. Urol Clin North Am.
1997;24: 261–8.
19. Colberg JW, Smith DS, Catalona WJ. Prevalence and pathologi-
cal extent of prostate cancer in men with prostate specific anti-
gen levels of 2.9 to 4.0 ng/ml. J Urol. 1993;149:507–9.
20. Gann PH, Hennekens CH, Stampfer MJ. A prospective evaluation
of plasma prostate-specific antigen for detection of prostatic can-
cer. JAMA. 1995;273:289–94.
21. Vashi AR, Oesterling JE. Percent free prostate-specific antigen:
entering a new era in the detection of prostate cancer. Mayo Clin
Proc. 1997;72:337–44.
22. Catalona WJ. Clinical utility of measurements of free and total pros-
tate-specific antigen (PSA): a review. Prostate Suppl. 1996; 7:64-9.
23. U.S. Food and Drug Administration. Center for Devices and Ra-
diological Health. Premarket Approval Decisions for March 1998.
Available at: :80/cdrh/pmamar98.html.
24. Catalona WJ, Partin AW, Slawin KM, et al. A multicenter clinical
trial evaluation of free PSA in the differentiation of prostate can-
cer from benign disease. J Urol. 1997;157(suppl):111.
25. Ransohoff DF, Feinstein AR. Problems of spectrum and bias in
evaluating the efficacy of diagnostic tests. New Engl J Med.
1978;299:926 –30.
26. Jaeschke R, Guyatt G, Sackett DL. Users’ guides to the medical
literature. III. How to use an article about a diagnostic test. A.
Are the results of the study valid? JAMA. 1994;271:389–91.
27. Jaeschke R, Guyatt GH, Sackett DL. Users’ guides to the medical
literature. III. How to use an article about a diagnostic test. B.
What are the results and will they help me in caring for my pa-
tients? JAMA. 1994;271:703–7.
28. Mulrow CD, Linn WD, Gaul MK, Pugh JA. Assessing quality of a
diagnostic test evaluation. J Gen Intern Med. 1989;4:288–95.
29. Irwig L, Tosteson ANA, Gatsonis C, et al. Guidelines for meta-
analyses evaluating diagnostic tests. Ann Intern Med. 1994;120:
667–76.
30. Reid MC, Lachs MS, Feinstein AR. Use of methodological stan-
dards in diagnostic test research. Getting better but still not
good. JAMA. 1995;274:645–51.
31. Arcangeli CG, Smith DS, Ratliff TL, Catalona WJ. Stability of se-
rum total and free prostate specific antigen under varying stor-
age intervals and temperatures. J Urol. 1997;158:2182–7.
32. Woodrum D, French C, Shamel LB. Stability of free prostate-spe-
cific antigen in serum samples under a variety of sample collec-
tion and sample storage conditions. Urology. 1996;48:33–9.
33. Jacobsen SJ, Lilja H, Klee GG, Wright GL, Jr., Pettersson K,
Oesterling JE. Comparability of the Tandem-R and IMx assays
for the measurement of serum prostate-specific antigen. Urology.
1994;44:512–8.
34. Pienta KJ, Esper PS. Risk factors for prostate cancer. Ann Intern
Med. 1993;118:793–803.
35. Marley GM, Miller MC, Kattan MW, et al. Free and complexed
prostate-specific antigen serum ratios to predict probability of
primary prostate cancer and benign prostatic hyperplasia. Urol-
ogy. 1996;48:16–22.
36. Stamey TA. Progress in standardization of immunoassays for
prostate-specific antigen. Urol Clin North Am. 1997;24:269–73.
37. Sackett DL, Haynes RB, Guyatt GH, Tugwell P. Clinical Epidemi-
ology. A basic science for clinical medicine. 2nd ed. Boston: Little,
Brown; 1991.
38. Peirce JC, Cornell RG. Integrating stratum-specific likelihood ra-
tios with the analysis of ROC curves. Med Decis Making.
1993;13:141–51.
39. Brawer MK, Chetner MP, Beatie J, Buchner DM, Vessella RL,
Lange PH. Screening for prostatic carcinoma with prostate spe-
cific antigen. J Urol. 1992;147:841–5.
40. Moses LE, Shapiro D, Littenberg B. Combining independent
studies of a diagnostic test into a summary ROC curve: data-
analytic approaches and some additional considerations. Stat
Med. 1993;12:1293–316.
41. Littenberg B, Moses LE. Estimating diagnostic accuracy from
multiple conflicting reports: a new meta-analytic method. Med
Decis Making. 1993;13:313–21.
42. SAS® Language: Reference. Version 6. Cary, NC: SAS Institute,
Inc.; 1990.
43. Elgamal AA, Cornillie FJ, Van Poppel HP, Van de Voorde WM,
McCabe R, Baert LV. Free-to-total prostate specific antigen ratio
as a single test for detection of significant stage T1c prostate can-
cer. J Urol. 1996;156:1042–9.
44. Froschermaier SE, Pilarsky CP, Wirth MP. Clinical significance of
the determination of noncomplexed prostate-specific antigen as a
marker for prostate carcinoma. Urology. 1996;47:525–8.
45. Junker R, Brandt B, Zechel C, Assmann G. Comparison of
prostate-specific antigen (PSA) measured by four combinations of
free PSA and total PSA assays. Clin Chem. 1997;43:1588–94.
46. Mitrunen K, Pettersson K, Piironen T, Björk T, Lilja H, Lövgren T.
Dual-label one-step immunoassay for simultaneous measure-
ment of free and total prostate-specific antigen concentrations
and ratios in serum. Clin Chem. 1995;41:1115–20.
47. Reissigl A, Klocker H, Pointner J, Ennemoser O, Falk M, Bartsch
G. Improvement of prostate cancer screening by determination of
the ratio free/total PSA in addition to PSA levels. Prostate.
1997;30:243–7.
48. Riccardo B, Alberino D, Fabrizio T, et al. Free to total prostatic
specific antigen ratio as a new diagnostic tool in prostatic carci-
noma. Anticancer Res. 1997;17:1297–302.
49. Stephan C, Lein M, Jung K, Schnorr D, Loening SA. The influ-
ence of prostate volume on the ratio of free to total prostate spe-
cific antigen in serum of patients with prostate cancer and be-
nign prostate hyperplasia. Cancer. 1997;79:104–9.
50. Tarle M, Kraljic I. Free and total serum PSA values in patients
with prostatic intraepithelial neoplasia (PIN), prostate cancer and
BPH. Is F/T PSA a potential probe for dormant and manifest can-
cer? Anticancer Res. 1997;17:1531–4.
51. Thiel RP, Oesterling JE, Wojno KJ, et al. Multicenter comparison
of the diagnostic performance of free prostate-specific antigen.
Urology. 1996;48:45–50.
JGIM Volume 15, October 2000 747
52. Wolff JM, Borchers H, Effert PJ, Habib FK, Jakse G. Free-to-total
prostate-specific antigen serum concentrations in patients with
prostate cancer and benign prostatic hyperplasia. Br J Urol.
1996;78:409–13.
53. Morote J, Raventós CX, Lorente JA, et al. Measurement of free
PSA in the diagnosis and staging of prostate cancer. Int J Can-
cer. 1997;71:756–9.
54. Murphy GP, Barren RJ, Erickson SJ, et al. Evaluation and com-
parison of two new prostate carcinoma markers. Free-prostate
specific antigen and prostate specific membrane antigen. Cancer.
1996;78:809–18.
55. Prestigiacomo AF, Stamey TA. Clinical usefulness of free and
complexed PSA. Scand J Clin Lab Invest Suppl. 1995;221:32–4.
56. Chen YT, Luderer AA, Thiel RP, Carlson G, Cuny CL, Soriano TF.
Using proportions of free to total prostate-specific antigen, age,
and total prostate-specific antigen to predict the probability of
prostate cancer. Urology. 1996;47:518–24.
57. Higashihara E, Nutahara K, Kojima M, et al. Significance of
serum free prostate specific antigen in the screening of prostate
cancer. J Urol. 1996;156:1964–8.
58. Morgan TO, McLeod DG, Leifer ES, Moul JW, Murphy GP. Pro-
spective use of free PSA to avoid repeat prostate biopsies in men
with elevated total PSA. Prostate Suppl. 1996;7:58–63.
59. Akdas A, Cevik I, Tarcan T, Turkeri L, Dalaman G, Emerk K. The
role of free prostate-specific antigen in the diagnosis of prostate
cancer. Brit J Urol. 1997;79:920–3.
60. Auvinen A, Tammela T, Stenman UH, et al. Screening for pros-
tate cancer using serum prostate-specific antigen: a randomised,
population-based pilot study in Finland. Br J Cancer. 1996;
74:568–72.
61. Correale M, Pagliarulo A, Donatuti G, et al. Preliminary clinical
evaluation of free/total PSA ratio by the IMMULITE system. Int J
Biol Markers. 1996;11:24–8.
62. Reissigl A, Pointner J, Horninger W, et al. Comparison of differ-
ent prostate-specific antigen cutpoints for early detection of pros-
tate cancer: results of a large screening study. Urology. 1995;46:
662–5.
63. Van Cangh PJ, De Nayer P, Sauvage P, et al. Free to total prostate-
specific antigen (PSA) ratio is superior to total-PSA in differenti-
ating benign prostate hypertrophy from prostate cancer. Prostate
Suppl. 1996;7:30–4.
64. Bangma CH, Kranse R, Blijenberg BG, Schröder FH. The value of
screening tests in the detection of prostate cancer. Part II: Retro-
spective analysis of free/total prostate-specific analysis ratio,
age-specific reference ranges, and PSA density. Urology. 1995;
46:779–84.
65. Bangma CH, Kranse R, Blijenberg BG, Schröder FH. The value of
screening tests in the detection of prostate cancer. Part I: Results
of a retrospective evaluation of 1726 men. Urology. 1995;46:773–8.
66. Bangma CH, Kranse R, Blijenberg BG, Schröder FH. Free and to-
tal prostate-specific antigen in a screened population. Br J Urol.
1997;79:756–62.
67. Morgan TO, McLeod DG, Leifer ES, Murphy GP, Moul JW. Pro-
spective use of free prostate-specific antigen to avoid repeat pros-
tate biopsies in men with elevated total prostate-specific antigen.
Urology. 1996;48:76–80.
68. Demura T, Shinohara N, Tanaka M, et al. The proportion of free
to total prostate specific antigen: a method of detecting prostate
carcinoma. Cancer. 1996;77:1137–43.
69. Demura T, Watarai T, Togashi M, Hirano T, Ohashi N, Koyanagi
T. Measurement of prostate specific antigen and ␥-seminoprotein
ratio: a new means of distinguishing benign prostatic hyperpla-
sia and prostate cancer. J Urol. 1993;150:1740–5.
70. Kuriyama M, Takeuchi T, Shinoda I, Okana M, Nishiura T. Clini-
cal evaluation of ␥-seminoprotein in prostate cancer. Prostate.
1986;8:301–11.
71. Stenman UH, Hakama M, Knekt P, Aromaa A, Teppo L, Leinonen
J. Serum concentrations of prostate specific antigen and its com-
plex with ␣
1
-antichymotrypsin before diagnosis of prostate can-
cer. Lancet. 1994;344:1594–8.
72. Prestigiacomo AF, Stamey TA. Can free and total prostate specific
antigen and prostatic volume distinguish between men with neg-
ative and positive systematic ultrasound guided prostate biop-
sies? J Urol. 1997;157:189–94.
73. Alivizatos G, Deliveliotis C, Mitropoulos D, et al. Does free to total
ratio of prostate-specific antigen alter decision-making on pros-
tatic biopsy? Urology. 1996;48:71–5.
74. Bangma CH, Rietbergen JBW, Kranse R, Blijenberg BG, Petter-
son K, Schröder FH. The free-to-total prostate specific antigen
ratio improves the specificity of prostate specific antigen in
screening for prostate cancer in the general population. J Urol.
1997;157:2191–6.
75. Björk T, Piironen T, Pettersson K, et al. Comparison of analysis of
the different prostate-specific antigen forms in serum for detection
of clinically localized prostate cancer. Urology. 1996;48: 882–8.
76. Catalona WJ, Smith DS, Wolfert RL, et al. Evaluation of percent-
age of free serum prostate-specific antigen to improve specificity
of prostate cancer screening. JAMA. 1995;274:1214–20.
77. Catalona WJ, Partin AW, Slawin KM, et al. Use of the percentage
of free prostate-specific antigen to enhance differentiation of
prostate cancer from benign prostatic disease. A prospective
multicenter clinical trial. JAMA. 1998;279:1542–7.
78. Egawa S, Soh S, Ohori M, et al. The ratio of free to total serum
prostate specific antigen and its use in differential diagnosis of
prostate carcinoma in Japan. Cancer. 1997;79:90–8.
79. Filella X, Alcover J, Molina R, et al. Clinical usefulness of free
PSA fraction as an indicator of prostate cancer. Int J Cancer.
1995;63:780–4.
80. Jung K, Stephan C, Lein M, et al. Analytical performance and
clinical validity of two free prostate-specific antigen assays com-
pared. Clin Chem. 1996;42:1026–33.
81. Luderer AA, Chen YT, Soriano TF, et al. Measurement of the pro-
portion of free to total prostate-specific antigen improves diag-
nostic performance of prostate-specific antigen in the diagnostic
gray zone of total prostate-specific antigen. Urology. 1995;
46:187–94.
82. Mione R, Aimo G, Bombardieri E, et al. Preliminary results of
clinical evaluation of the free/total prostate-specific antigen ratio
in a multicentric study. Tumori. 1996;82:543–9.
83. Partin AW, Catalona WJ, Southwick PC, Subong ENP, Gasior
GH, Chan DW. Analysis of percent free prostate-specific antigen
(PSA) for prostate cancer detection: influence of total PSA, pros-
tate volume, and age. Urology. 1996;48:55–61.
84. Prestigiacomo AF, Lilja HJ, Pettersson K, Wolfert RL, Stamey TA.
A comparison of the free fraction of serum prostate specific anti-
gen in men with benign and cancerous prostates: the best case
scenario. J Urol. 1996;156:350–4.
85. Roehrborn CG, Gregory A, McConnell JD, Sagalowsky AI, Wians
FH Jr. Comparison of three assays for total serum prostate-specific
antigen and percentage of free prostate-specific antigen in pre-
dicting prostate histology. Urology. 1996;48:23–32.
86. Van Cangh PJ, De Nayer P, De Vischer L, et al. Free to total
prostate-specific antigen (PSA) ratio improves the discrimination
between prostate cancer and benign prostatic hyperplasia (BPH)
in the diagnostic gray zone of 1.8 to 10 ng/mL total PSA. Urol-
ogy. 1996;48:67–70.
87. Vashi AR, Wojno KJ, Henricks W, et al. Determination of the “re-
flex range” and appropriate cutpoints for percent free prostate-
specific antigen in 413 men referred for prostatic evaluation us-
ing the AxSYM system. Urology. 1997;49:19–27.
88. Wang TJ, Hill TM, Sokoloff RL, Frankenne F, Rittenhouse HG,
Wolfert RL. Dual monoclonal antibody immunoassay for free
prostate-specific antigen. Prostate. 1996;28:10–6.
89. Reissigl A, Klocker H, Pointner J, et al. Usefulness of the ratio
free/total prostate-specific antigen in addition to total PSA levels
in prostate cancer screening. Urology. 1996;48:62–6.
748 Hoffman et al., Free-to-total PSA Ratio JGIM
90. Toubert ME, Guillet J, Chiron M, et al. Percentage of free serum
prostate-specific antigen: a new tool in the early diagnosis of pro-
static cancer. Eur J Cancer. 1996;32A:2088–93.
91. Catalona WJ, Smith DS, Ornstein DK. Prostate cancer detection
in men with serum PSA concentrations of 2.6 to 4.0 ng/ml and
benign prostate examination. Enhancement of specificity with
free PSA measurements. JAMA. 1997;277:1452–5.
92. Schröder FH, van der Cruijsen-Koeter I, de Koning HJ, Vis AN,
Hoedemaker RF, Kranse R. Prostate cancer detection at low pros-
tate specific antigen. J Urol. 2000;163:806–12.
93. Lachs MS, Nachamkin I, Edelstein PH, Goldman J, Feinstein AR,
Schwartz JS. Spectrum bias in the evaluation of diagnostic tests:
lessons from the rapid dipstick test for urinary tract infection.
Ann Intern Med. 1992;117:135–40.
94. Stroumbakis N, Cookson MS, Reuter VE, Fair WR. Clinical sig-
nificance of repeat sextant biopsies in prostate cancer patients.
Urology. 1997;49(suppl):113–8.
95. Ellis WJ, Brawer MK. Repeat prostate needle biopsy: who needs
it? J Urol. 1995;153:1496–8.
96. Buck AA, Gart JJ. Comparison of a screening test and a reference
test in epidemiologic studies. Indices of agreement and their rela-
tion to prevalence. Am J Epidemiol. 1966;83:586–92.
97. Boyko EJ, Alderman BW, Baron AE. Reference test errors bias
the evaluation of diagnostic tests for ischemic heart disease.
J Gen Intern Med. 1988;3:476–81.
98. Nixon RG, Petteway JC, Meyer GE, Brawer MK. Comparison of
three investigative assays for the free form of prostate-specific
antigen. J Urol. 1997;157(suppl):255.
99. Ornstein DK, Smith DS, Rao GS, Basler JW, Ratliff TL, Catalona
WJ. Biological variation of total, free and percent free serum
prostate specific antigen levels in screening volunteers. J Urol.
1997;157:2179–82.
100. Nixon RG, Lilly JD, Liedtke RJ, Batjer JD. Variation of free and
total prostate-specific antigen levels: The effect on percent free/
total prostate-specific antigen. Arch Pathol Lab Med. 1997;121:
385–91.
101. Brawer MK. Prostate-specific antigen: current status. CA Cancer
J Clin. 1999;49:264–81.