parallel reverse genetic screening in mutant human cells using transcriptomics
Bạn đang xem bản rút gọn của tài liệu. Xem và tải ngay bản đầy đủ của tài liệu tại đây (2.57 MB, 9 trang )
Published online: August 1, 2016
Report
Parallel reverse genetic screening in mutant human
cells using transcriptomics
Bianca V Gapp1,†, Tomasz Konopka1,†, Thomas Penz2, Vineet Dalal1, Tilmann Bürckstümmer3,
Christoph Bock2,4,5 & Sebastian MB Nijman1,2,6,*
Abstract
Reverse genetic screens have driven gene annotation and target
discovery in model organisms. However, many disease-relevant
genotypes and phenotypes cannot be studied in lower organisms. It
is therefore essential to overcome technical hurdles associated
with large-scale reverse genetics in human cells. Here, we establish
a reverse genetic approach based on highly robust and sensitive
multiplexed RNA sequencing of mutant human cells. We conduct
10 parallel screens using a collection of engineered haploid isogenic
cell lines with knockouts covering tyrosine kinases and identify
known and unexpected effects on signaling pathways. Our study
provides proof of concept for a scalable approach to link genotype
to phenotype in human cells, which has broad applications. In
particular, it clears the way for systematic phenotyping of still
poorly characterized human genes and for systematic study of
uncharacterized genomic features associated with human disease.
Keywords kinases; multiplexed RNA sequencing; parallel screening; reverse
genetics; systematic phenotyping
Subject Categories Chromatin, Epigenetics, Genomics & Functional
Genomics; Methods & Resources
DOI 10.15252/msb.20166890 | Received 16 February 2016 | Revised 6 July
2016 | Accepted 7 July 2016
Mol Syst Biol. (2016) 12: 879
Introduction
Forward and reverse genetic approaches have both been crucial for
elucidating fundamental biological processes as well as identifying
therapeutic targets. These approaches identify genes underlying a
particular trait (forward genetics) or uncover phenotypes of particular mutants such as gene knockouts (reverse genetics). Forward
genetic screening has been employed extensively in human cells
using RNAi, gene trap, and CRISPR/Cas9 approaches (Lehner, 2013;
Mohr et al, 2014; Shalem et al, 2015). In contrast, large-scale
1
2
3
4
5
6
reverse genetic approaches in human cells have been limited to
arrayed RNAi screens and typically only interrogated a single
phenotype such as viability or changes in a particular signal transduction pathway (Brummelkamp et al, 2003; Paulsen et al, 2009;
Zhang et al, 2009; Kranz & Boutros, 2014; Tiwana et al, 2015).
Thus, deep phenotyping of gene mutants has been largely restricted
to model organisms (Giaever et al, 2002; White et al, 2013; Shah
et al, 2015).
One of the hurdles associated with large-scale reverse genetics in
human cells is the technical challenge to generate large sets of individual, targeted mutants. Earlier methods such as RNAi provided a
scalable method but suffer from incomplete knockdown and offtarget effects that introduce substantial noise and hinder the interpretation of results (Kaelin, 2012). A second hurdle includes the
comprehensive phenotyping of large sets of samples: Mammalian
cells can contain thousands of features of potential interest and
many of these are cell type specific. The net impact of these difficulties is the limitation of reverse genetic approaches in human cells
to a small number of mutants. This slows down the study of fundamental human biology and hinders understanding of diseases. As
many mutations are species specific, they cannot be modeled in
other organisms. There is thus a need for a general, scalable, and
accessible method for reverse genetics in human cells.
In this work, we exploit advances in parallel sequencing and
genome editing (van Dijk et al, 2014; Barrangou et al, 2015) to
revisit reverse genetics in human cells. We first establish a phenotypic profiling method based on RNA sequencing that is scalable
and suitable for large-scale screening. We then perform 10 parallel
screens in a collection of 64 mutant cell lines derived from a haploid
parental line (Carette et al, 2010). The collection includes cells
deficient in 55 individual tyrosine kinases.
Results
Transcriptional profiling has been demonstrated in yeast to connect
genotypes to phenotypes and is thus a suitable assay for reverse
Nuffield Department of Clinical Medicine, Ludwig Cancer Research Ltd., University of Oxford, Oxford, UK
CeMM Research Center for Molecular Medicine of the Austrian Academy of Sciences, Vienna, Austria
Horizon Genomics, Vienna, Austria
Department of Laboratory Medicine, Medical University of Vienna, Vienna, Austria
Max Planck Institute for Informatics, Saarbrücken, Germany
Nuffield Department of Clinical Medicine, Target Discovery Institute, University of Oxford, Oxford, UK
*Corresponding author. Tel: +44 1865 612885; E-mail:
†
These authors contributed equally to this work
ª 2016 The Authors. Published under the terms of the CC BY 4.0 license
Molecular Systems Biology
12: 879 | 2016
1
Published online: August 1, 2016
Molecular Systems Biology
Parallel reverse genetic screening in mutant human cells
genetics (DeRisi et al, 1997; Hughes et al, 2000). In particular,
specific genetic, chemical, and environmental perturbations have
been shown to yield gene expression signatures that provide insight
into gene function (Holstege et al, 1998; Chua et al, 2006; Lamb
et al, 2006; Hu et al, 2007; van Wageningen et al, 2010; Lenstra
et al, 2011; Kemmeren et al, 2014). We wished to apply a similar
strategy based on perturbations to study human cells. We reasoned
that shallow sequencing of mRNA, previously deployed to measure
single-cell transcriptomes (Wu et al, 2014), would provide the
throughput required for screening applications while maintaining
sufficient resolution to capture expression changes. We thus decided
to measure transcriptional profiles using a library preparation protocol that amplifies the 30 ends of transcripts and is designed to facilitate multiplexing.
To explore and benchmark shallow sequencing for systematic
screening, we performed perturbation experiments in human HAP1
cells (Carette et al, 2010). Cells were cultured under reduced serum
conditions for 16 h and stimulated with seventy diverse stimuli,
including polypeptides and small molecules (Fig EV1A and
Table EV1). Most conditions were measured in two biological replicates, and 48 samples were combined per Illumina HiSeq lane,
yielding 2–4 million reads per sample. Expression profiles of
A
D
B
Bianca V Gapp et al
replicate samples were strongly correlated, indicating robust and
consistent performance of the assay (Fig 1A). Modeling of sequencing depth showed that measuring ~1 million reads per sample was
sufficient to identify nearly all the ~12,000 genes expressed in HAP1
cells (Fig 1B). Moreover, we estimated that our depth range should
enable us to call upregulation of expression by a twofold change in
around two-thirds and upregulation with threefold change in more
than 90% of the expressed genes.
Through comparison of stimulated to mock-treated samples, we
determined sample-wise signatures of differentially expressed genes.
We also computed group-wise signatures using concordance across
replicate samples. Using data from a stimulation performed in eight
replicates, we estimated that group-wise signatures were robust for
screening when based on just two replicates (Fig EV1B). Together,
these technical metrics indicate that the approach produces gene
signatures that are informative.
Next, we studied the specific signatures induced by our panel of
stimuli. Around half of the stimuli elicited discernible transcriptional
responses of up to ~200 genes under the chosen experimental conditions. Absence of signatures for several of the stimuli could be due
to timing, dosing, assay sensitivity, or true unresponsiveness. Gene
ontology analysis of signature genes identified pathways previously
C
E
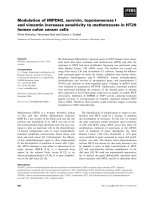
Figure 1. A platform for large-scale cell profiling by shallow RNA sequencing.
A Spearman correlations between replicates of expression profiles in HAP1 cells measured by shallow RNA-seq. Libraries were prepared using a protocol capturing
3-prime ends of polyadenylated transcripts. Inset shows gene expression values in a representative pair of replicates.
B Data-based modeling of the effect of sequencing depth on gene expression analysis. Dots represent synthetic samples obtained by pooling 24 HAP1 wild-type
sequencing runs and subsampling. Line labeled “Expressed” shows the number of genes that can be detected with expression above a threshold (transcripts per
million reads above 1). Lines labeled with FC show estimates of the number of genes that could be detected as differentially expressed were their expression to
change by the indicated factor. FC, fold change; K, thousand; M, million.
C Clustering of signature gene sets from polypeptide and small molecule stimulations. Inset shows strategy for obtaining gene signatures wherein each stimulated
sample is compared to a control set, and a signature is obtained by consensus of two replicates. The heatmap shows a clustering of stimuli wherein similarities are
assessed by 1 – Jaccard index of the signature sets. The bar chart displays sizes of signature sets. Solid colors indicate a panel of diverse stimuli selected for the 10
reverse genetic screens. WT, wild type.
D Comparison of expression profiles of wild-type cells and HIF1A-KO cells in response to DFOM stimulation. Contours depict genes not differentially expressed; dots
indicate DFOM signature genes; gray dotted line is the diagonal of equal response; and red line is a linear fit using signature genes. FC, fold change; WT, wild type;
KO, knockout.
E Same as in (D), except for WNT3A stimulus in CTNNB1-KO cells.
2
Molecular Systems Biology 12: 879 | 2016
ª 2016 The Authors
Published online: August 1, 2016
Bianca V Gapp et al
linked with the tested stimuli (Table EV2). Signatures for related
stimuli clustered together (Figs 1C and EV1C). For example,
members of the TGF-beta superfamily (TGFb, ACTA, GDF11, ACTB,
BMP2, GDF7, BMP13) formed one large cluster. Interferon-beta
(IFNb), interferon-lambda (IFNL2), and interferon-gamma (IFNg)
formed a separate cluster. Importantly, although related signatures
(e.g., interferons) contained genes in common, they also contained
gene subsets known to be specific to the respective stimuli
(Fig EV1D). This indicates that the resolution of shallow RNA
sequencing can capture not only broad responses to perturbations,
but can reveal nuances of signaling cascades as well.
Satisfactory performance of shallow transcriptomic profiling
prompted us to carry out the first transcriptome-based reverse
genetic screen in human cells. As many signaling pathways are
inactive under standard culturing conditions, we reasoned that
phenotypes associated with gene knockouts would only become
apparent upon a secondary perturbation (Lamb et al, 2006;
Kemmeren et al, 2014). We thus selected 10 stimuli from the
benchmarking experiment based on signature size and diversity
for parallel screening. These were activin A (ACTA), bone morphogenic protein 2 (BMP2), fibroblast growth factor 1 (FGF1), IFNb,
IFNg, wingless-type family member 3A (WNT3A), deferoxamine
(DFOM, hypoxia mimicking agent), rotenone (ROTN, inducer of
reactive oxygen species), resveratrol (RESV, a natural product with
unclear mode of action), and ionomycin (IONM, calcium modulating agent). To strengthen confidence in these selected gene signatures, we collected additional replicates under the same
conditions, with the exception of ionomycin for which we lowered
dosage due to cytotoxicity. The final signatures were consistent
with our initial findings (Fig EV1E).
Next, we validated that the previously defined signatures can be
exploited to functionally annotate genes using mutant cell lines. We
selected a small (induced by DFOM) and a medium size signature
(induced by WNT3A) and tested whether specific knockouts would
affect these signatures. Using CRISPR/Cas9 genome editing, we
generated HAP1 cells deficient for HIF1A or CTNNB1 (beta-catenin),
critical and specific transcription factors in hypoxia and WNT
signaling. As expected, genes upregulated by DFOM and WNT3A
were strongly reduced in the HIF1A and CTNNB1 mutants, respectively (Fig 1D and E).
Finally, we tested whether we could also uncover genotype–
phenotype connections in a large unbiased setting. We chose to
focus on tyrosine kinases as these represent a recognized class of
drug targets, yet many of the 90 members encoded in the human
genome remain poorly annotated (Fedorov et al, 2010). Based on
essentiality in HAP1 cells (Blomen et al, 2015) and RNA expression, we selected 56 tyrosine kinases, and for each gene, we
attempted to generate isogenic knockout clones in HAP1 cells
using CRISPR/Cas9 (Fig 2A and Appendix Fig S1). Guide RNAs
were designed to target coding exons at least 100 bp downstream
of the start codon to avoid translational initiation from a downstream ATG. Mutant clones were expanded, and gene knockout
was confirmed by Sanger sequencing in more than 95% (55/56)
of the selected genes. The great majority of clones was morphologically indistinguishable from wild-type cells and proliferated at
similar speed.
We adopted a scalable and modular screen design, splitting
data acquisition into batches. Each batch consisted of four
ª 2016 The Authors
Molecular Systems Biology
Parallel reverse genetic screening in mutant human cells
A
CK1
STE
B
AGC
TKL
TK
CAMK
CMGC
CRISPR/Cas9
Kinase
KO
C
IONM
RESV
KO
WT
DFOM
None
IFNb
BMP2
ROTN
FGF1
IFNg
WNT3A
ACTA
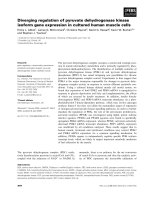
Figure 2. Parallel reverse genetic screening of kinase knockout cells.
A On top, cartoon illustrating the assembly of a collection of HAP1 knockouts
using CRISPR/Cas9 technology. Abbreviations indicate kinase subfamilies. At
bottom, scheme for screening design showing that individual kinase KO
cells are measured along all relevant controls. KO, knockout.
B Spearman correlations between replicates of stimulated and unstimulated
wild-type and knockout cells in the transcriptomic screen of 16 96-well
plates. Inset shows expression values in a representative set of replicates.
C Supervised Stochastic Neighbour Embedding (tSNE) clustering of all
stimulated and unstimulated HAP1 wild-type and knockout cell lines. Dots
represent averages of replicates. WT, wild type; KO, knockout.
knockout cell lines screened in parallel against the 10 selected
stimuli along with controls (Fig EV1F). This allowed us to maintain replicates and mutant-specific samples in one batch, reducing
the need for batch correction for some analyses (see Materials
and Methods). In this manner, we processed 64 HAP1 knockout
cell lines (55 tyrosine, 6 nontyrosine kinases, and 3 positive
controls) and again obtained high concordance in expression profiles between replicates (Fig 2B). Clustering based on the defined
signatures showed the expected groupings by stimulus (Fig 2C),
indicating that most mutant cell lines responded to the
Molecular Systems Biology 12: 879 | 2016
3
Published online: August 1, 2016
Molecular Systems Biology
Parallel reverse genetic screening in mutant human cells
perturbations similarly to wild-type cells. Interestingly, around
15% of the knockout cells showed signatures with substantial
overlap with the DFOM signature (Appendix Fig S2A), explaining
the imperfect clustering of DFOM samples and some unstimulated
controls. Although this effect was less strong than that induced
with DFOM, it suggests that some clones had an activated
hypoxia response under normoxic conditions. Indeed, Western
blot analysis showed that HIF1A protein levels were elevated
under normoxic conditions in clones displaying the hypoxia-like
signature (Appendix Fig S2B and C). The levels were comparable
to those observed in DFOM-treated cells. However, this increase
was not consistently observed in independently generated knockout clones, suggesting that the hypoxic state is a modestly
frequent (~15%) passenger effect.
Further analysis of the screening data indicated that responses of
mutant cells to the stimuli were weakly correlated with RNA
A
Bianca V Gapp et al
concentration and sequencing depth (Appendix Fig S3). This
suggested that cell growth, albeit largely managed experimentally,
had a measurable effect on the signatures, highlighting the potential
confounding effects of cell cycle and cell density on cellular
responses. We thus created linear models to correct for these effects
and used residuals to score individual cell lines’ responses to each
stimulus (Fig EV2). This revealed several knockout-specific signaling dependencies (Figs 3A–C and EV3). For example, JAK1 knockout cells were completely insensitive to IFNg and IFNb while
responding similarly as wild-type cells to the other eight stimuli. In
contrast, JAK2 or TYK2 ablation did not affect the response to interferon under these conditions (Figs 3B and EV4). This finding is
surprising as these three JAK family members have been reported to
contribute to a transcriptional response upon stimulation with type I
or type II interferons (Rane & Reddy, 2000). Our results confirm a
critical role for JAK1 in interferon signaling and suggest a distinct
B
C
FGFR1
FGFR3
FGFR4
JAK1
TYK2
FGFR2
JAK2
E
D
FGFR1-KO
FGFR2-KO
FGFR3-KO
FGFR4-KO
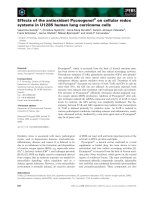
Figure 3. Transcriptional profiling of kinase knockouts links genotypes to pathways.
A Responses of JAK1-KO cells to the ten selected stimuli. Violins indicate score distributions of all knockout cell lines. Scores are overlaps of signature gene sets with
expected signature sets, corrected for technical variables using general linear models. Bars represent scores for JAK1-KO mutants. KO, knockout.
B Similar as in Fig 3A, except showing detailed view of responses to FGF1 and IFNb/IFNg stimulation of selected knockout cells. Bars indicate labeled mutants of FGFR
and JAK family members.
C Same as in Fig 3A, except showing FGFR1-KO cell line.
D Comparison of response signatures in wild-type and FGFR-KO mutant cells. Contours summarize genes that are not differentially expressed; dots indicate FGF1
signature genes; gray dotted line is the diagonal of equal response; and red line is a linear fit using signature genes. FC, fold change; WT, wild type; KO, knockout.
E Comparison of stimulus response as measured by RNA-seq and qRT–PCR. Each axis shows the slope of a best-fit line through KO and WT stimulus responses (lines for
RNA-seq are as in Fig 3D, and lines for qRT–PCR data are computed similarly from independent stimulation and qRT measurements). Dotted lines are guides
representing unit slope (equal response in KO and WT cells to stimulus) and zero slope (KO cells fully unresponsive to stimulus). Shaded area represents the space
where both assays indicate that KO cells are less responsive than WT cells. WT, wild type; KO, knockout.
4
Molecular Systems Biology 12: 879 | 2016
ª 2016 The Authors
Published online: August 1, 2016
Bianca V Gapp et al
function of this kinase compared to the other two family members,
at least in HAP1 cells.
As another example, we noted differential responsiveness of
mutants in the FGF receptor (FGFR) family, which bind FGF1.
Signaling through these receptors occurs through overlapping downstream cascades (Raju et al, 2014), but is also context dependent.
Accordingly, mutations in distinct FGFR family members are associated with specific cancers (Touat et al, 2015). In HAP1 cells, the
response to FGF1 was diminished through knockout of FGFR1 and
FGFR3, but not FGFR2 or FGFR4 (Fig 3B and C). Studying the signature genes in more detail, we further noted that loss of FGFR1 had a
uniform effect on FGF1 signaling, as marked by an overall reduction
in the strength of the response (Figs 3D and EV4). In contrast, in
FGFR3 knockout cells, the attenuation was less uniform. These
observations highlight the complexity of FGF1 signaling and illustrate how the profiling platform can spark new hypotheses even for
well-studied pathways.
Many other gene–stimulus combinations also resulted in subtle
reductions in signaling strength. To assess whether these small
effects were reproducible, we selected gene–stimulus combinations across all the stimuli and validated them using qRT–PCR
(Fig 3E). Remarkably, changes in stimulus response were quantitatively consistent with the results seen in the screens. These
experiments also confirmed another observation that some mutant
clones show aberrations in more than one signaling pathway
(Fig EV5).
Discussion
In summary, we present an approach for parallel reverse genetics of
mutant human cells based on shallow RNA sequencing. Besides
demonstrating its suitability for studying cellular perturbations, we
generated a proof-of-concept dataset comprising 11 conditions in a
collection of 64 isogenic haploid mutant cell lines. This represents
one of the largest transcriptomic experiments performed in a single
cell line and demonstrates the scalability and suitability of the
approach for exploring signaling mechanisms in human cells in a
systematic manner.
There are some potential limitations of the genetic screening
strategy. The resolution of shallow RNA-seq is not as high as
obtained from deeper sequencing protocols. Changes in lowly
expressed genes may thus be missed, but this loss is offset by the
reduced cost of the assay that allows analysis of a higher number of
samples. Furthermore, cellular changes that do not affect gene transcription, or only very transiently, cannot be quantified using this
method. The generation of full knockout mutants in diploid cells
may be less efficient than reported here, and we do not formally
demonstrate that the shallow RNA-seq performs equally well on
other (diploid) mammalian cell systems. Nonetheless, we anticipate
that the strategy of transcriptional screening of mutant cells is
generic and can be applied to study many other cellular systems
provided relevant reference/control signatures are measured.
Furthermore, the presented strategy can be deployed to address a
multitude of biological questions beyond the study of full knockout
mutants. Envisioned applications include hit validation and targeted
hypothesis testing that are difficult to tackle through forward
genetics.
ª 2016 The Authors
Molecular Systems Biology
Parallel reverse genetic screening in mutant human cells
Materials and Methods
Cell lines
Cells were propagated in Iscove’s modified Dulbecco’s medium
(IMDM+GlutaMAX, Invitrogen GIBCO) supplemented with 10%
heat-inactivated bovine serum (FBS, Invitrogen GIBCO), 100 lg/ml
penicillin, and 100 lg/ml streptomycin (Sigma-Aldrich). All cell
lines were grown at 37°C in a 5% CO2-humidified incubator. HAP1
knockout cell lines were generated at Horizon Genomics
(Table EV3).
A set of nonessential and expressed kinases was obtained by
intersecting published datasets of human kinases (Manning et al,
2002), expressed genes in HAP1 cells (Essletzbichler et al, 2014),
and nonessential genes in HAP1 cells (Blomen et al, 2015). Guide
RNAs (gRNA) were designed to target coding exons of the genes of
interest, preferentially targeting within the first 25% of the coding
sequence and at least 100 bp downstream of the start codon to avoid
translational initiation from a downstream ATG. Specificity of each
gRNA was assessed using the Broad algorithm (http://crispr.
mit.edu/). Cloning was performed by ligating oligonucleotides
containing the gRNA sequence and the chimeric gRNA backbone
into a plasmid harboring the U6 promoter.
To generate HAP1 mutants for screening, cells were transfected
with expression plasmids encoding Streptococcus pyogenes Cas9
(pX165 from the Zhang lab), a gRNA, and a blasticidin resistance
gene using TurboFectin (Origene). Untransfected cells were eliminated by treating HAP1 cells with 20 lg/ml blasticidin for 24 h.
Cells were allowed to recover from antibiotic selection for 5–7 days,
and clonal cell lines were isolated by limiting dilution. DNA was
isolated from cells using the Direct PCR-Cell Kit (PeqLab). The
region around the gRNA target site was amplified by PCR, and PCR
products were analyzed by Sanger sequencing. Clones bearing
frameshift mutations were selected and stored for use. Cells lines
are available through Horizon Genomics.
Independently generated FGFR3 and PDGFRA knockout cell lines
were obtained by ligating oligonucleotides encoding for the gRNA
sequence (FGFR3: CAGCAGGAGCAGTTGGTCTT; PDGFRA: GCG
TTCCTGGTCTTAGGCTG) with a lentiCRISPR v2 vector (Addgene
#52961). Following lentiviral transduction, infected cells were
selected with 0.5 lg/ml puromycin for 3 days. Clonal cell lines were
isolated by limiting dilution and gDNA isolated using DNeasy Blood
& Tissue kit (Qiagen) according to the manufacturer’s instructions.
Regions flanking the gRNA target site were amplified by PCR and
analyzed by Sanger sequencing. Clones harboring frameshift mutations were expanded for follow-up experiments.
Reagents and stimulation of cells
Recombinant polypeptides and small molecules were purchased
from different vendors (Table EV1). Polypeptides were diluted in
water, 0.1% BSA, 0.1% acetic acid, 10 mM sodium citrate (pH 3),
5 mM sodium phosphate (pH 8 or 7.2), or 10 mM acetic acid. Stocks
were prepared in PBS containing 0.1% BSA. Small molecules were
diluted in water, DMSO, or 20 mM MES buffer (pH 5.5).
Stimulation experiments were carried out in a 12-well format
using 2 × 10⁵ cells per well. Thirty-six hours after seeding, cells
were washed twice with PBS, and IMDM supplemented with 0.5%
Molecular Systems Biology 12: 879 | 2016
5
Published online: August 1, 2016
Molecular Systems Biology
Parallel reverse genetic screening in mutant human cells
FBS, 100 lg/ml penicillin and 100 lg/ml streptomycin was added.
After 16 h reduced serum conditions, cells were stimulated with
polypeptides or small molecules for 6 h. Samples were washed
twice with 1 ml PBS (pre-chilled to 4°C) and immediately stored at
À80°C.
Bianca V Gapp et al
HRP-conjugated secondary antibodies (anti-mouse or anti-rabbit
IgG from Bio-Rad diluted 1:10,000 in 0.2% Tropix I-Block) for 1 h
at room temperature. HRP was detected using Western Lightning
Plus-ECL (PerkinElmer).
RNA-seq data processing and alignment
RNA sequencing
Total RNA was isolated using RNeasy Mini kit (Qiagen) according to the manufacturer’s instructions. 500 ng total RNA was
used for library preparation using the QuantSeq 30 mRNA-Seq
Library Prep Kit (Lexogen) according to the manufacturer’s protocol with the exception of using 13 instead of 12 PCR cycles for
library amplification. Library concentrations were measured using
Qubit dsDNA HS assay on a Qubit 2.0 Fluorometric Quantitation
System (Life Technologies). Size distribution of pooled final
libraries (48 samples) was assessed using Experion DNA 1K analysis kit on an Experion automated electrophoresis system (BioRad). Libraries were diluted, and the T-fill reaction was
performed on a cBot as described previously (Wilkening et al,
2013) with the exception that the T-fill solution was provided in
a primer tube strip. For cluster generation, the cBot protocol SR
Amp Lin Block TubeStripHyp v8.0.xml was used. Sequencing
was performed on an Illumina HiSeq 2000 machine using 50-bp
single-read v3 chemistry.
Quantitative real-time PCR
Total RNA was isolated using RNeasy Mini kit (Qiagen), and
DNase digest was performed using a TURBO DNase kit (Ambion)
according to the manufacturer’s protocols. About 500 ng to 1 lg
total RNA was reverse-transcribed using random hexamer primers
and RevertAid Reverse Transcriptase kit (Fermentas). cDNA
synthesis was carried out according to the manufacturer’s instructions (synthesis cycle: 10 min at 25°C, 60 min at 42°C, and 10 min
at 70°C). About 25–50 ng of cDNA and 500 nM forward and
reverse primer were used for PCR amplification with KAPA ABI
Prism SYBR Fast (Kapa Biosystems) according to the manufacturer’s instructions (synthesis cycle: 3 min at 95°C and (3 s at
95°C, 30 s at 60°C) × 40). Primers used for qRT–PCR are listed in
Table EV4.
Western blotting
Whole-cell lysates were prepared using 4× sample buffer (320 mM
Tris–HCl pH 6.8, 40% glycerol, 16 lg/ml bromophenol blue, 8%
SDS) containing 10% 2-mercaptoethanol (Fisher Scientific), incubated for 10 min at 95°C and subjected to SDS–PAGE (NuPAGE
4–12% Bis-Tris Gel, Invitrogen). Proteins were separated for 1.5 h
at 130 V and transferred to a polyvinylidene difluoride (PVDF,
Amersham Hybond-P, GE Healthcare) membrane for 2 h at
400 mA. Membranes were blocked with 0.2% Tropix I-Block
(Applied Biosystems) for 1 h and incubated with primary antibody
diluted in 0.2% Tropix I-Block overnight at 4°C. Primary antibodies and dilutions used were as follows: mouse anti-HIF1A
(1:2,000) from BD Biosciences (610959) and rabbit anti-actin
(1:1,000) from Sigma-Aldrich (A2066). Blots were washed
with PBS containing 0.1% Tween-20 and incubated with
6
Molecular Systems Biology 12: 879 | 2016
Unaligned reads in fastq format were trimmed of adapter sequence
AGATCGGAAGAGCACACGTCTGAACTCCAGTCAC using Cutadapt
(v.1.2.1) and then partitioned using TriageTools (Fimereli et al,
2013) (v0.2.2) to select long (–length 35), high-quality (–quality 9),
and sequence-complex (–lzw 0.33) reads. Selected reads were
aligned using GSNAP (Wu & Nacu, 2010; v2014-02-28) onto a
custom genome index (gmap_build -k 14 -q 2) based on hg19
supplemented with ERCC92 transcript sequences. Expression estimates on Gencode V19 genes were collected from the alignments
using Exp3p. This procedure implements read counting on gene
bodies and normalizes by total sequencing depth; because the RNA
sequencing protocol is designed to capture one read per transcript
through the polyadenylated tail, expression normalization does not
include the length of the gene body.
Expression analysis
Analysis was performed in a series of modules built around a
custom toolkit, ExpCube. The analysis was split into two parts.
The first part consisted of analysis of four 96-well plates representing the stimulus discovery phase of the project. The second
part was an extension to the entire dataset (twenty 96-well
plates). Analysis modules and their dependencies are illustrated
in Appendix Fig S4.
We began by gathering expression data from all samples into one
object. This object included central estimates as well as intervals for
each gene in each sample. Common steps in expression analysis are
normalization and batch correction. However, by examining profiles
of unstimulated wild-type HAP1 cells and controls, we observed that
various implementations of these steps highlighted parts of the
signal and hid others, making it difficult to select a unified scheme
for the entire screen. Furthermore, the experimental design was
such that most intended comparisons were between samples within
a single batch, mitigating the need for explicit batch correction. For
these reasons, we chose not to adjust the central expression values.
Instead, we used within-plate and across-plate variation for unstimulated wild-type samples (of which there are four or more replicates
per plate) to adjust uncertainty intervals. For each gene, we
computed quantiles among replicates in each plate and quantiles
among group averages across plates. We then compared this empirical variability to the base Poisson intervals and obtained a rescaling
factor for each gene’s Poisson interval. For 98% of genes, the
across-plate variability was larger than the within-plate variability
(median ratio equal to 1.8), indicating the importance of replicates
of wild-type controls in each of the library preparation plates. We
applied this interval rescaling operation to all samples in the screen.
Thus, we incorporated empirical data on reproducibility of comparable samples from across the screen into the expression profiles of all
other samples.
We scored differential expression (DE) based on effect sizes (fold
changes) and uncertainty levels (z-scores, defined as differences in
ª 2016 The Authors
Published online: August 1, 2016
Bianca V Gapp et al
central expression values divided by a joint estimate of interval
size). Outlier samples due to failed sequencing were excluded from
the analysis. Considering groups A and B, we scored each sample in
group A against each sample in group B, one gene at a time. We set
a score of + 1 for a z-score > 1.75 and a fold change > 1.75, a score
of 0 for a z-score < 1.25 and a fold change < 1.25, and a linear gradient of scores for intermediate cases (negative values for downregulation). Through the z-score component, this approach penalized
inconsistent/unreliable genes whose intervals were substantially
modified in the previous step. We then obtained a group-level DE
score using the mean of the sample-level scores. By construction,
these scores lie in [À1, 1] and carry the same interpretation independently of the number of samples per group, albeit with some
variability with very few replicates (Fig EV1B). We declared a gene
to be in a signature if the score was > 0.7.
For the power analysis, we began by pooling raw data from 24
replicates of unstimulated wild-type cells from the stimulus
discovery phase. We then subset the pool into bins of varying
size and applied our alignment and expression-calling pipeline on
each bin. From these expression profiles, we computed the
number of genes with expression above 1 transcript per million
reads. We also created hypothetical profiles with genes over- or
under-expressed by various fold changes and applied our criteria
to call differential expression. The number of genes called in this
analysis reflects the sensitivity of the method to identify expression changes under uncertainty due to low-coverage and biological variability. This calculation is presented in the ExpCube
package vignette.
For stimulus selection in the discovery phase, we worked with
stimuli whose group signature contained at least two replicates and
at least two signature genes. Clustering of stimuli was performed
using a Jaccard index distance between signature gene sets. Gene
set enrichment analysis was performed by comparing signature
genes with a background set of expressed genes in HAP1 cells using
the topGO package (Alexa et al, 2006).
In the screening phase, we compared overlaps for each stimulus and each mutant cell line with the expected responses in
wild-type cells. We collapsed expression profiles onto the ten
selected signatures and then performed tSNE (van der Maaten &
Hinton, 2008) clustering based on Euclidean distances
between groups using the dimensionally reduced data. For more
detailed analysis, we correlated overlaps with technical features
and noted unintentional relations with RNA concentration
and depth (Appendix Fig S3). To correct for these effects, we set
up general linear models (GLM) of the form O = aR + bD, where
O denotes overlap, R is average RNA concentration (ng per ul),
D is average sequencing depth (millions of reads), and a and b
are coefficients. We then defined a stimulus response score as
the residuals between observed and modeled overlap. Extreme
values of this score identify outlying cell lines, that is, mutants
showing abnormal response given cell density and sequencing
performance.
For comparison between RNA-seq and qRT–PCR data, we
computed slopes of best-fit lines between KO and WT responses
plotted on logarithmic scales. Linear fits on log axes suggest a model
where KO response is a power of the WT response, but we do not
mean to emphasize this interpretation. Rather, we regard the linear
fit as a convenient summary of the overall patterns with few fitted
ª 2016 The Authors
Molecular Systems Biology
Parallel reverse genetic screening in mutant human cells
parameters. In the case of RNA-seq data, the best-fit line was
computed using signature genes with one outlier removed. In the
case of qRT–PCR, the line was fit using four signature genes and
GAPDH.
Data availability
All raw sequencing data have been deposited in the European
Nucleotide Archive under accession ERP012914. Exp3p software is
available at (v0.1). ExpCube
software is available at />Additional code, data files, and processed expression values are
available at />Expanded View for this article is available online.
Acknowledgements
We would like to thank the Biomedical Sequencing Facility at CeMM for
carrying out RNA sequencing using a custom T-fill protocol and Michael
Schuster for quality control and initial processing of the sequencing data. We
thank Michel Owusu for technical assistance. We also wish to acknowledge
the Computational Biology Research Group Oxford for use of their services in
this project. We thank Toolgen for their contribution to the kinase knockout
collection and Lexogen GmbH for RNA sequencing protocol development. We
thank Helen Pickersgill of Life Science Editors and Mary Muers for critical reading and editing of the manuscript. The research leading to these results has
received funding from the European Research Council under the European
Union’s Seventh Framework Programme (FP7/2007-2013)/ERC grant
agreement no. [311166]. B. V. G. is supported by a Boehringer Ingelheim Fonds
PhD fellowship.
Author contributions
BVG designed, executed, and interpreted benchmarking experiments, reverse
genetic screening, and validation experiments. TK designed, analyzed, and
interpreted benchmarking experiments, screening data, and validation
experiments. TP performed T-fill reactions and RNA-seq. VD performed
qRT–PCR and Western blot validation experiments. TB generated kinase
knockout cell lines. CB supervised RNA-seq experiments and provided overall
guidance. SMBN designed and interpreted experiments, directed the study,
and provided overall guidance. BVG, TK, and SMBN assembled figures and
wrote the manuscript.
Conflict of interest
SMBN is a co-founder and shareholder of Haplogen GmbH. The company
employs haploid genetics in the area of infectious disease. TB is an employee
of Horizon Genomics GmbH. The company generated the human tyrosine
kinase knockout collection based on HAP1 cells.
References
Alexa A, Rahnenfuhrer J, Lengauer T (2006). Improved scoring of functional
groups from gene expression data by decorrelating GO graph structure.
Bioinformatics 22: 1600 – 1607
Barrangou R, Birmingham A, Wiemann S, Beijersbergen RL, Hornung V,
Av Smith (2015) Advances in CRISPR-Cas9 genome engineering:
lessons learned from RNA interference. Nucleic Acids Res 43:
3407 – 3419
Molecular Systems Biology 12: 879 | 2016
7
Published online: August 1, 2016
Molecular Systems Biology
Parallel reverse genetic screening in mutant human cells
Blomen VA, Majek P, Jae LT, Bigenzahn JW, Nieuwenhuis J, Staring J, Sacco R,
van Diemen FR, Olk N, Stukalov A, Marceau C, Janssen H, Carette JE,
Bennett KL, Colinge J, Superti-Furga G, Brummelkamp TR (2015) Gene
essentiality and synthetic lethality in haploid human cells. Science 350:
1092 – 1096
Brummelkamp TR, Nijman SM, Dirac AM, Bernards R (2003) Loss of the
cylindromatosis tumour suppressor inhibits apoptosis by activating
NF-kappaB. Nature 424: 797 – 801
Carette JE, Pruszak J, Varadarajan M, Blomen VA, Gokhale S, Camargo FD,
Wernig M, Jaenisch R, Brummelkamp TR (2010) Generation of iPSCs from
cultured human malignant cells. Blood 115: 4039 – 4042
Chua G, Morris QD, Sopko R, Robinson MD, Ryan O, Chan ET, Frey BJ,
Andrews BJ, Boone C, Hughes TR (2006) Identifying transcription factor
functions and targets by phenotypic activation. Proc Natl Acad Sci USA
103: 12045 – 12050
DeRisi JL, Iyer VR, Brown PO (1997) Exploring the metabolic and
genetic control of gene expression on a genomic scale. Science 278:
680 – 686
van Dijk EL, Auger H, Jaszczyszyn Y, Thermes C (2014) Ten years of nextgeneration sequencing technology. Trends Genet 30: 418 – 426
Essletzbichler P, Konopka T, Santoro F, Chen D, Gapp BV, Kralovics R,
Brummelkamp TR, Nijman SM, Burckstummer T (2014) Megabase-scale
deletion using CRISPR/Cas9 to generate a fully haploid human cell line.
Genome Res 24: 2059 – 2065
Fedorov O, Muller S, Knapp S (2010) The (un)targeted cancer kinome. Nat
Chem Biol 6: 166 – 169
Fimereli D, Detours V, Konopka T (2013) TriageTools: tools for partitioning
and prioritizing analysis of high-throughput sequencing data. Nucleic
Acids Res 41: e86
Giaever G, Chu AM, Ni L, Connelly C, Riles L, Veronneau S, Dow S, LucauDanila A, Anderson K, Andre B, Arkin AP, Astromoff A, El-Bakkoury M,
Bangham R, Benito R, Brachat S, Campanaro S, Curtiss M, Davis K,
Deutschbauer A et al (2002) Functional profiling of the Saccharomyces
cerevisiae genome. Nature 418: 387 – 391
Holstege FC, Jennings EG, Wyrick JJ, Lee TI, Hengartner CJ, Green MR, Golub
signatures to connect small molecules, genes, and disease. Science 313:
1929 – 1935
Lehner B (2013) Genotype to phenotype: lessons from model organisms for
human genetics. Nat Rev Genet 14: 168 – 178
Lenstra TL, Benschop JJ, Kim T, Schulze JM, Brabers NA, Margaritis T, van de
Pasch LA, van Heesch SA, Brok MO, Groot Koerkamp MJ, Ko CW, van
Leenen D, Sameith K, van Hooff SR, Lijnzaad P, Kemmeren P, Hentrich
T, Kobor MS, Buratowski S, Holstege FC (2011) The specificity and
topology of chromatin interaction pathways in yeast. Mol Cell 42:
536 – 549
van der Maaten LJP, Hinton GE (2008) Visualizing high-dimensional data
using t-SNE. JMLR 9: 2579 – 2605
Manning G, Whyte DB, Martinez R, Hunter T, Sudarsanam S (2002) The
protein kinase complement of the human genome. Science 298:
1912 – 1934
Mohr SE, Smith JA, Shamu CE, Neumuller RA, Perrimon N (2014) RNAi
screening comes of age: improved techniques and complementary
approaches. Nat Rev Mol Cell Biol 15: 591 – 600
Paulsen RD, Soni DV, Wollman R, Hahn AT, Yee MC, Guan A, Hesley JA,
Miller SC, Cromwell EF, Solow-Cordero DE, Meyer T, Cimprich KA
(2009) A genome-wide siRNA screen reveals diverse cellular
processes and pathways that mediate genome stability. Mol Cell 35:
228 – 239
Raju R, Palapetta SM, Sandhya VK, Sahu A, Alipoor A, Balakrishnan L, Advani J,
George B, Kini KR, Geetha NP, Prakash HS, Prasad TS, Chang YJ, Chen L,
Pandey A, Gowda H (2014) A Network map of FGF-1/FGFR signaling
system. J Signal Transduct 2014: 962962
Rane SG, Reddy EP (2000) Janus kinases: components of multiple signaling
pathways. Oncogene 19: 5662 – 5679
Shah AN, Davey CF, Whitebirch AC, Miller AC, Moens CB (2015) Rapid
reverse genetic screening using CRISPR in zebrafish. Nat Methods 12:
535 – 540
Shalem O, Sanjana NE, Zhang F (2015) High-throughput functional genomics
using CRISPR-Cas9. Nat Rev Genet 16: 299 – 311
Tiwana GS, Prevo R, Buffa FM, Yu S, Ebner DV, Howarth A, Folkes LK, Budwal
TR, Lander ES, Young RA (1998) Dissecting the regulatory circuitry of a
B, Chu KY, Durrant L, Muschel RJ, McKenna WG, Higgins GS (2015)
eukaryotic genome. Cell 95: 717 – 728
Identification of vitamin B1 metabolism as a tumor-specific
Hu Z, Killion PJ, Iyer VR (2007) Genetic reconstruction of a functional
transcriptional regulatory network. Nat Genet 39: 683 – 687
Hughes TR, Marton MJ, Jones AR, Roberts CJ, Stoughton R, Armour CD,
Bennett HA, Coffey E, Dai H, He YD, Kidd MJ, King AM, Meyer MR, Slade D,
Lum PY, Stepaniants SB, Shoemaker DD, Gachotte D, Chakraburtty K,
radiosensitizing pathway using a high-throughput colony formation
screen. Oncotarget 6: 5978 – 5989
Touat M, Ileana E, Postel-Vinay S, Andre F, Soria JC (2015) Targeting FGFR
signaling in cancer. Clin Cancer Res 21: 2684 – 2694
van Wageningen S, Kemmeren P, Lijnzaad P, Margaritis T, Benschop JJ, de
Simon J et al (2000) Functional discovery via a compendium of expression
Castro IJ, van Leenen D, Groot Koerkamp MJ, Ko CW, Miles AJ, Brabers N,
profiles. Cell 102: 109 – 126
Brok MO, Lenstra TL, Fiedler D, Fokkens L, Aldecoa R, Apweiler E,
Kaelin WG Jr (2012) Molecular biology. Use and abuse of RNAi to study
mammalian gene function. Science 337: 421 – 422
Kemmeren P, Sameith K, van de Pasch LA, Benschop JJ, Lenstra TL, Margaritis
T, O’Duibhir E, Apweiler E, van Wageningen S, Ko CW, van Heesch S,
Taliadouros V, Sameith K, van de Pasch LA et al (2010) Functional overlap
and regulatory links shape genetic interactions between signaling
pathways. Cell 143: 991 – 1004
White JK, Gerdin AK, Karp NA, Ryder E, Buljan M, Bussell JN, Salisbury J,
Kashani MM, Ampatziadis-Michailidis G, Brok MO, Brabers NA, Miles AJ,
Clare S, Ingham NJ, Podrini C, Houghton R, Estabel J, Bottomley JR,
Bouwmeester D, van Hooff SR, van Bakel H, Sluiters E (2014) Large-scale
Melvin DG, Sunter D, Adams NC, Sanger Institute Mouse Genetics
genetic perturbations reveal regulatory networks and an abundance of
Project, Tannahill D, Logan DW, Macarthur DG et al (2013)
gene-specific repressors. Cell 157: 740 – 752
Genome-wide generation and systematic phenotyping of
Kranz D, Boutros M (2014) A synthetic lethal screen identifies FAT1 as
an antagonist of caspase-8 in extrinsic apoptosis. EMBO J 33: 181 – 197
Lamb J, Crawford ED, Peck D, Modell JW, Blat IC, Wrobel MJ, Lerner J,
8
Bianca V Gapp et al
knockout mice reveals new roles for many genes. Cell 154:
452 – 464
Wilkening S, Pelechano V, Jarvelin AI, Tekkedil MM, Anders S, Benes V,
Brunet JP, Subramanian A, Ross KN, Reich M, Hieronymus H, Wei G,
Steinmetz LM (2013) An efficient method for genome-wide
Armstrong SA, Haggarty SJ, Clemons PA, Wei R, Carr SA, Lander ES,
polyadenylation site mapping and RNA quantification. Nucleic Acids Res
Golub TR (2006) The Connectivity Map: using gene-expression
41: e65
Molecular Systems Biology 12: 879 | 2016
ª 2016 The Authors
Published online: August 1, 2016
Bianca V Gapp et al
Molecular Systems Biology
Parallel reverse genetic screening in mutant human cells
Wu TD, Nacu S (2010) Fast and SNP-tolerant detection of complex variants
and splicing in short reads. Bioinformatics 26: 873 – 881
genome-wide RNAi screen for modifiers of the circadian clock in human
cells. Cell 139: 199 – 210
Wu AR, Neff NF, Kalisky T, Dalerba P, Treutlein B, Rothenberg ME, Mburu
FM, Mantalas GL, Sim S, Clarke MF, Quake SR (2014) Quantitative
License: This is an open access article under the
assessment of single-cell RNA sequencing methods. Nat Methods 11:
terms of the Creative Commons Attribution 4.0
41 – 46
License, which permits use, distribution and reproduc-
Zhang EE, Liu AC, Hirota T, Miraglia LJ, Welch G, Pongsawakul PY, Liu X,
Atwood A, Huss JW 3rd, Janes J, Su AI, Hogenesch JB, Kay SA (2009) A
ª 2016 The Authors
tion in any medium, provided the original work is
properly cited.
Molecular Systems Biology 12: 879 | 2016
9