Báo cáo khoa học: Diverging regulation of pyruvate dehydrogenase kinase isoform gene expression in cultured human muscle cells pot
Bạn đang xem bản rút gọn của tài liệu. Xem và tải ngay bản đầy đủ của tài liệu tại đây (234.86 KB, 11 trang )
Diverging regulation of pyruvate dehydrogenase kinase
isoform gene expression in cultured human muscle cells
Emily L. Abbot
1
, James G. McCormack
2
, Christine Reynet
2
, David G. Hassall
3
, Kevin W. Buchan
3,
*
and Stephen J. Yeaman
1
1 Institute for Cell and Molecular Biosciences, University of Newcastle upon Tyne, UK
2 Prosidion Ltd, Oxford, UK
3 GlaxoSmithKline, Stevenage, UK
The pyruvate dehydrogenase complex (PDC) oxida-
tively decarboxylates pyruvate to acetyl-CoA and CO
2
,
coupled with the reduction of NAD
+
to NADH. In
mammals, there is no pathway for the net conversion
of acetyl-CoA to pyruvate and thus the catalytic activ-
ity of PDC represents the irreversible utilization of
Keywords
gene regulation; mitochondria; peroxisome
proliferator-activated receptor; pyruvate
dehydrogenase kinase; skeletal muscle
Correspondence
S.J. Yeaman, The Institute for Cell and
Molecular Biosciences, Faculty of Medical
Sciences, University of Newcastle upon
Tyne, Newcastle upon Tyne NE2 4HH, UK
Fax: +44 191 222 7424
Tel: +44 191 222 7433
E-mail:
*Present address
GE Healthcare, Amersham, UK
(Received 7 January 2005, revised 21 March
2005, accepted 8 April 2005)
doi:10.1111/j.1742-4658.2005.04713.x
The pyruvate dehydrogenase complex occupies a central and strategic posi-
tion in muscle intermediary metabolism and is primarily regulated by phos-
phorylation ⁄ dephosphorylation. The identification of multiple isoforms of
pyruvate dehydrogenase kinase (PDK1–4) and pyruvate dehydrogenase
phosphatase (PDP1–2) has raised intriguing new possibilities for chronic
pyruvate dehydrogenase complex control. Experiments to date suggest that
PDK4 is the major isoenzyme responsible for changes in pyruvate dehy-
drogenase complex activity in response to various different metabolic con-
ditions. Using a cultured human skeletal muscle cell model system, we
found that expression of both PDK2 and PDK4 mRNA is upregulated in
response to glucose deprivation and fatty acid supplementation, the effects
of which are reversed by insulin treatment. In addition, insulin directly
downregulates PDK2 and PDK4 mRNA transcript abundance via a phos-
phatidylinositol 3-kinase-dependent pathway, which may involve glycogen
synthase kinase-3 but does not utilize the mammalian target of rapamycin
or mitogen-activated protein kinase signalling pathways. In order to further
elucidate the regulation of PDK, the role of the peroxisome proliferators-
activated receptors (PPAR) was investigated using highly potent subtype
selective agonists. PPARa and PPARd agonists were found to specifically
upregulate PDK4 mRNA expression, whereas PPARc activation selectively
decreased PDK2 mRNA transcript abundance. PDP1 mRNA expression
was unaffected by all conditions analysed. These results suggest that in
human muscle, hormonal and nutritional conditions may control PDK2
and PDK4 mRNA expression via a common signalling mechanism. In
addition, PPARs appear to independently regulate specific PDK isoform
transcipt levels, which are likely to impart important metabolic mediation
of fuel utilization by the muscle.
Abbreviations
BSA, bovine serum albumin; DMEM, Dulbecco’s modified Eagle’s medium; FBS, fetal bovine serum; GSK3, glycogen synthase kinase-3;
LY294002, 2-(4-morpholinyl)-8-phenyl-4H-1-benzopyan-4-one; MAPK, mitogen-activated protein kinase; MEK, mitogen-activated protein kinase
kinase; MEM, minimal essential medium; mTOR, mammalian target of rapamycin; PDC, pyruvate dehydrogenase complex; PDK, pyruvate
dehydrogenase kinase; PDP, pyruvate dehydrogenase phosphatase; PtdIns3K, phosphatidylinositol 3-kinase; PKB, protein kinase B; PPAR,
peroxisome proliferator-activated receptor; ZDF, Zucker diabetic fatty rat.
3004 FEBS Journal 272 (2005) 3004–3014 ª 2005 FEBS
carbohydrate fuels. The predominant chronic control
mechanism used to regulate PDC activity is a reversi-
ble phosphorylation ⁄ dephosphorylation cycle [1]. Phos-
phorylation of three serine residues on the E1a
subunit, by pyruvate dehydrogenase kinase (PDK),
causes inactivation of the complex [2]. Such inhibition
can be reversed only by dephosphorylation catalysed
by pyruvate dehydrogenase phosphatase (PDP).
To date, four isoforms of PDK (PDK1–4) and two
isoforms of PDP (PDP1–2) have been identified in
humans [3–5]. These isoforms display unique tissue dis-
tribution [3–5] and varied kinetic and regulatory prop-
erties [3,5,6] suggesting that the activity of PDC in any
given tissue reflects the relative abundance of each
PDK ⁄ PDP isoform, their specific activities and their
sensitivity to allosteric regulators.
Skeletal muscle, by virtue of its relative mass, is the
major site of insulin-stimulated glucose disposal in
mammals, a process impaired in type 2 diabetes melli-
tus and obesity, and has thus been the focus of several
investigations into PDC regulation. The Pima Indians
have one of the highest known prevalences of type 2
diabetes mellitus in the world [7]. In this group, levels
of PDK2 and PDK4 skeletal muscle mRNA tran-
scripts were found to be positively correlated with fast-
ing plasma insulin concentrations as well as percentage
body fat, and negatively correlated with insulin-medi-
ated glucose uptake rates [8]. During a hyperinsulinae-
mic–euglycaemic clamp, levels of both transcripts
decreased in response to insulin, suggesting that the
transcription of both PDK2 and PDK4 are regulated
by a common mechanism in humans [8]. In addition,
skeletal muscle from obese patients with raised fatty
acids has a reduced oxidative capacity, with reduction
in type 1 fibres, similar to that seen in rodents fed a
high fat diet [9,10]. Under these conditions of modified
tissue delivery, changes in PDK4 have been observed
[11].
In rat gastrocnemius muscle, starvation has been
reported to specifically upregulate PDK4 expression
[12–14]. In contrast, the administration of a high-fat
diet for 28 days was associated with significant increa-
ses in PDK2 and PDK4 protein expression in rat
muscle [15].
Elevated plasma free fatty acids are a common char-
acteristic of high-fat feeding, starvation and diabetes.
Numerous fatty acids and their derivatives serve as lig-
ands for the peroxisome proliferator-activated recep-
tors (PPARs), thus these receptors are thought to play
a key role in sensing nutrient levels and modulating
metabolism accordingly [16] and could be linked to
changes in expression of metabolic genes, by their
influence as transcriptional activators.
Investigations into the role of PPARa and PPARd
in regulating PDK expression have been performed in
human skeletal muscle cells [17,18]. In human myo-
tubes, activation of either PPARa or PPARd receptors
(by the agonists GW7647 and GW0742, respectively)
resulted in a significant increase in the rate of fatty
acid oxidation. In addition, both agonists caused a
marked increase in the levels of PDK4 transcript abun-
dance without any effect on PDK2 mRNA expression
[17,18]. Treatment of Zucker diabetic fatty (ZDF) rats
with the PPARc agonist GW1929 for 7 days resulted
in a 7.5-fold decrease in PDK4 mRNA expression in
muscle [19]. This decrease in PDK4 mRNA expression
associated with GW1929 treatment suggests that
PDK4 repression may be an important mechanism by
which PPARc agonists enhance glucose utilization in
muscle [19]. However, such effects in muscle may be
via additional regulatory pathways, which along with
the major alterations in adipoctye gene expression,
lead to changes in plasma lipid levels.
Collectively, these investigations suggest that chan-
ges in the concentration of free fatty acids and insulin
are important in regulating the expression of PDK iso-
forms, either directly or indirectly. Alterations in these
factors, induced by starvation, high-fat feeding, and
diabetes, result in an imbalance in PDK ⁄ PDP activity
and thus in hyperphosphorylation and inactivation of
PDC.
Most studies to date have utilized animal models or
animal-derived cell lines to investigate chronic changes
in PDK ⁄ PDP isoform expression. However, little work
has been done in human systems. Data from our
laboratory suggest that cultured human muscle cells
represent a valuable system for metabolic studies
[20–24]. This study examines the effects of different
hormonal, nutritional, and pharmacological conditions
on the mRNA expression of the two main isoforms
expressed in human muscle, namely PDK2 and PDK4
[3–5]. It also confirms the significant contribution
made to muscle metabolism by PPAR modulation and
highlights the importance of PPARd in these regula-
tory mechanisms.
Results
Identification of PDK1–4 and PDP1 isoforms
in human myoblasts
Primers designed to amplify specifically human
PDK1–4 and PDP1 were used in PCR and products
were identified by gel electrophoresis (data not shown).
Molecular cloning of each PDK or PDP isoform was
confirmed by sequence comparison of each clone with
E. L. Abbot et al. Regulation of hPDK2 and hPDK4 gene expression
FEBS Journal 272 (2005) 3004–3014 ª 2005 FEBS 3005
the previously reported DNA sequences [3–5]. This
verified that all the selected primer pairs were specific
for their designated isoform. Although mRNAs for all
four PDK isoforms were detected in our muscle cell
culture system, previous studies have reported PDK2
and PDK4 to be the predominant isoforms expressed
in mature human muscle [3–5], and therefore subse-
quent semi-quantitative RT–PCR experiments in this
study focused on changes in mRNA expression of
these isoforms.
The regulatory influence of glucose, fatty acids
and insulin on PDK2 and PDK4 mRNA expression
We examined the effects of the two predominant meta-
bolic fuels in muscle, namely glucose and fatty acids,
on PDK2 and PDK4 mRNA expression in human
myoblasts. Cells were incubated for 5 h in the presence
of different glucose concentrations. Depriving the cells
of glucose significantly increased PDK2 and PDK4
mRNA expression above basal (5 mm) values (Fig. 1A
and Table 1). In contrast, incubating the cells in a high
glucose medium (25 mm) had no significant effect on
the expression of either isoform compared with basal
levels. Insulin (1 lm) was found to markedly reverse
the effect of glucose deprivation on PDK2 and PDK4
transcript abundance by returning the transcript levels
to approximate basal values (5 mm glucose, minus
insulin) (Table 1).
Myoblasts were also incubated for 18 h in SF Ham’s
F10 media in the presence of saturated (palmitate,
100 lm), unsaturated (oleate, 100 lm) or both fatty
acids combined (100 lm of each). Each fatty acid, sin-
gularly or combined, significantly increased PDK2 or
PDK4 mRNA levels above basal (minus fatty acids)
values (Fig. 1B and Table 2). The effects on PDK2
and PDK4 transcript levels appeared maximal at
100 lm of each fatty acid (data not shown) and no fur-
ther effects were observed in the presence of both fatty
acids (Table 2). Insulin (1 lm) reversed the effect of
the fatty acids (100 lm of each) on PDK mRNA
expression by returning transcript abundance of PDK2
and PDK4 to (minus fatty acids, minus insulin) values
(Table 2).
The ability of insulin alone to regulate PDK2 and
PDK4 transcript abundance was also investigated
(Fig. 2). Myoblasts were incubated for 5 h in the pres-
ence or absence of insulin (1 lm). Insulin markedly
decreased PDK2 and PDK4 mRNA levels below basal
values. In order to investigate the mechanisms by
which insulin regulates PDK mRNA expression, select-
ive inhibitors of signalling pathways known to be
activated by insulin were used. Two distinct phosphati-
dylinositol 3-kinase (PtdIns3K) inhibitors, wortmannin
and 2-(4-morpholinyl)-8-phenyl-4H-1-benzopyan-4-one
(LY294002) [25,26], were used to examine the role of
PtdIns3K in regulating PDK transcript abundance in
response to insulin (Fig. 2). Incubation with either
LY294002 (50 lm) or wortmannin (100 nm) signifi-
cantly inhibited the effects of insulin on PDK2 and
PDK4 mRNA expression by returning transcript
abundance to approximately basal levels (Fig. 2A,B).
Downstream targets of PtdIns3K include glycogen syn-
thase kinase-3 (GSK3) and the mammalian target of
rapamycin (mTOR). GSK3 is inactivated in response
to insulin via a PtdIns3K ⁄ protein kinase B (PKB)-
dependent pathway [27,28]. Involvement of GSK3 in
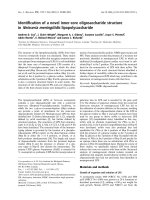
A
B
Fig. 1. Semi-quantitative RT-PCR showing the effect of glucose and
fatty acids on PDK2 and PDK4 mRNA expression. (A) Myoblasts
were incubated for 5 h in SF DMEM plus 0.2% (w ⁄ v) BSA under glu-
cose deprivation conditions (NG), 5 m
M glucose (5 mM) and 25 mM
glucose (25 mM). A typical experiment representing amplification of
b-actin, PDK2 and PDK4 (amplified with full-length primers) is shown;
quantitative data is given in Table 1. (B) Myoblasts were incubated in
SF Ham’s F10 for 18 h in basal conditions [plus 0.12% (w ⁄ v) BSA;
B], supplemented with 100 l
M palmitate (P), supplemented with
100 l
M oleate (O), supplemented with 100 lM of palmitate and ole-
ate (BOTH). A typical experiment representing amplification of
b-actin, PDK2 and PDK4 (amplified with full-length primers) is shown;
quantitative data is given in Table 2.
Table 1. The effects of glucose ± insulin on PDK2 and PDK4 tran-
script abundance expressed as a percentage of basal (5 m
M) glu-
cose levels. Results are the means ± SEM of n ¼ 3, from cells
prepared from three different subjects and values are expressed as
a percentage of basal (100%, 5 m
M glucose, minus insulin). Statisti-
cal significance compared with basal untreated levels (P<0.05) is
indicated by *, or statistical significance as compared to no glucose
values (P<0.05 and < 0.001) are represented by and . Results
are expressed against the 5 m
M glucose control values (see Experi-
mental procedures).
No glucose 25 m
M glucose No glucose + insulin (1 lM)
PDK2 172.0 ± 25.5* 101.1 ± 25.0 83.7 ± 4.3
PDK4 205.5 ± 35.4* 97.9 ± 18.9 80.7 ± 12.8
Regulation of hPDK2 and hPDK4 gene expression E. L. Abbot et al.
3006 FEBS Journal 272 (2005) 3004–3014 ª 2005 FEBS
the insulin-induced downregulation of PDK mRNA
expression was assessed using lithium, an allosteric
inhibitor of GSK3 [29] (Fig. 2C). LiCl (50 mm) mim-
icked the effects of insulin on PDK transcript abun-
dance by significantly reducing PDK2 and PDK4
mRNA expression below basal (minus insulin and lith-
ium) values. mTOR is important in regulating several
components of the protein translational machinery and
has been established as an insulin-sensitive target pro-
tein [30]. Incubation of myoblasts with the mTOR-
selective inhibitor rapamycin (100 nm) for 5 h was
employed to further elucidate the insulin-to-PDK path-
way downstream of PtdIns3K. In contrast to the
results obtained with the PtdIns3K inhibitors, rapa-
mycin (100 nm) did not reverse the effects of insulin
(1 lm) on PDK mRNA expression (Fig. 2D). How-
ever, incubation with rapamycin alone significantly
reduced PDK2 (77.1 ± 5.3, n ¼ 3; P < 0.05) and
PDK4 (73.2 ± 7.6, n ¼ 3, P < 0.05) mRNA levels
below basal values (100%, minus rapamycin), suggest-
ing that inhibition of basal mTOR activity affects
PDK mRNA expression (data not shown). As p70
S6K
is a downstream target of mTOR, the ability of rapa-
mycin to inhibit insulin-stimulated phosphorylation of
p70
S6K
, by immunoblotting with phospho-p70
S6K
, con-
firmed that this inhibitor was still operating after the
5 h incubation period (data not shown).
Insulin stimulation of the mitogen-acitvated protein
kinase (MAPK) pathway results in the phosphoryla-
tion of transcription factors in the nucleus, leading to
cellular proliferation and differentiation [31]. This
pathway is selectively inhibited by the mitogen-activa-
ted protein kinase kinase (MEK) inhibitor, U0126
[32,33]. Therefore, the role of the MAPK pathway in
regulating PDK mRNA expression was investigated by
incubating myoblasts for 5 h in the presence of insulin
(1 lm) and U0126 (100 lm). U0126 failed to reverse
the effects of insulin on PDK2 and PDK4 transcript
abundance (Fig. 2D), suggesting that the MAPK
signalling cascade is not involved in transducing the
insulin-to-PDK transcriptional signal. The ability of
U0126 to inhibit insulin-stimulated phosphorylation of
MAPK in our cell system was confirmed by immuno-
blotting with phospho-MAPK after the 5 h incubation
period (data not shown).
Identification of PPAR isoforms in human
myotubes
Prior to investigating the effects of PPAR agonists on
PDK mRNA expression, it was first necessary to con-
firm expression of each receptor in human myotubes.
Total RNA was isolated from 7-day differentiated
myotubes and subsequently used as a template for full-
length, first-strand cDNA synthesis. Primers were
designed to specifically amplify human PPAR a, d
and c1 and PCR products were identified by gel elec-
trophoresis (data not shown). Molecular cloning of
each isoform was confirmed by sequence analysis and
comparison of each clone with the reported DNA
sequence of human PPAR a, d and c1 [34–36]. This
confirmed that all three receptors are expressed in dif-
ferentiated myotubes.
The effects of PPAR agonists on PDK2 and PDK4
mRNA expression
The effects of PPARa (GW7647), PPARd (GW0742)
and PPARc (GW7845) specific agonists, at several
different concentrations, on the mRNA expression of
PDK2 and PDK4 were studied in human myotubes
(Fig. 3). Incubation (24 h) with the PPARd agonist
significantly augmented PDK4 transcript abundance
in a concentration-dependent manner, at nanomolar
concentrations concurrent with PPARd affinity
(Fig. 3A; the lower band corresponds to PDK4
mRNA amplification as this band is of the correct
M
r
, the larger band was an unidentified product).
Incubation (24 h) with the PPARa agonist also signi-
ficantly upregulated PDK4 mRNA expression at 10
and 100 nm (Fig. 3B). However, at the lower concen-
trations no effect on PDK4 mRNA expression was
Table 2. The effects of fatty acids ± insulin on PDK2 and PDK4 transcript abundance expressed as a percentage of basal levels. Results are
the means ± SEM of n ¼ 3, from cells prepared from three different subjects and values are expressed as a percentage of basal (100%,
minus fatty acids and insulin) levels. Statistical significance as compared to basal (minus fatty acid) values (P<0.05, < 0.001 and < 0.0001)
is indicated by *, ** and ***, respectively, or statistical significance as compared to palmitate plus oleate values (statistical significance
P < 0.05) is indicated by . Results are expressed against basal (minus fatty acid) control value (see Experimental procedures).
Palmitate
(100 l
M)
Oleate
(100 lM)
Palmitate and
Oleate (100 lM)
Palmitate and Oleate
(100 lM) and Insulin (1 l M)
PDK2 182.4 ± 18.1* 180.7 ± 15.2** 163.5 ± 3.0*** 82.1 ± 10.3
PDK4 152.8 ± 11.6* 153.5 ± 6.3** 148.0 ± 9.5** 97.1 ± 10.8
E. L. Abbot et al. Regulation of hPDK2 and hPDK4 gene expression
FEBS Journal 272 (2005) 3004–3014 ª 2005 FEBS 3007
induced. Neither the PPARa nor PPARd agonists
affected PDK2 mRNA expression (Fig. 3A,B). In
contrast, incubation (24 h) with the PPARc agonist
selectively downregulated PDK2 transcript abundance
(Fig. 3C). This effect was evident at agonist concen-
trations of 1, 10 and 100 nm. However, treatment
with this agonist had no effect on PDK4 mRNA
transcript abundance (Fig. 3C). This data is summar-
ized in Table 3.
Discussion
Numerous investigations have focused on the effects of
starvation, high-fat feeding and chemically induced
diabetes on the levels of PDK expression [11]. In sum-
mary, these studies have generally observed a selective
increase in PDK4 mRNA and protein expression in
response to various metabolic challenges. Although the
majority of these investigations have observed coordi-
nated regulation of mRNA and protein expression, an
increase in PDK4 protein abundance independent of
A
B
C
D
Fig. 2. Semi-quantitative RT-PCR showing the effects of insulin and
LY294002, wortmannin, or LiCl on PDK2 and PDK4 mRNA expres-
sion. (A–C) Myoblasts were incubated in SF Ham’s F10 for 5 h in
basal conditions (B), plus 1 l
M insulin (I), 1 l M insulin plus 50 lM
LY294002 (I + LY) ⁄ 100 nM wortmannin (I + Wt) ⁄ 50 mM LiCl (I +
LiCl) or 50 l
M LY294002 alone (LY) ⁄ 100 nM wortmannin alone
(Wt) ⁄ 50 m
M LiCl alone (LiCl). Typical experiments representing
amplification of b-actin, PDK2 and PDK4 (A, B amplified with full-
length primers; C, amplified with short primers) are shown.
(D) Results are expressed as a percentage of basal (minus insulin)
levels and are the means ± SEM of n ¼ 3, from cells pre-
pared from three different subjects. Statistical significance
(P<0.05, < 0.001 and < 0.0001) compared with basal untreated
values is indicated by *, ** and ***, respectively, or statistical sig-
nificance compared with insulin values (P<0.05 and < 0.0001) are
represented by ,or, respectively.
A
B
C
Fig. 3. Semiquantitative RT-PCR showing the effects of the PPARd
agonist (GW0742), PPARa agonist (GW7647) or PPARc agonist
(GW7845) on PDK2 and PDK4 mRNA expression. Myotubes were
incubated for 24 h in a -MEM plus 2% FBS under basal conditions
(plus 0.01% DMSO, B), or plus indicated concentrations in n
M of
(A) GW0742 (B) GW7647 (10 n
M GW0742 was included as a posit-
ive control) (C) GW7845. Typical experiments representing amplifi-
cation of b-actin, PDK2 and PDK4 (amplified with short primers) are
shown; quantitative data is given in Table 3.
Regulation of hPDK2 and hPDK4 gene expression E. L. Abbot et al.
3008 FEBS Journal 272 (2005) 3004–3014 ª 2005 FEBS
changes in mRNA levels has been reported [37]. Such
a result suggests the importance of both mRNA and
protein analyses when investigating chronic PDK regu-
lation. Majer et al. [8] reported that rabbit antiserum
developed against rat recombinant PDK2 protein
cross-reacted with the purified human recombinant
PDK4 protein in western blot analyses. We observed
similar cross-reactivity with both rat PDK2 and PDK4
antiserum against human recombinant PDK1–4 pro-
teins (unpublished observation). Using short peptides
representing human PDK2 and PDK4 amino acid
sequences, antibodies specific for human PDK2 and
PDK4 were successfully generated. However, due to
poor antibody sensitivity and low levels of PDK pro-
tein expression in cultured cells, changing levels of
PDK protein expression could not be analysed in this
study.
Glucose deprivation (5 h) elicited a significant
increase in PDK2 and PDK4 mRNA levels when com-
pared with controls in complete medium (Fig. 1A),
consistent with previous findings in a human rhabdo-
myosarcoma cell line (20-h glucose deprivation) and
in rat liver, kidney, white adipose tissue, and lactating
mammary gland in vivo after 48 h starvation [8,38].
However, investigations in rat heart and skeletal mus-
cle have reported a selective increase in PDK4 mRNA
after fasting (except in fast-oxidative muscle fibres in
which an increase in both PDK2 and PDK4 mRNA
was observed) [12–14,39,40]. Further work is needed to
determine the mechanism by which glucose deprivation
elicits these changes in expression. A recent study
by Furuyama et al. [41] suggests that upregulation of
PDK4 mRNA expression in C2C12 cells may be
induced by the starvation-responsive forkhead-homo-
logue in rhabdomyosarcoma (FKHR) transcription
factor.
Incubating myoblasts for 18 h in the presence of
fatty acids (saturated and unsaturated) also enhanced
the expression of PDK2 and PDK4 mRNA (Fig. 1B).
This result is in partial contrast to findings from biop-
sies of the vastus lateralis muscle of subjects exposed
to a 3-day low-carbohydrate ⁄ high-fat diet (5% carbo-
hydrate, 73% fat, 22% protein) [42]. These authors
reported a specific upregulation of PDK4 mRNA
levels, without affecting PDK2 transcript abundance.
Insulin reversed the effects of glucose deprivation or
fatty-acid-supplemented medium, by returning PDK2
and PDK4 mRNA transcript levels to control (minus
insulin) values (Tables 1 and 2). In addition, insulin
alone significantly reduced PDK2 and PDK4 transcript
abundance below basal values (Fig. 2). Thus, the activ-
ity of PDC is regulated independently by the main fuel
sources in muscle and by insulin through directly
altering the expression of the human PDK2 and PDK4
isoforms.
In addition to our findings, insulin has been shown
to decrease the mRNA for PDK2 and PDK4 in
7800C1 hepatoma cells, human rhabdomyosarcoma
cells and whole skeletal muscle biopsies from nondia-
betic Pima Indians [8,43]. However, the insulin signal-
ling pathway utilized to relay this signal remains
relatively uncharacterized. Figure 2 demonstrates that
the two PtdIns3K inhibitors, LY294002 and wortman-
nin, prevented insulin-induced downregulation of
PDK2 and PDK4 mRNA, returning transcript abun-
dance to control levels. However, neither mTOR nor
MAPK activation appeared to be necessary for trans-
ducing the insulin-to-PDK transcription signal
(Fig. 2D). Yet in contrast, inhibition of GSK3 by lith-
ium mimicked the effects of insulin on PDK mRNA
expression by reducing PDK2 and PDK4 transcript
abundance (Fig. 2C). Several transcription factors,
including c-Jun, c-Myc and CREB have been identified
as potential substrates for GSK3 phosphorylation [44].
Therefore, insulin-mediated phosphorylation and thus
inhibition of GSK3 may prevent the subsequent phos-
phorylation and activation of transcription factors
which are involved in transcribing PDK mRNA. In
Table 3. The effects of PPAR a, d and c agonists on PDK2 and PDK4 transcript abundance expressed as a percentage of basal levels.
Results are the means ± SEM of cell preparations from three different subjects. Values are expressed as a percentage of basal (100%,
minus agonist) levels and statistical significance (P<0.05, < 0.001 and < 0.0001) compared with basal untreated values is indicated by *,
** and ***, respectively.
PPARd 0.01 n
M 0.1 nM 1nM 10 nM
PDK2 126.9 ± 13.8 92.7 ± 3.5 104.2 ± 8.8 86.4 ± 3.0
PDK4(s) 133.7 ± 5.3*** 194.7 ± 10.4*** 237.3 ± 13.3*** 247.1 ± 6.2***
PPARa 0.1 n
M 1nM 10 nM 100 nM
PDK2 98.3 ± 7.8 91.3 ± 6.4 99.1 ± 5.7 99.8 ± 20.9
PDK4(s) 102.7 ± 10.7 109.9 ± 18.0 166.4 ± 16.5** 179.0 ± 10.5**
PPARc 0.1 n
M 1nM 10 nM 100 nM
PDK2 97.0 ± 4.1 84.0 ± 6.4* 75.9 ± 3.9*** 61.4 ± 5.4***
PDK4(s) 89.5 ± 11.0 84.4 ± 14.3 89.4 ± 21.9 114.9 ± 12.7
E. L. Abbot et al. Regulation of hPDK2 and hPDK4 gene expression
FEBS Journal 272 (2005) 3004–3014 ª 2005 FEBS 3009
addition, the importance of PKB-alpha and the FOXO
transcription factors in glucocorticoid-stimulated
human PDK4 gene expression has recently been dem-
onstrated [45].
The effects of PPARa activation, using GW7647, in
upregulating PDK4 transcript abundance have been
reported previously in primary cultures of human
muscle cells [17,18]. However, in these investigations
GW7647 was used at a concentration of 1 lm [17,18].
The EC
50
values of GW7647 for a, d and c receptors
are 0.0061, 1 and 8 lm, respectively [46], and thus at a
1 lm concentration GW7647 may have been activating
both PPARa and PPARd receptors. Therefore, in this
study, a concentration range of GW7647 (0.1, 1, 10
and 100 nm) was used to characterize specifically the
effects of PPARa activation in human myotubes.
Figure 3 shows that activating the PPARa receptor
with agonist concentrations of 10 and 100 nm selec-
tively increases PDK4 mRNA transcript abundance.
In similar experiments the effects of PPARd activation
using the selective agonist GW0742 (EC
50
of 1.2,
0.0001, 4.1 lm for a, d and c receptors, respectively;
K Buchan, unpublished) was determined. It is evident
(Fig. 3) that PPARd activation also markedly stimu-
lates PDK4 mRNA expression, even at a concentra-
tion of 0.01 nm. Figure 1 demonstrates that fatty acids
regulate the mRNA expression of both PDK2 and
PDK4. However, in contrast, PPARa and d activation
selectively increase the levels of PDK4 mRNA without
affecting PDK2 expression. This observation suggests
that PPARa or d target directly the PDK4 transcrip-
tional machinery, whereas fatty acids augment PDK2
and PDK4 transcript abundance via an indirect mech-
anism.
Recent observations in transgenic mouse models
overexpressing PPARd in skeletal muscle have shown
adaptive re-modelling of the muscle, leading to fibre-
type switching and improvements in exercise endurance
[47,48]. These observations support the role for
PPARd as an important transcriptional regulator, not
only for PDK4 but also in the coordinated responses
of muscle metabolism and phenotype re-modelling. In
addition, the left shift in the dose–response curve for
PDK4 upregulation with GW0742 (compared with
PPARa GW7647) suggests a more significant role for
PPARd than PPAR a in modulating these events.
The effects of the PPARc agonist GW7845 (EC
50
of 3.5 lm, inactive at 10 lm, 0.00071 lm for a, d and
c receptors, respectively) [49] was also analysed and
shown to selectively regulate PDK2 mRNA expres-
sion by decreasing transcript abundance in a dose-
responsive manner but was without effect of PDK4.
It has previously been reported that treatment with
GW1929 reduced the expression of PDK4 mRNA in
muscle biopsies of ZDF rats, but PDK2 transcript
abundance was not analysed [19]. Thus, the PDK iso-
form regulated in response to PPARc activation
appears to differ between rat and human tissues. A
selective increase in PDK4 expression in response to
PPARa and d activation renders the tissue relatively
insensitive to changes in the concentrations of acute
effector molecules, such as pyruvate. Therefore, by
specifically reducing PDK2 mRNA expression, this
method of ensuring chronic regulation in response to
PPARc activation is maintained, as the pyruvate-
unresponsive isoform remains predominantly expre-
ssed. Our study suggests that direct effects of PPARc
are present in human muscle, and thus the anti-dia-
betic efficacy of the TZDs may not be solely the con-
sequence of adipocyte-specific effects. The effects of
PPARc activation in muscle are consistent with a
decreased reliance on lipids and an enhanced depend-
ence on glucose as a source of energy. Thus inhibition
of PDK2 expression may represent an important
mechanism by which PPARc agonists enhance glucose
utilization in muscle.
PDP1 mRNA expression appeared to be unaffected
by all the conditions analysed in this investigation
(data not shown). This is consistent with the findings
of Huang et al. [50] who reported no change in PDP1
mRNA and protein expression in response to starva-
tion and streptozotocin-induced diabetes in rat heart
and kidney. There is a limited amount of evidence to
suggest that PDP2 levels may change [50], but overall
the work to date suggests that control of expression of
PDK isoforms is the major mechanism for chronic
regulation of the activity state of PDC.
In conclusion, in response to various nutritional
conditions (glucose and fatty acid) and hormonal con-
ditions (insulin) the expression of PDK2 and PDK4
appeared to be regulated in concert. This suggests that
the human PDK isoenzymes may be regulated by these
metabolic factors by relatively general mechanisms,
and our data using inhibitors strongly implicates the
PtdIns3K and GSK3 signalling pathways. In contrast,
PPAR agonists appeared to regulate PDK2 and PDK4
in an isoform specific manner, suggesting that these
agonists are directly targeting specific human PDK
genes and support the observations in vivo that the
nuclear hormone PPARd is a key player in fatty acid
utilization in skeletal muscle. In addition, the coordi-
nated regulation of glucose and fatty acid metabolism
by PPARs, in both adipose tissue and muscle, place
them as central players in obesity and insulin resist-
ance, two significant aspects of the metabolic syn-
drome.
Regulation of hPDK2 and hPDK4 gene expression E. L. Abbot et al.
3010 FEBS Journal 272 (2005) 3004–3014 ª 2005 FEBS
Experimental procedures
Materials
General laboratory reagents were supplied by Sigma (Poole,
UK) with the following exceptions. Tissue culture flasks
and plates were supplied by Greiner (Stonehouse, UK), all
media, fetal bovine serum (FBS), trypsin ⁄ EDTA and peni-
cillin ⁄ streptomycin were from Invitrogen (Paisley, UK).
Chick embryo extract was obtained from Sera Laboratories
International (Salisbury, UK). Actrapid insulin was from
Novo Nordisk (Copenhagen, Denmark). The PtdIns3K
inhibitors LY294002 and wortmannin were from Alexis
Corporation (Nottingham, UK) and Sigma, respectively.
The mTOR inhibitor, rapamycin, was purchased from Sig-
ma and the MEK inhibitor, U0126, was from Promega
(Southampton, UK). The PPAR agonists; GW7845,
GW7647 and GW0742 were kindly supplied by Glaxo-
SmithKline Pharmaceuticals (Stevenage, UK).
Cell culture
Human myoblasts were grown from needle biopsy samples
taken from the gastrocnemius muscle of healthy subjects
with no family history of type 2 diabetes and with normal
glucose tolerance and insulin sensitivity, as assessed using
the short insulin tolerance test. Myoblasts were main-
tained in growth medium consisting of Ham’s F10 nutrient
mixture supplemented with 20% FBS, 1% chick embryo
extract, 100 UÆmL
)1
penicillin and 100 lgÆmL
)1
streptomy-
cin. Experiments were performed using myoblast cells
between the 5th and 15th passage at a confluence of
> 90%. Myoblast differentiation was carried out on cells
which had reached 90–100% confluence. Differentiation
was induced by incubating the cells in a-minimal essential
media (a-MEM) containing 2% FBS, 100 UÆmL
)1
penicillin
and 100 lgÆmL
)1
streptomycin for a minimum of 7 days.
For glucose-deprivation experiments, cells were incubated
in Dulbecco’s modified Eagle’s medium (DMEM) minus
glucose or DMEM supplemented with 5 or 25 mmd-glu-
cose (BDH, Poole, UK). Prior to acute treatments, cells
were incubated in serum-free media containing 0.2% (w ⁄ v)
bovine serum albumin (BSA) for a minimum of 4 h.
Molecular cloning
Isolation of RNA from muscle cells was performed using
TRI Reagent (Sigma). RNA (5 lg) was used to synthesize
cDNA with a dT
15
oligonucleotide and Superscript II (Invi-
trogen). Control reactions were prepared without the
addition of reverse transcriptase. The gene-specific oligo-
nucleotide primers for PCR were designed according to the
nucleotide sequences available on EMBL DNA database
and are shown in Table 4. PCR was performed using
50 pmol of each gene-specific primer, 1 ng of double-stran-
ded cDNA, dNTPs (200 lm), buffers and 0.5 U of Expand
High Fidelity Polymerase (Roche Diagnostics Ltd, Lewes,
UK) in a final volume of 100 lL. Ten PCR cycles were car-
ried out using 15 s at 94 °C (denaturing), 30 s at 45 °C
(annealing) and 2 min at 72 °C (extension). Twenty cycles
were subsequently performed using 94 °C for 15 s (denatur-
ing), 45 °C for 30 s (annealing), 72 °C for 2 min (extension)
and cycle elongation of 5 s for each cycle. In order to verify
primer specificity, the product of each reaction was cloned
Table 4. Primer sequences designed to specifically amplify full length PDK1–4, a short fragment of PDK4, PDP1 and PPARa, d and c1iso-
forms from human muscle cell cDNA.
Primer Sequence
PDK1F 5¢-TGGCCCATGGTTCCGGGCCCAGGTGGAGTTCTACGCG-3¢
PDK1R 5¢-CGCGCTCGAGGGCACTGCGGAACGTCGTCATGTCTTTGG-3¢
PDK2F 5¢-TGGCGAATTCGGCCCAAGTACATAGAGCACTTCAGCAAGTTC-3¢
PDK2R 5¢-CGCGAAGCTTCGTGACGCGGTACGTGGACGTGTTCTTGG-3¢
PDK3F 5¢-CGCGGAGCTCGGCCCAAGCAGATCGAGCGCTACTCG-3¢
PDK3R 5¢-CGCGCTCGAGCTGTTTTGCTTTTGCTTTGTATTTTGAAGCATCC-3¢
PDK4F 5¢-CGCGCCATGGTCAAGATGAAGGCGGCCCGCTTCGTGCTGCGC-3¢
PDK4R 5¢-CGCGCTCGAGGTCCTGAGTGTCCCTCTTCACATGGCCAC-3¢
PDK4F (short) 5¢-GAGCCTGATGGATTTGGT-3¢
PDK4R (short) 5¢-GTTGCCCGCATTGCATTC-3¢
PDP1F 5¢-GGCCAAAGGAGAACTGGTGGCAGTACACCC-3¢
PDP1R 5¢-GGCATCAGCAAGCCAAGCAGCCGATCC-3¢
PPARaF5¢-CGCAATCCATCGGCGAGGATAGTTCTG-3¢
PPARaR5¢-GGCCACCAGCGTCTTCTCAGC-3¢
PPARdF5¢-CGGGAAGAGGAGGAGAAAGAG-3¢
PPARdR5¢-CACGCTGATCTCCTTGTAGGG-3¢
PPARcF5¢-GTGGAGCCTGCATCTCCACC-3¢
PPARcR5¢-CTCCTGCAGGGGGGTGATGTG-3¢
E. L. Abbot et al. Regulation of hPDK2 and hPDK4 gene expression
FEBS Journal 272 (2005) 3004–3014 ª 2005 FEBS 3011
into the pET21(d) vector (CN Sciences, Nottingham, UK)
and the fidelity of each construct confirmed by DNA sequen-
cing (Molecular Biology Unit, University of Newcastle
upon Tyne, UK).
Semi-quantitative RT-PCR
PCR amplification was performed using Taq DNA poly-
merase (Sigma). Each reaction mixture contained 25 pmol
of each primer, 1 ng of double-stranded tcDNA and
dNTPs (200 lm) in a final volume of 50 lL. Samples were
initially heated for 5min at 95 °C before 2.5 U of Taq
DNA polymerase was added. Thirty amplification cycles
were performed with the following parameters: 92 °C for
1 min (denaturing), 55 °C for 1 min (annealing) and 72 °C
for 1.5 min (elongation). b-Actin transcript abundance,
amplified with primers (5¢-TCCACGAACTACCTTCAAC-
3¢ and 5 ¢-TTTAGGATGGCAAGGGAC-3¢), was used to
standardize the amount of cDNA added to each reaction.
Products were electrophoresed on a 2% agarose gel and
visualized by ethidium bromide staining. Quantification of
transcript abundance was performed using tina (v. 2.09d).
In order to confirm that amplification was not saturated
after 30 PCR cycles, b-actin cDNA abundance was ana-
lysed after 10, 20, 30 and 40 PCR cycles. Amplification
continued to increase up to 40 cycles verifying that at the
cDNA concentrations and PCR parameters employed,
mRNA abundance will not be saturated, allowing detection
of changes in their levels.
Statistical analysis
Data were analysed by Student’s t-test (unpaired) using
graph pad prism (v. 3.0) and presented as means ± SEM
with the number of different cell lines in parenthesis. Tests
were analysed using the raw data (arbitrary units from gel
scans) and are given with respect to control values which
were normalized to 100%.
Acknowledgements
ELA was supported by a Biotechnology and Biologi-
cal Sciences Research Council CASE studentship in
collaboration with Novo Nordisk. We wish to thank
Mrs Dorothy Fittes for her excellent technical assist-
ance.
References
1 Linn TC, Pettit FH & Reed LJ (1969) Alpha-keto acid
dehydrogenase complexes. X. Regulation of the activity
of the pyruvate dehydrogenase complex from beef kid-
ney mitochondria by phosphorylation and dephosphory-
lation. Proc Natl Acad Sci USA 62, 234–241.
2 Yeaman SJ, Hutcheson ET, Roche TE, Pettit FH,
Brown JR, Reed LJ, Watson DC & Dixon GH (1978)
Sites of phosphorylation on pyruvate dehydrogenase
from bovine kidney and heart. Biochemistry 17 , 2364–
2370.
3 Gudi R, Bowker-Kinley MM, Kedishvili NY, Zhao Y
& Popov KM (1995) Diversity of the pyruvate dehydro-
genase kinase gene family in humans. J Biol Chem 270,
28989–28994.
4 Rowles J, Scherer SW, Xi T, Majer M, Nickle DC,
Rommens JM, Popov KM, Harris RA, Riebow NL,
Xia J et al. (1996) Cloning and characterization of
PDK4 on 7q21.3 encoding a fourth pyruvate dehydro-
genase kinase isoenzyme in human. J Biol Chem 271,
22376–22382.
5 Huang B, Gudi R, Wu P, Harris RA, Hamilton J &
Popov KM (1998) Isoenzymes of pyruvate dehydrogen-
ase phosphatase. DNA-derived amino acid sequences,
expression and regulation. J Biol Chem 273 , 17680–
17688.
6 Bowker-Kinley MM, Davis WI, Wu P, Harris RA &
Popov KM (1998) Evidence for existence of tissue-speci-
fic regulation of the mammalian pyruvate dehydrogen-
ase complex. Biochem J 329, 191–196.
7 Bennett PH, Burch TA & Miller M (1971) Diabetes
mellitus in American (Pima) Indians. Lancet 2, 125–128.
8 Majer M, Popov KM, Harris RA, Bogardus C & Pro-
chazka M (1998) Insulin downregulates pyruvate dehy-
drogenase kinase (PDK) mRNA: potential mechanism
contributing to increased lipid oxidation in insulin-resis-
tant subjects. Mol Genet Metab 65, 181–186.
9 Abou MJ, Yakubu F, Lin. D, Peters JC, Atkinson JB
& Hill JO (1992) Skeletal muscle composition in dietary
obesity-susceptible and dietary obesity-resistant rats. Am
J Physiol 262, R684–R688.
10 Hickey MS, Carey JO, Azevedo JL, Houmard JA,
Pories WJ, Israel RG & Dohm GL (1995) Skeletal mus-
cle fiber composition is related to adiposity and in vitro
glucose transport rate in humans. Am J Physiol 268,
E543–E547.
11 Sugden MC & Holness MJ (2003) Recent advances in
mechanisms regulating glucose oxidation at the level of
the pyruvate dehydrogenase complex by PDKs. Am J
Physiol Endocrinol Metab 284, E855–E862.
12 Wu P, Inskeep K, Bowker-Kinley MM, Popov KM &
Harris RA (1999) Mechanism responsible for inactiva-
tion of skeletal muscle pyruvate dehydrogenase complex
in starvation and diabetes. Diabetes 48, 1593–1599.
13 Sugden MC, Lall HS, Harris RA & Holness MJ (2000)
Selective modification of the pyruvate dehydrogenase
kinase isoform profile in skeletal muscle in hyperthyr-
oidism: implications for the regulatory impact of glucose
on fatty acid oxidation. J Endocrinol 167, 339–345.
14 Peters SJ, Harris RA, Heigenhauser GJ & Spriet LL
(2001) Muscle fiber type comparison of PDH kinase
Regulation of hPDK2 and hPDK4 gene expression E. L. Abbot et al.
3012 FEBS Journal 272 (2005) 3004–3014 ª 2005 FEBS
activity and isoform expression in fed and fasted rats. Am
J Physiol Regul Integr Comp Physiol 280, R661–R668.
15 Holness MJ, Kraus A, Harris RA & Sugden MC (2000)
Targeted upregulation of pyruvate dehydrogenase kinase
(PDK)-4 in slow-twitch skeletal muscle underlies the
stable modification of the regulatory characteristics of
PDK induced by high-fat feeding. Diabetes 49, 775–781.
16 Berger J & Moller DE (2002) The mechanisms of action
of PPARs. Annu Rev Med 53, 409–435.
17 Muoio DM, MacLean PS, Lang DB, Li S, Houmard
JA, Way JM, Winegar DA, Corton JC, Dohm GL &
Kraus WE (2002) Fatty acid homeostasis and induction
of lipid regulatory genes in skeletal muscles of peroxi-
some proliferator-activated receptor (PPAR) alpha
knock-out mice. Evidence for compensatory regulation
by PPAR delta. J Biol Chem 277, 26089–26097.
18 Muoio DM, Way JM, Tanner CJ, Winegar DA, Kliewer
SA, Houmard JA, Kraus WE & Dohm GL (2002) Peroxi-
some proliferator-activated receptor-alpha regulates fatty
acid utilization in primary human skeletal muscle cells.
Diabetes 51, 901–909.
19 Way JM, Harrington WW, Brown KK, Gottschalk WK,
Sundseth SS, Mansfield TA, Ramachandran RK, Willson
TM & Kliewer SA (2001) Comprehensive messenger ribo-
nucleic acid profiling reveals that peroxisome prolifera-
tor-activated receptor gamma activation has coordinate
effects on gene expression in multiple insulin-sensitive tis-
sues. Endocrinology 142, 1269–1277.
20 Borthwick AC, Wells AM, Rochford JJ, Hurel SJ,
Turnbull DM & Yeaman SJ (1995) Inhibition of glyco-
gen synthase kinase-3 by insulin in cultured human ske-
letal muscle myoblasts. Biochem Biophys Res Commun
210, 738–745.
21 Hurel SJ, Rochford JJ, Borthwick AC, Wells AM,
Vandenheede JR, Turnbull DM & Yeaman SJ (1996)
Insulin action in cultured human myoblasts: contribu-
tion of different signalling pathways to regulation of
glycogen synthesis. Biochem J 320, 871–877.
22 Armstrong JL, Bonavaud SM, Toole BJ & Yeaman SJ
(2001) Regulation of glycogen synthesis by amino acids
in cultured human muscle cells. J Biol Chem 276,
952–956.
23 Halse R, Pearson SL, McCormack JG, Yeaman SJ &
Taylor R (2001) Effects of tumor necrosis factor-alpha
on insulin action in cultured human muscle cells. Dia-
betes 50, 1102–1109.
24 Halse R, Bonavaud SM, Armstrong JL, McCormack
JG & Yeaman SJ (2001) Control of glycogen synthesis
by glucose, glycogen, and insulin in cultured human
muscle cells. Diabetes 50, 720–726.
25 Cheatham B, Vlahos CJ, Cheatham L, Wang L, Blenis
J & Kahn CR (1994) Phosphatidylinositol 3-kinase acti-
vation is required for insulin stimulation of pp70, S6
kinase, DNA synthesis, and glucose transporter trans-
location, Mol Cell Biol 14, 4902–4911.
26 Okada T, Kawano Y, Sakakibara T, Hazeki O & Ui M
(1994) Essential role of phosphatidylinositol 3-kinase in
insulin-induced glucose transport and antilipolysis in rat
adipocytes. Studies with a selective inhibitor wortman-
nin. J Biol Chem 269, 3568–3573.
27 Stambolic V & Woodgett JR (1994) Mitogen inactiva-
tion of glycogen synthase kinase-3 beta in intact cells
via serine 9 phosphorylation. Biochem J 303, 701–704.
28 Sutherland C & Cohen P (1994) The alpha-isoform
of glycogen synthase kinase-3 from rabbit skeletal
muscle is inactivated by p70, S6 kinase or MAP
kinase-activated protein kinase-1 in vitro. FEBS Lett
338, 37–42.
29 Klein PS & Melton DA (1996) A molecular mechanism
for the effect of lithium on development. Proc Natl
Acad Sci U S A 93, 8455–8459.
30 Proud CG (2004) Role of mTOR signalling in the con-
trol of translation initiation and elongation by nutrients.
Curr Top Microbiol Immunol 279, 215–244.
31 Blenis J (1993) Signal transduction via the MAP
kinases: proceed at your own RSK. Proc Natl Acad Sci
USA 90, 5889–5892.
32 DeSilva DR, Jones EA, Favata MF, Jaffee BD,
Magolda RL, Trzaskos JM & Scherle PA (1998) Inhibi-
tion of mitogen-activated protein kinase kinase blocks T
cell proliferation but does not induce or prevent anergy.
J Immunol 160, 4175–4181.
33 Favata MF, Horiuchi KY, Manos EJ, Daulerio AJ,
Stradley DA, Feeser WS, Van Dyk DE, Pitts WJ, Earl
RA, Hobbs F et al. (1998) Identification of a novel
inhibitor of mitogen-activated protein kinase kinase.
J Biol Chem 273, 18623–18632.
34 Elbrecht A, Chen Y, Cullinan CA, Hayes N, Leibowitz
M, Moller DE & Berger J (1996) Molecular cloning,
expression and characterization of human peroxisome
proliferator activated receptors gamma 1 and gamma 2.
Biochem Biophys Res Commun 224, 431–437.
35 Schmidt A, Endo N, Rutledge SJ, Vogel R, Shinar D &
Rodan GA (1992) Identification of a new member of
the steroid hormone receptor superfamily that is acti-
vated by a peroxisome proliferator and fatty acids. Mol
Endocrinol 6, 1634–1641.
36 Sher T, Yi HF, McBride OW & Gonzalez FJ (1993)
cDNA cloning, chromosomal mapping, and functional
characterization of the human peroxisome proliferator
activated receptor. Biochemistry 32, 5598–5604.
37 Wu P, Peters JM & Harris RA (2001) Adaptive
increase in pyruvate dehydrogenase kinase 4 during
starvation is mediated by peroxisome proliferator-acti-
vated receptor alpha. Biochem Biophys Res Commun
287, 391–396.
38 Wu P, Blair PV, Sato J, Jaskiewicz J, Popov KM &
Harris RA (2000) Starvation increases the amount of
pyruvate dehydrogenase kinase in several mammalian
tissues. Arch Biochem Biophys 381, 1–7.
E. L. Abbot et al. Regulation of hPDK2 and hPDK4 gene expression
FEBS Journal 272 (2005) 3004–3014 ª 2005 FEBS 3013
39 Wu P, Sato J, Zhao Y, Jaskiewicz J, Popov KM &
Harris RA (1998) Starvation and diabetes increase the
amount of pyruvate dehydrogenase kinase isoenzyme 4
in rat heart. Biochem J 329, 197–201.
40 Sugden MC, Kraus A, Harris RA & Holness MJ (2000)
Fibre-type specific modification of the activity and
regulation of skeletal muscle pyruvate dehydrogenase
kinase (PDK) by prolonged starvation and refeeding is
associated with targeted regulation of PDK isoenzyme 4
expression. Biochem J 346, 651–657.
41 Furuyama T, Kitayama K, Yamashita H & Mori N
(2003) Forkhead transcription factor FOXO1 (FKHR)-
dependent induction of PDK4 gene expression in skele-
tal muscle during energy deprivation. Biochem J 375,
365–371.
42 Peters SJ, Harris RA, Wu P, Pehleman TL, Heigenhauser
GJ & Spriet LL (2001) Human skeletal muscle PDH
kinase activity and isoform expression during a 3-day
high-fat ⁄ low-carbohydrate diet. Am J Physiol Endocrinol
Metab 281, E1151–E1158.
43 Harris RA, Huang B & Wu P (2001) Control of pyru-
vate dehydrogenase kinase gene expression. Adv Enzyme
Regul 41, 269–288.
44 Frame S & Cohen P (2001) GSK3 takes centre stage
more than 20 years after its discovery. Biochem J 359,
1–16.
45 Kwon HS, Huang B, Unterman TG & Harris RA
(2004) Protein kinase B-alpha inhibits human pyruvate
dehydrogenase kinase-4 gene induction by dexametha-
sone through inactivation of FOXO transcription
factors. Diabetes 53, 899–910.
46 Brown PJ, Stuart LW, Hurley KP, Lewis MC, Winegar
DA, Wilson JG, Wilkison WO, Ittoop OR & Willson
TM (2001) Identification of a subtype selective human
PPARalpha agonist through parallel-array synthesis.
Bioorg Med Chem Lett 11, 1225–1227.
47 Wang Y-X, Zhang C-L, Yu RT, Cho HK, Nelson MC,
Bayuga-Ocampo CR, Ham J, Kang H & Evans RM
(2004) Regulation of muscle fiber type and running
endurance by PPARdelta. PLoS Biol 2, e294.
48 Luquet S, Lopez-Soriano J, Holst D, Frederich A,
Melki J, Rassoulazadegan M & Grimaldi P (2003) Per-
oxisome proliferator-activated receptor delta controls
muscle development and oxidative capability. FASEB J
17, 2299–2301.
49 Shearer BG & Hoekstra WJ (2003) Recent advances in
peroxisome proliferator-activated receptor science. Curr
Med Chem 10, 267–280.
50 Huang B, Wu P, Popov KM & Harris RA (2003) Star-
vation and diabetes reduce the amount of pyruvate
dehydrogenase phosphatase in rat heart and kidney.
Diabetes 52, 1371–1376.
Regulation of hPDK2 and hPDK4 gene expression E. L. Abbot et al.
3014 FEBS Journal 272 (2005) 3004–3014 ª 2005 FEBS