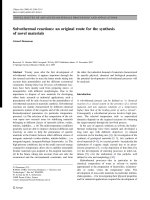
novel low cost solid liquid solid process for the synthesis of si3n4 nanowires at lower temperatures and their luminescence properties
Bạn đang xem bản rút gọn của tài liệu. Xem và tải ngay bản đầy đủ của tài liệu tại đây (1.63 MB, 9 trang )
www.nature.com/scientificreports
OPEN
received: 26 June 2015
accepted: 14 October 2015
Published: 26 November 2015
Novel, low-cost solid-liquidsolid process for the synthesis
of α-Si3N4 nanowires at
lower temperatures and their
luminescence properties
Haitao Liu1, Zhaohui Huang1, Juntong Huang2, Minghao Fang1, Yan-gai Liu1,
Xiaowen Wu1,3, Xiaozhi Hu4 & Shaowei Zhang2
Ultra-long, single crystal, α-Si3N4 nanowires sheathed with amorphous silicon oxide were
synthesised by an improved, simplified solid-liquid-solid (SLS) method at 1150 °C without using
flowing gases (N2, CH4, Ar, NH3, etc.). Phases, chemical composition, and structural characterisation
using X-ray diffraction (XRD), field emission scanning electron microscopy (FESEM), transmission
electron microscopy (TEM/HRTEM), Fourier-transform infrared spectroscopy (FT-IR), and X-ray
photoelectron spectroscopy (XPS) showed that the nanowires had Si3N4@SiOx core-shell structures.
The growth of the nanowires was governed by the solid-liquid-solid (SLS) mechanism. The room
temperature photoluminescence (PL) and cathodoluminescence (CL) spectra showed that the optical
properties of the α-Si3N4 nanowires can be changed along with the excitation wavelength or the
excitation light source. This work can be useful, not only for simplifying the design and synthesis
of Si-related nanostructures, but also for developing new generation nanodevices with changeable
photoelectronic properties.
One-dimensional (1-d) nanostructures have been observed in a number of material systems1–4.
Researchers have studied 1-d nanostructured materials due to their remarkable properties (including
optical, electronic, mechanical properties, etc.) and significant potential applications in optoelectronic
devices have been found5–7. In recent years, various 1-d nanomaterials have been fabricated, such as: C
nanotubes8,9, Ag nanowires10, Cu nanowires11, Si nanowires12,13, SiC nanochains14, Si3N4 nanobelts15, ZnO
nanosprings16, ZnO nanohelices17, etc.
Silicon nitride (Si3N4), an important wide-band gap semiconducting material with several applications in optoelectronics, can form single crystal nanowires, nanobelts, nanodendrites, and nanosheets
when treated with different methods18–21. Traditionally, 1-d Si3N4 nanomaterials are prepared by chemical
vapour deposition (CVD)22, plasma enhanced CVD (PECVD)23, microwave plasma heating24,25, catalytic
pyrolysis of a polymer precursor26, sol-gel27, combustion synthesis28, etc. The CVD method is considered
to be a potential method for the synthesis of Si3N4 nanostructures due to its low cost and simplicity.
1
School of Materials Science and Technology, Beijing Key Laboratory of Materials Utilization of Nonmetallic
Minerals and Solid Wastes, National Laboratory of Mineral Materials, China University of Geosciences (Beijing),
100083, P. R. China. 2College of Engineering, Mathematics and Physical Sciences, University of Exeter, Exeter
EX4 4QF, UK. 3Department of Mechanical Engineering, University College London, Torrington Place, London
WC1E 7JE, UK. 4School of Mechanical and Chemical Engineering, The University of Western Australia, Australia.
Correspondence and requests for materials should be addressed to Z.H. (email: ) or M.F.
(email: )
Scientific Reports | 5:17250 | DOI: 10.1038/srep17250
1
www.nature.com/scientificreports/
Figure 1. (a,b) Representative lower magnification FESEM images of as-grown nanowires found on the
substrate. The inset pattern in (a) is the EDS spectrum recorded from the marked area in (a). The inset
image in (b) is a higher magnification FESEM image of the products. (c,d) X-ray diffraction pattern of the
nanowire products covering the substrate.
Lin et al.22 prepared large-scale α -Si3N4 nanowires by a catalyst-free CVD route at 1400–1550 °C using
N2 as the nitrogen source, SiO, or a mixture of Si and SiO2, as the silicon source, N2 and Ar as the
barrier gas, and CH4 as the reducing gas. Huang et al.29 synthesised ultra-long, single crystal, α -Si3N4
nanobelts on graphite deposited with Ni(NO3)2 by CVD method with flowing N2 at 1450 °C. Huo et al.30
developed a CVD method for the production of single-crystalline α -Si3N4 nanobelts, consisting of the
nitridation of a high Si content Fe-Si catalyst by NH3 at 1300 °C. However, most of these CVD processes
involved complicated equipment, vacuum conditions, and relatively high temperatures. These issues limit
the production and application of Si3N4 nanostructured materials. Considering efficiency and economy,
a simplified solid-liquid-solid (SLS) process is considered to be a potentional method for the synthesis
of Si3N4 nanowires due to its low energy consumption.
We now report an improved and simplified SLS method without using flowing gases (N2, CH4, Ar,
NH3, etc.) to synthesise α -Si3N4 nanowires at the lower temperature of 1150 °C. The resulting α -Si3N4
nanowires were structurally characterised and found to have tunable luminescent properties, making
them attractive for new optoelectronic applications.
Results and Discussion
In this research, an improved, simplified SLS method, without using flowing gases (N2, CH4, Ar, NH3,
etc.) was used to synthesise Si3N4 nanowires at a lower temperature. White coloured layers of fluffy materials, extending from the substrate surfaces up to a few microns in height (as shown in Fig. 1a), were
visible to the naked eye on the substrates. Low resolution FESEM images showed the high degree of uniformity of the nanowires, which can be as long as several hundred microns. The best nanowire growth in
terms of morphology and yield was observed for a substrate heated to 1150 °C. EDS spectroscopy analysis
(see inset, Fig. 1a) indicated that the substrate was Si without detectable impurities therein. The inset to
Fig. 1b shows a higher magnification FESEM image, revealing that the products were actually nanowires
with diameters ranging from 80 to 150 nm. Figure 1c shows the X-ray diffraction (XRD) pattern of the
nanowire products covering the substrate. The strong intensities and narrow widths of the peaks indicated that the substrate was well crystallised. The partial, enlarged, view (Fig. 1d) shows that the relatively
weak peaks can be matched to those of the α -Si3N4. Together with the EDS results, and considering the
crystallinity of the substrate and nanowires, it was expected that the as-formed nanowires were α -Si3N4.
The α -Si3N4 nanowires were further characterised using transmission electron microscopy (TEM).
The as-prepared nanowires were sonicated and suspended in ethanol, dispersed onto a TEM micro-grid
with a lace-like carbon film, and measured with TEM/HRTEM equipped with an EDS detector. A representative low-magnification TEM image of typical nanowires (Fig. 2a) shows that a single nanowire had a uniform diameter. High-resolution TEM (HRTEM) images (Fig. 2c,e) of the representative
α -Si3N4 nanowires show lattice fringes of a single crystal nanowire. The chemical composition of a single
Scientific Reports | 5:17250 | DOI: 10.1038/srep17250
2
www.nature.com/scientificreports/
Figure 2. Crystal structure and chemical composition of the nanowires. (a) Typical low-magnification
TEM image of the α -Si3N4 nanowires, showing its structural uniformity. (b) The corresponding EDS
spectrum recorded from the single nanowire. (c,e) High-magnification TEM images of single nanowires and
(d,f) their corresponding fast Fourier transform (FFT) pattern.
nanowire was analysed by EDS. As shown in Fig. 2b, the EDS spectrum revealed that the nanowire consisted of Si and N elements. The measured lattice spacings observed in HRTEM were 0.67 nm, 0.43 nm,
and 0.39 nm, corresponding well to the (100), (101), and (110) lattice spacings of the α -Si3N4 structure,
respectively. The 2-d fast Fourier transform (FFT) of the lattice resolved images (Fig. 2d,f) shows the
reciprocal lattice peaks, which can be indexed to a primitive hexagonal lattice. Indexed reciprocal lattices
observed showed that the nanowires closely matched the structure of α -Si3N4. The HRTEM image in
Fig. 2c shows an amorphous phase in the outer shell region. In this research, before the temperature was
increased, there were still unexpelled gases remaining in the reaction system (including oxygen). This
suggested that the amorphous shell may be formed during the high temperature nanowire synthesis
process, in which a trace amount of oxygen could be present in the simplified SLS set-up used here. It is
generally understood that surface oxidation of silicon-related products generates silicon oxide31. In this
research, this was further investigated by FT-IR and XPS.
Figure 3 shows the absorption FT-IR spectra of the α -Si3N4 nanowires. The broad spectrum was taken
over the range 450–1150 cm−1 with a step size of 1 cm−1. The bonding signatures of the as-prepared nanowires showed five distinguishing vibrational bands: the vibrational bands at 800–1100 cm−1 (846 cm−1,
885 cm−1, and 1038 cm−1) were derived from the Si-N stretching vibration mode of α -Si3N432. The
absorption peak at 460 cm−1 corresponded to Si-N stretching in β -Si3N433,34, suggesting that there may
be a little β -Si3N4 in the as-synthesised products. The peak at 493 cm−1 was due to the Si-O-Si stretching
vibration of amorphous SiOx35.
To confirm further the structure of these nanowires, XPS spectroscopy was used to verify the bonding
structure thereof. Figure 4 shows the core-level XPS spectra of the Si 2p, N 1s, and O 1s regions of the
α -Si3N4 nanowires synthesised by the improved, simplified SLS method. All of the signal curves were
fitted by the Gaussian method. A Shirley fitting procedure was used to determine the background to each
spectrum and a Gaussian-Lorentzian peak shape with a G/L ratio of 80 was adopted. Figure 4a shows
that the binding energy of the Si 2p core orbital spectra lay within the range 95–115 eV. The peak energy
associated with 102.3 eV corresponded to the Si-N bond, and the peak energy located at 103.7 eV was
Scientific Reports | 5:17250 | DOI: 10.1038/srep17250
3
www.nature.com/scientificreports/
Figure 3. FT-IR absorption spectrum of the as-prepared products.
attributed to the Si-O bond which is associated with the outer oxide layer22. The resolved component of
N 1s is shown in Fig. 4b. The peak at 397.9 eV corresponded to the binding energy of the N-Si bond36.
The binding energy at around 398.9 eV could be attributed to the N-H on the surface37. In addition to
Si 2p, and N 1s, the XPS spectra of O 1s are also measured as shown in Fig. 4c. From the XPS analysis,
the peaks located at 532.4 eV and 534.2 eV corresponded to the binding energy of O-Si and O-H bonds,
respectively38. The O 1s peak was related to the presence of SiOx and the O-H came from the surface
oxidation layer. The values of Si 2p, N 1s, and O 1s peaks were close to those for Si3N4 and SiOx, which
demonstrated that the chemical bonds of Si-N and Si-O had formed in the α -Si3N4 nanowires. Based on
the XRD, TEM, FT-IR, and XPS, results it could be concluded that the as-prepared nanowires consisted
mainly of α -Si3N4 wrapped with an amorphous SiOx shell.
In recent years, 1-d nanostructures are usually synthesised by vapour-solid (VS), vapour-liquid-solid
(VLS), or solid-liquid-solid (SLS) mechanisms, depending on the absence, or presence, of metal catalysts or gases in the preparation process. Among these methods, the SLS process seems to be an optimal
method for generating 1-d nanostructures at lower temperatures. Nanowires are conventionally assumed
to grow by SLS procedure, in which material arising from the solid is incorporated by a liquid catalyst,
commonly a low-melting point eutectic alloy39.
In order to investigate the growth mechanism of the α -Si3N4 nanowires, as shown in Fig. 5a, numbers
of nanowires products were also obtained when sintering at 1100 °C. The inset in Fig. 5a shows the EDS
spectrum recorded from the bottom of a single nanowire marked by the dotted rings. As can be seen, a
number of apparent catalytic base exist at the bottom of the nanowires: EDS analysis showed that the catalytic dots mainly contained Si, Ni, and N elements, which indicated that the presence of minute amounts
of Ni(NO3)2 was crucial to the formation of a large amount of such nanowires. It was believable that
nanowire growth stemmed from a SLS mechanism. On account of the eutectic point of NiSi2 is 993 °C
(which can be seen from the Si-Ni diagram)40, Si atoms diffused into Ni-Si alloy droplets continuously.
The N2 vapour phase diffused into the Ni-Si alloy particles, forming Ni-Si-N liquid droplets. Based on
the aforementioned processes, Si3N4 nuclei and nanowires were generated on the Si substrate when the
droplet reached supersaturation. Figure 5b shows the proposed growth process of the α -Si3N4 nanowires.
The trace amount of Ni (decomposed from Ni(NO3)2) provided initial nucleation sites for the formation
of Ni-Si-N liquid droplets.
To investigate the optical properties of the as-synthesised α -Si3N4 nanowires, their PL and CL spectra
were recorded at room temperature. Figure 6 shows the room temperature PL spectra of the α -Si3N4
nanowires. The excitation spectrum was taken over the range 200 to 400 nm, and was monitored at
417 nm (2.97 eV). The excitation signatures of the as-synthesised α -Si3N4 nanowires showed two distinct peaks centred around 254 nm (4.88 eV) and 369 nm (3.36 eV), respectively. Therefore, the emission
spectra were recorded under these two excitation wavelengths. The results showed that the PL intensity
excited at 254 nm (4.88 eV) was much higher than that excited at 369 nm (3.36 eV), and the peak position
was slightly red-shifted with decreasing excitation wavelength. Strong emission spectra were located in
the violet-blue spectral range, centred around 417 nm (2.97 eV) and 434 nm (2.86 eV), respectively, when
excited by light with wavelengths of 254 nm (4.88 eV) and 369 nm (3.36 eV). The two emission bands
were both considerably red-shifted, compared with the direct band gap of α -Si3N4 (5.2 to 5.3 eV)22,30.
These PL results were different from those in previous reports29,41. Robertson et al. define four types of
defects in Si3N4, including: Si-Si, N-N, = N0, and ≡ Si0 dangling bonds. As previously reported29,42, the
luminescence centred at approximately 417 nm (2.97 eV) should arise due to recombination, either from
the conduction band to the N20 level, or the valence band to the N4+ level. As proposed, an amorphous
Scientific Reports | 5:17250 | DOI: 10.1038/srep17250
4
www.nature.com/scientificreports/
Figure 4. XPS spectra of the as-synthesized α-Si3N4 nanowires: (a) Si 2p; (b) N 1s; (c) O 1s.
oxide layer existed on the surface of the α -Si3N4 nanowires, as determined by TEM/HRTEM, FT-IR, and
XPS. As previously reported, the emission bands centred around 434 nm (2.86 eV) could arise from the
electronic transitions from ≡ Si0 to N-Si-O29,30,43. Based on previous research, in the current results, when
excited by 254 nm (4.88 eV) wavelength light, we believed that the recombination from the conduction
band to the N20 level or the valence band to the N4+ level dominated the emission properties, together
with the electronic transitions from ≡ Si0 to N-Si-O. Nevertheless, the electronic transitions from ≡ Si0 to
N-Si-O dominated the emission properties when excited by light with a wavelength of 369 nm (3.36 eV).
To visualise the spatial distribution of the luminescence from these α -Si3N4 nanowires, the secondary electron (SE) image and corresponding CL image were recorded as shown in Fig. 7a–b. Figure 7c
Scientific Reports | 5:17250 | DOI: 10.1038/srep17250
5
www.nature.com/scientificreports/
Figure 5. (a) A typical FESEM image of the α -Si3N4 nanowires prepared at 1100 °C, the inset pattern is
the EDS spectrum recorded from the top of a single nanowire marked by the dotted rings. (b) Schematic
illustration for the growth of α -Si3N4 nanowires.
Figure 6. The excitation and emission spectra of α-Si3N4 nanowires. The excitation spectrum monitored
at 417 nm indicated two excitation peaks at 254 nm and 369 nm. The emission spectra were measured under
254 nm and 369 nm excitation, respectively.
Figure 7. (a–b) SE and CL images of the α -Si3N4 nanowires; (c) Room-temperature CL spectra of α -Si3N4
nanowires with a focused electron beam at an accelerating voltage of 30 kV.
Scientific Reports | 5:17250 | DOI: 10.1038/srep17250
6
www.nature.com/scientificreports/
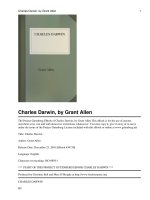
Figure 8. Schematic diagram of experimental setup for α-Si3N4 nanowires synthesis.
shows the room temperature CL spectrum of the products. As shown in Fig. 7c, the histogram is the
as-obtained spectrum, and the red and blue lines are simulated data plots. The nanowire spectra showed
two peaks at approximately 368 nm (3.37 eV) and 567 nm (2.19 eV). Previous studies suggested that the
optical properties of nanostructured materials can be affected by many factors, such as intrinsic characteristics, composition, shape and size of nanomaterial, structural defects, and impurities44,45. Hu et al.46
reported the CL spectrum of an α -Si3N4 microribbon, which consists of one intense UV emission peak
at approximately 305 nm (4.06 eV) and two weak broad peaks at around 540 nm (2.30 eV) and 735 nm
(1.68 eV). They considered the 305 nm peak as being due to recombination, either from the conduction
band to the N20 level, or from the valance band to the N4+ level: the 540 nm peak is attributed to a recombination process at the silicon dangling bond, and the 735 nm peak is caused by recombination between
the N4+ and N20 levels46. Huang et al.47 synthesised α -Si3N4 nanobelts, nanowires, and nanobranches and
compared the CL properties of these three nanostructures. They propose that the UV-blue emissions of
their α -Si3N4 nanobelt, nanowire, and nanobranch centred with a band from 3.05 eV to 3.34 eV should
arise from a recombination between the Si-Si σ * level and the N20, and N20, levels, or between the N4+
and intrinsic valence band edge47.
In this research, under an accelerating voltage of 30 kV, the electrons could be injected to a depth of
hundreds of nanometres, or even several microns, into the samples. This may have caused a different
dominant luminescence mechanism between PL and CL measurements. The CL emission of the α -Si3N4
nanowires centred at approximately 368 nm (3.37 eV) should arise from a recombination between the
Si-Si σ * level and the N20 level47. The peak at approximately 567 nm (2.19 eV) was ascribed to the recombination process at the silicon dangling bond46. From the PL and CL results, it can be concluded that the
luminescence property of the α -Si3N4 nanowires can be changed along with the excitation wavelength or
the excitation light source. The changeable emission properties of the α -Si3N4 nanowires synthesised by
our simplified SLS method are of significant interest for their potential application in new photoelectric
nanodevices.
Conclusions
Ultra-long, single-crystal, α -Si3N4 nanowires have been obtained by using an improved, simplified,
solid-liquid-solid method at 1150 °C. The as-synthesised nanowires were up to several hundred microns
in length. Furthermore, the resulting α -Si3N4 nanowires were structurally characterised and found to
have Si3N4@SiOx core-shell nanostructures with a single crystal Si3N4 core and an insulating amorphous
silicon oxide shell. The formation process was considered to be dominated by a solid-liquid-solid mechanism. The room temperature photoluminescence and cathodoluminescence spectra indicated that the
luminescence of the α -Si3N4 nanowires could be changed along with the excitation wavelength or the
excitation light source. The data presented here could also be helpful in simplifying the design and
synthesis of Si-related nanostructures. Furthermore, the changeable luminescence properties can also be
applied to new generation nanodevices with tunable photoelectronic properties.
Methods
Si3N4 nanowires were prepared, with high reproducibility, by a SLS process, without using flowing gases
(N2, CH4, Ar, NH3, etc.). The simple experimental set-up consisted of a horizontal high-temperature tube
furnace and two aluminium alloy crucibles (as shown in Fig. 8). First, an n-type Si (100) wafer (4 Ω ·cm,
Beijing Zhongkekenuo New Energy Technology Co. Ltd, China) was ultrasonically cleaned in acetone
and ethanol for 10 minutes in each solvent, and then dried in air. The cleaned substrate was dipped into
0.01 m nickel nitrate (Ni(NO3)2) aqueous solution and dried at room temperature. After that, the silicon
substrate was loaded into an aluminium alloy boat, and covered by another smaller aluminium alloy
boat (25 mL). Then, a corundum boat was filled with metallic silicon powder and covered by a matching
corundum lid. Therefore, the Si (100) wafer with its Ni(NO3)2 catalyst was separated with another Si
source (metallic silicon powder). The aforementioned enclosed system was then placed in a furnace and
heated in air. The furnace temperature was increased at 10 °C/min from room temperature to 1000 °C,
and then increased at 3 °C/min from 1000 °C to 1150 °C, then held at that temperature for 3 h. After
Scientific Reports | 5:17250 | DOI: 10.1038/srep17250
7
www.nature.com/scientificreports/
cooling to room temperature, a white layer was formed on the surface of the Si substrate. It was worth
noting that the metallic silicon powder could be recycled and reused.
The copious amount of nanowires thus produced allowed the identification of phases in the product
samples using powder X-ray diffraction (XRD). The morphology and microstructure of the as-grown
nanowires were characterised using a variety of microscopes and energy dispersive X-ray spectroscopy (EDS), field emission scanning electron microscopy (FESEM, JEOL JSM6700F, Japan) at 20 kV,
and high-resolution transmission electron microscopy (TEM/HRTEM, FEI-Tecnai-G3-F20, Philips,
Netherlands) at 300 kV. A standard KBr pellet technique was used for further Fourier-transform infrared
spectroscopy (FT-IR) examination. The FT-IR spectrum was collected with a Nicolet IR100/200 spectrophotometer over the wavenumber range of 450–1150 cm−1. X-ray photoelectron spectroscopy (XPS,
ESCALAB 250Xi, Michigan, USA) measurements were performed using an aluminium Kα micro-focused
monochromator with a spot size of 500 μ m. Total scans of all the core levels (Si(2p), N(1s), and O(1s))
with kinetic energy measurement were realised in 0.05 eV increments. To investigate the optical properties of the as-prepared α -Si3N4 nanowires, their photoluminescence (PL) and cathodoluminescence (CL)
spectra were recorded at room temperature. A fluorescence spectrophotometer (Hitachi F4600, Japan)
with a Xe lamp excitation source was used to record the room temperature PL spectra. A high-resolution
CL system (an ultra-high vacuum scanning electron microscope (UHV-SEM), equipped with a Gemini
electron gun (Omicron, Germany) and a CL detector (Gatan mono 3 plus)) at an accelerating voltage of
30 kV was used to collect the CL spectra. The CL images and spectra were collected at room temperature.
References
1. Xia, Y. et al. One-dimensional nanostructures: synthesis, characterization, and applications. Adv. Mater. 15, 353–389 (2003).
2. Chen J. et al. One-dimensional nanostructures of metals: large-scale synthesis and some potential applications. Langmuir, 23,
4120–4129 (2007).
3. Kuchibhatla, S. V., Karakoti, A., Bera, D. & Seal, S. One dimensional nanostructured materials. Prog. Mater. Sci., 52, 699–913
(2007).
4. Bahloul-Hourlier, D. & Perrot, P. Thermodynamics of the Au-Si-O system: Application to the synthesis and growth of siliconsilicon dioxide nanowires. J. Phase Equilib. Diff. 28, 150–157(2007).
5. Li J. et al. Effect of nanowire number, diameter, and doping density on nano-FET biosensor sensitivity. ACS nano, 5, 6661–6668
(2011).
6. Cheng G. et al. Mechanical properties of silicon carbide nanowires: effect of size-dependent defect density. Nano lett. 14, 754–758
(2014).
7. Wang Z. -L. Nanogenerators for self-powered devices and systems. Ch. 1, 1–5 (SMARTech digital repository, Georgia Institute
of Technology: Atlanta, GA, 2011).
8. Iijima S. Helical microtubules of graphitic carbon. Nature 354, 56–58 (1991).
9. Iijima, S. & Ichihashi, T. Single-shell carbon nanotubes of 1-nm diameter. Nature 363, 603–605 (1993).
10. Korte, K. E., Skrabalak, S. E. & Xia, Y. Rapid synthesis of silver nanowires through a CuCl-or CuCl2-mediated polyol process.
J. Mater. Chem. 18, 437–441 (2008).
11. Gao T. et al. Template synthesis of single-crystal Cu nanowire arrays by electrodeposition. Appl. Phys. A, 73, 251–254 (2001).
12. Hochbaum, A. I., Fan, R., He, R. & Yang, P. Controlled growth of Si nanowire arrays for device integration. Nano lett. 5, 457–460
(2005).
13. Hannon, J., Kodambaka, S., Ross, F. & Tromp, R. The influence of the surface migration of gold on the growth of silicon
nanowires. Nature, 440, 69–71 (2006).
14. Liu H. et al. Thermal evaporation synthesis of SiC/SiOx nanochain heterojunctions and their photoluminescence properties.
J. Mater. Chem. C, 2, 7761–7767 (2014).
15. Wang F. et al. Synthesis and characterization of Si3N4 thin nanobelts via direct nitridation of Si powders. Physica E, 41, 120–123
(2008).
16. Wang Z. Zinc oxide nanostructures: growth, properties and applications. J. Phys-Condens. Mat. 16, R829 (2004).
17. Gao P. et al. Conversion of zinc oxide nanobelts into superlattice-structured nanohelices. Science 309, 700–1704 (2005).
18. Yang W. et al. Growth of platelike and branched single-crystalline Si3N4 whiskers. Solid State Commun. 132, 263–268 (2004).
19. Xu Y. et al. Synthesis and photoluminescence of belt-shaped Si3N4 whiskers. Mater. Lett. 61, 3855–3858 (2007).
20. Wang H. et al. Morphology instability of silicon nitride nanowires. J. Phys. Chem. C, 113, 5902–5905 (2009).
21. Xu F. et al. A growth mechanism for 1D nanocrystals: pseudoscrew packing of polyhedral growth units. Cryst. Growth Des. 8,
2574–2580 (2008).
22. Lin L. et al. Synthesis and optical property of ultra-long alpha-Si3N4 nanowires under superatmospheric pressure conditions.
CrystEngComm 14, 3250–3256 (2012).
23. Wang X. et al. Metal catalysis-free, direction-controlled planar growth of single-crystalline α -Si3N4 nanowires on Si (100)
substrate. Nanotechnology, 17, 3989 (2006).
24. Chen Y. et al. High-density silicon and silicon nitride cones. J. Cryst. Growth, 210, 527–531 (2000).
25. Cui H. et al. Nucleation and growth of silicon nitride nanoneedles using microwave plasma heating. J. Mater. Res. 16, 3111–3115
(2001).
26. Yang W. et al. Ultra-long single-crystalline α -Si3N4 nanowires: derived from a polymeric precursor. J. Am. Ceram. Soc. 88,
1647–1650 (2005).
27. Wang F. et al. Sol-gel synthesis of Si3N4 nanowires and nanotubes. Mater. Lett. 60, 330–333 (2006).
28. Zheng C. et al. In situ preparation of SiC/Si3N4 NW composite powders by combustion synthesis. Ceram. Int. 38, 487–493 (2012).
29. Huang J. et al. Catalyst-assisted synthesis and growth mechanism of ultra-long single crystal α -Si3N4 nanobelts with strong
violet–blue luminescent properties. CrystEngComm, 14, 7301–7305 (2012).
30. Huo K. et al. Synthesis of single-crystalline α -Si3N4 nanobelts by extended vapour–liquid–solid growth. Nanotechnology, 16, 2282
(2005).
31. Song Y. et al. Ultralong single-crystal metallic Ni2Si nanowires with low resistivity. Nano lett., 7, 965–969 (2007).
32. Wada, N., Solin, S., Wong, J. & Prochazka, S. Raman and IR absorption spectroscopic studies on α , β , and amorphous Si3N4.
J. Non-Cryst. Solids, 43, 7–15 (1981).
33. Diniz, J., Tatsch, P. & Pudenzi, M. Oxynitride films formed by low energy NO+ implantation into silicon. Appl. Phys. Lett., 69,
2214–2215 (1996).
Scientific Reports | 5:17250 | DOI: 10.1038/srep17250
8
www.nature.com/scientificreports/
34. Swain, B. S., Swain, B. P., Lee, S. S. & Hwang, N. M. Morphology and structural change in ammonia annealed core shell silicon
nanowires. J. Phys. Chem. C, 115, 16745–16752 (2011).
35. Li Z. et al. Large-scale synthesis and raman and photoluminescence properties of single crystalline β -SiC nanowires periodically
wrapped by amorphous SiO2 nanospheres. J. Phys. Chem. C 113, 91–96 (2008).
36. Taylor J. A. Further examination of the Si KLL Auger line in silicon nitride thin films. Applications of Surface Science 7, 168–184
(1981).
37. Larkins, F. & Lubenfeld, A. The Auger spectrum of solid ammonia. J. Electron. Spectrosc. Relat. Phenom. 15, 137–144 (1979).
38. Kishi, K. & Ikeda, S. X-ray photoelectron spectroscopic study for the reaction of evaporated iron with O2 and H2O. B. Chem.
Soc. Jpn. 46, 341–345 (1973).
39. Yan H. et al. Growth of amorphous silicon nanowires via a solid-liquid-solid mechanism. Chem. Phys. Lett. 323, 224–228 (2000).
40. Yu D. et al. Controlled growth of oriented amorphous silicon nanowires via a solid-liquid-solid (SLS) mechanism. Physica E, 9,
305–309 (2001).
41. Huang J. et al. Growth of α -Si3N4 nanobelts via Ni-catalyzed thermal chemical vapour deposition and their violet-blue
luminescent properties. CrystEngComm 15, 785–790 (2013).
42. Deshpand, E., Sadandand, V., Gulari, E., Brown, S. & Rand, S. Optical properties of silicon nitride films deposited by hot filament
chemical vapor deposition. J. Appl. Phys., 77, 6534–6541 (1995).
43. Liu Y. et al. Study of photoluminescence spectra of Si-rich SiNx films. Mater. Lett. 58, 2397–2400 (2004).
44. Gautam U. K. et al. Solvothermal synthesis, cathodoluminescence, and field-emission properties of pure and N-doped ZnO
nanobullets. Adv. Funct. Mater. 19, 131–140 (2009).
45. Zhai T. et al. Characterization, cathodoluminescence, and field-emission properties of morphology-tunable CdS micro/
nanostructures. Adv. Funct. Mater. 19, 2423–2430 (2009).
46. Hu J. et al. Two-dimensional extremely thin single-crystallinea-Si3N4 microribbons. Appl. Phys. Lett. 84, 804–806 (2004).
47. Huang J. et al. Fe-catalyzed growth of one-dimensional α -Si3N4 nanostructures and their cathodoluminescence properties.
Sci. Rep-UK 3, 3504–3512 (2013).
Acknowledgements
This work was supported by the National Natural Science Foundation of China (Grant No. 51032007,
51472222 and 51372232), the Research Fund for the Doctoral Program of Higher Education of China
(Grant No. 20130022110006) and the the Fundamental Research Funds for the Central Universities
(Grant No. 2652015024 and 2652015310). We thank Mr. Bin Ma and Miss Ling Zhu for their help to
this experiment.
Author Contributions
H.T.L., Z.H.H. and M.H.F. conceived and designed the experiments. H.T.L. carried out the experiments.
H.T.L., M.H.F., Y.G.L., X.W.W., X.Z.H. and S.W.Z. analyzed the data. All authors discussed the results.
J.T.H. improved the English language.
Additional Information
Competing financial interests: The authors declare no competing financial interests.
How to cite this article: Liu, H. et al. Novel, low-cost solid-liquid-solid process for the synthesis of
α-Si3N4 nanowires at lower temperatures and their luminescence properties. Sci. Rep. 5, 17250; doi:
10.1038/srep17250 (2015).
This work is licensed under a Creative Commons Attribution 4.0 International License. The
images or other third party material in this article are included in the article’s Creative Commons license, unless indicated otherwise in the credit line; if the material is not included under the
Creative Commons license, users will need to obtain permission from the license holder to reproduce
the material. To view a copy of this license, visit />
Scientific Reports | 5:17250 | DOI: 10.1038/srep17250
9