prevalence and risk factors for cardiovascular disease among chronic kidney disease patients results from the chinese cohort study of chronic kidney disease c stride
Bạn đang xem bản rút gọn của tài liệu. Xem và tải ngay bản đầy đủ của tài liệu tại đây (637.73 KB, 12 trang )
Yuan et al. BMC Nephrology (2017) 18:23
DOI 10.1186/s12882-017-0441-9
RESEARCH ARTICLE
Open Access
Prevalence and risk factors for
cardiovascular disease among chronic
kidney disease patients: results from the
Chinese cohort study of chronic kidney
disease (C-STRIDE)
Jun Yuan1,2, Xin-Rong Zou2, Si-Ping Han2, Hong Cheng2, Lan Wang1, Jin-Wei Wang3,4,5, Lu-Xia Zhang3,4,5,
Ming-Hui Zhao3,4,5, Xiao-Qin Wang2*, on behalf of the C-STRIDE study group
Abstract
Background: Although a high incidence of cardiovascular disease (CVD) is observed among chronic kidney disease
(CKD) patients in developed countries, limited information is available about CVD prevalence and risk factors in the
Chinese CKD population. The Chinese Cohort of Chronic Kidney Disease (C-STRIDE) was established to investigate
the prevalence and risk factors of CVD among Chinese CKD patients.
Methods: Participants with stage 1–4 CKD (18–74 years of age) were recruited at 39 clinical centers located in 28
cities from 22 provinces of China. At entry, the socio-demographic status, medical history, anthropometric
measurements and lifestyle behaviors were documented, and blood and urine samples were collected. Estimated
glomerular filtration rate (eGFR) was calculated by the CKD-EPI creatinine equation. CVD diagnosis was based on
patient self-report and review of medical records by trained staff. A multivariable logistic regression model was
used to estimate the association between risk factors and CVD.
Results: Three thousand four hundred fifty-nine Chinese patients with pre-stage 5 CKD were enrolled, and 3168
finished all required examinations and were included in the study. In total, 40.8% of the cohort was female, with a
mean age of 48.21 ± 13.70 years. The prevalence of CVD was 9.8%, and in 69.1% of the CVD cases cerebrovascular
disease was observed. Multivariable analysis showed that increasing age, lower eGFR, presence of hypertension,
abdominal aorta calcification and diabetes were associated with comorbid CVD among CKD patients. The odds
ratios and 95% confidence intervals for these risk factors were 3.78 (2.55–5.59) for age 45–64 years and 6.07 (3.89–9.
47) for age ≥65 years compared with age <45 years; 2.07 (1.28–3.34) for CKD stage 3a, 1.66 (1.00–2.62) for stage 3b,
and 2.74 (1.72–4.36) for stage 4 compared with stages 1 and 2; 2.57 (1.50–4.41) for hypertension, 1.82 (1.23–2.70) for
abdominal aorta calcification, and 1.70 (1.30–2.23) for diabetes, respectively.
Conclusions: We reported the CVD prevalence among a CKD patient cohort and found age, hypertension,
diabetes, abdominal aorta calcification and lower eGFR were independently associated with higher CVD prevalence.
Prospective follow-up and longitudinal evaluations of CVD risk among CKD patients are warranted.
Keywords: Cardiovascular Disease, Cerebrovascular Disease, Chronic Kidney Disease, Cohort Study, C-STRIDE,
Epidemiology, Hypertension, Risk Factors
* Correspondence:
2
Renal Division, Department of Medicine, Hubei Provincial Hospital of
Traditional Chinese Medicine, The Affiliated Hospital of Hubei University of
Chinese Medicine, Wuhan 430061, China
Full list of author information is available at the end of the article
© The Author(s). 2017 Open Access This article is distributed under the terms of the Creative Commons Attribution 4.0
International License ( which permits unrestricted use, distribution, and
reproduction in any medium, provided you give appropriate credit to the original author(s) and the source, provide a link to
the Creative Commons license, and indicate if changes were made. The Creative Commons Public Domain Dedication waiver
( applies to the data made available in this article, unless otherwise stated.
Yuan et al. BMC Nephrology (2017) 18:23
Background
The prevalence of chronic kidney disease (CKD) has
increased dramatically in economically developed
countries as well as in developing countries. It is
estimated that CKD has affected more than 100
million Chinese [1]. Many studies have showed a high
incidence of cardiovascular disease (CVD) among CKD
patients. The prevalence of CVD in CKD was 26.8%,
33.4%, 47.2%, and 39.1%, in CKD-ROUTE (Japan), CRIC
(US), CRISIS (UK) and MERENA (Spain), respectively
[2–5]. The mortality rate of end-stage renal disease
(ESRD) was above 20% per year despite the use of
dialysis, and more than half of the death was related
to CVD [6]. Lower estimated glomerular filtration
rate (eGFR) has been recognized as a strong and independent risk factor for CVD [7]. Other predictive
factors contributing to higher prevalence of CVD in
CKD, including hypertension, diabetes mellitus (DM),
dyslipidemia, anemia (hemoglobin < 110 g/L), and albuminuria, have also been investigated substantively
in epidemiological studies [2–5]. Thus, early detection
and treatment of these risk factors is a key strategy in
the prevention of CVD in CKD. However, little is
known about the prevalence and risk factors for CVD
among the Chinese population with established CKD
whose genetic and economic heterogeneities are different from those in developed countries.
Therefore, we have established the Chinese cohort
study of chronic kidney disease (C-STRIDE), the first national prospective CKD cohort of Chinese population. It
was designed to explore risk factors for CKD progression
and adverse consequences, especially CVD events. The
purpose of the current study is to examine the baseline
characteristics of this cohort and to identify risk factors
for CVD in CKD patients.
Methods
The design and methods of the C-STRIDE study were
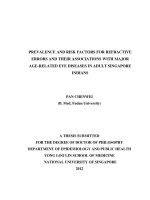
published in details previously [8]. The study is an ongoing multicenter prospective project involving 39 clinical centers located at 28 cities in 22 provinces of China
(Fig. 1). The enrollment was carried out between November 2011 and March 2016. Altogether, 3459 Chinese
patients with pre-stage 5 CKD were enrolled, and 3168
of them finished all required examinations and are included in the study.
The Renal Institute of Peking University organized the
C-STRIDE study and established a steering committee
consisting of nephrologists, epidemiologists and statisticians to provide training course for the research staff
who performed the clinical procedures. A manual of
operation procedure (MOP) was drawn up to ensure all
aspects of the study were carried out in a standard and
uniform manner.
Page 2 of 12
CKD stages were determined by the KDIGO classification [9]. eGFR was determined with the CKD-EPI creatinine equation using serum creatinine (SCr) measured
by the Roche enzymatic method [10]. For GN patients,
the eGFR should be ≥15 ml/min/1.73 m2. For DN
patients, the defining eligibility is 15 ml/min/1.73 m2 ≤
eGFR < 60 ml/min/1.73 m2 or eGFR ≥ 60 ml/min/
1.73 m2 with “nephrotic range” proteinuria, defined as
24-h urinary protein ≥3.5 g or urinary albumin creatinine ratio (UACR) ≥2 000 mg/g. For non-GN and nonDN patients, 15 ml/min/1.73 m2 ≤ eGFR < 60 ml/min/
1.73 m2 was the cutoff for enrollment.
Clinical information and biological specimens for each
patient were collected at entry. Their socio-demographic
status (age, gender, income, region, education), etiology
of kidney disease, health history (hypertension, diabetes,
and cardiovascular disease), lifestyle (smoking, exercise)
and body mass index (BMI) were documented.
Anthropometric measurements (weight, height, waist circumference, hip circumference, resting blood pressure,
heart rate) were recorded. Electrocardiogram, abdominal
aorta calcification (AAC) and 24-h urine protein were
determined with standardized procedures at all centers.
Biochemical parameters including SCr, calcium, phosphorus, hemoglobin (Hb), fasting glucose, hemoglobin
A1C (HbA1c), triglyceride (TG), total cholesterol (TC),
high density lipoprotein cholesterol (HDL-C), low density
lipoprotein cholesterol (LDL-C), intact parathyroid
hormone (iPTH) and high-sensitivity C-reactive protein
(hs-CRP) were measured in a central laboratory to avoid
testing variations among laboratories.
Definition of hypertension, diabetes, and cardiovascular
disease events
Hypertension at entry was defined as either systolic
blood pressure >140 mmHg, or diastolic blood pressure
>90 mmHg (confirmed by at least three elevated
readings taken at least 1 week apart), or use of antihypertensive medications, or any self-reported history of
hypertension. In addition, 24-hour ambulatory blood
pressure was measured for every participant. Diabetes
mellitus was defined as either a fasting glucose
≧7.0 mmol/L, or HbA1c ≧ 6.5%, or use of insulin or oral
anti-diabetic medications, or any self-reported history of
diabetes. CVD was defined as a history of myocardial
infarction, hospitalization for congestive heart failure,
serious cardiac arrhythmia incidents (resuscitated cardiac arrest, ventricular fibrillation, sustained ventricular
tachycardia, paroxysmal ventricular tachycardia, atrial
fibrillation or flutter, severe bradycardia or heart block),
peripheral arterial disease (PAD), or cerebrovascular
events (cerebral infarction, transient ischemic attack,
cerebral hemorrhage or subarachnoid hemorrhage).
Reporting of CVD was based on both the patients’ self-
Yuan et al. BMC Nephrology (2017) 18:23
Page 3 of 12
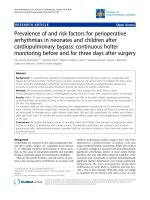
Fig. 1 The distribution of the 39 clinical sites of the C-STRIDE Study and population size of each province in China in 2013. a The distribution of
the clinical sites in China. The hollow triangles represent for the clinical sites in China. b The population size of each province in China in 2013
report and review of their medical records by trained
staff on the same date of the baseline interview.
Statistical analysis
The statistical analysis for C-STRIDE has been previously described [8]. Baseline values are presented as
mean ± standard deviation (SD) or medians and interquartile ranges for continuous variables, and as numbers
and percentages for categorical data. Baseline characteristics were compared between groups using analysis of
variance (ANOVA), or chi-square tests, as appropriate. If
the distribution of the continuous variable did not satisfy
normal distribution, the Kruskal-Wallis rank sum test
was used. The cardiovascular risk factors were analyzed
with covariates with multivariable logistic regression
models. The crude and multivariable adjusted odds
ratios (aOR) with 95% confidence interval (CI) are presented. Covariates included in the multivariable logistic
regression models were gender, age (18–44 (as reference)
vs 45–64 vs 65–74), smoking history (yes or no), exercises more than 3.5 h per week (yes or no), hypertension
(yes or no), SBP > 130 mmHg (yes or no), diabetes (yes
or no), BMI≧24.0 kg/m2 (yes or no), CKD stages (stage
1–2 (as reference) vs 3a vs 3b vs 4), Hb < 11 g/dl (yes or
no), serum calcium <8.4 mg/dl (yes or no), serum phosphorus > 4.5 mg/dl (yes or no), iPTH > 65 pg/ml (yes or
no), LDL-C > 120 mg/dl (yes or no), HDL-C < 35 mg/dl
(yes or no), TG > 150 mg/dl (yes or no), AAC (yes or
no).
All P values are two-sided, and P < 0.05 was considered statistically significant. Analyses were conducted
with SAS software (version 9.4).
Yuan et al. BMC Nephrology (2017) 18:23
Page 4 of 12
Results
Baseline demographic and clinical characteristics
Anticipated and actual target distributions of CKD etiology and renal function are shown in Additional file 1:
Table S1. The actual percentage of participants with
glomerulonephritis (GN) was 60.6%, two times higher
than the targeted 30%. The percentages of diabetic nephropathy (DN) and other causes were 13.9% and 25.6%,
much lower than the anticipated 30% and 40%, respectively. Other causes include hypertensive renal damage,
chronic pyelonephritis, hyperuricemic nephropathy,
tubulointerstitial lesion and obstructive nephropathy.
The proportions of participants with eGFR (ml/min/
1.73 m2) < 45 and ≥45 were 53.5% and 46.5%, consistent
with the target of 40–60%. The proportions of participants in CKD stage 1 and 2, stage 3a, stage 3b and stage
4 were 30.8%, 15.7%, 24.3%, and 29.3%, respectively.
The baseline demographic characteristics of the cohort
are shown in Table 1. The final enrolled cohort had a
mean age of 48.21 ± 13.7 years with 40.8% of women.
Totally, 56.0% of the enrollments completed a high
school education, and 36.1% had annual income ≦RMB
30,000 Yuan. The 2015 per capita disposable income of
urban residents in China is RMB 31,195 Yuan “(http://
www.stats.gov.cn/tjsj/zxfb/201602/t20160229_1323991.h
tml)”. The cohort is regionally diverse with 916 (28.9%)
subjects from south of Yellow River and 2252 (71.1%)
patients from the north. Mean BMI was 24.47 kg/m2,
with 53.4% of all participants having a BMI ≧24 kg/m2.
38.2% of the cohort participants were current smokers,
and almost half of the participants exercised less than
3.5 h per week. Table 1 indicated that the CKD participants with CVD were more likely to be older, male, from
the north, current smokers, and higher BMI than those
without CVD (P < 0.005).
Baseline CVD prevalence in different stages of CKD
The baseline CVD prevalence in different stage of CKD is
shown in Table 2. The overall CVD prevalence of the cohort was 9.8%, in which the percentages of MI, CHF, cerebrovascular disease and PAD were 20.6%,9.0%,69.1% and
16.1%, respectively. The prevalence of cerebrovascular
Table 1 Baseline demographic characteristics of participants of C-STRIDE Study (Nov 2011–Mar 2016)
Variable
P
CVD
Total
Yes
No
(n = 3168)
(n = 311)
(n = 2857)
48.21 ± 13.70
58.59 ± 10.51
47.08 ± 13.53
Male
1876 (59.22)
215 (69.13)
1661 (58.14)
Female
1292 (40.78)
96 (30.87)
1196 (41.86)
Age (yr)
Gender
<0.001
<0.001
139
≤ 30 000 yuan
1092 (36.05)
119 (39.53)
973 (35.67)
> 30 000 yuan
1937 (63.95)
182 (60.47)
1755 (64.33)
Junior high school degree or below
1384 (43.99)
150 (48.39)
1234 (43.51)
High school degree or above
1762 (56.01)
160 (51.61)
1602 (56.49)
Educational attainment
0.18
22
Region
0.10
0
South
916 (28.91)
60 (19.29)
856 (29.96)
North
2252 (71.09)
251 (80.71)
2001 (70.04)
BMI (kg/m2)
24.47 ± 3.63
25.04 ± 3.35
24.41 ± 3.65
BMI category (kg/m2)
<0.001
242
<0.001
242
< 24
1364 (46.62)
96 (35.29)
1268 (47.78)
≥ 24
1562 (53.38)
176 (64.71)
1386 (52.22)
1185 (38.15)
156 (50.98)
1029 (36.75)
1239 (51.41)
124 (52.99)
1115 (51.24)
< 3.5
1171 (48.59)
110 (47.01)
1061 (48.76)
eGFR (ml/min/1.73 m2)
50.72 ± 30.03
36.71 ± 18.87
52.25 ± 30.62
Tobacco use
<0.001
62
Exercise (hours/week)
≥ 3.5
0
0
Annual income
Yes
Missing
value
<0.001
758
0.61
0
Continuous variables are presented as mean ± SD. Categorical data are presented as numbers (n) of patients and percentages. BMI body mass index
<0.001
Yuan et al. BMC Nephrology (2017) 18:23
Page 5 of 12
Table 2 Baseline prevalence rate of CVD in different stages of CKD in C-STRIDE Study (Nov 2011–Mar 2016)
eGFR (ml/min/1.73 m2)
Variable
Total
>60
45–60
30–45
15–30
P for
trend
(n = 3168)
(n = 975)
(n = 497)
(n = 769)
(n = 927)
MI
64 (20.58)
6 (0.62)
9 (1.81)
22 (2.86)
27 (2.91)
CHF
28 (9.00)
3 (0.31)
5 (1.01)
9 (1.17)
11 (1.19)
0.14
Cerebrovascular disease
215 (69.13)
22 (2.26)
44 (8.85)
58 (7.54)
91 (9.82)
<0.001
<0.001
PAD
50 (10.08)
3 (0.31)
8 (1.61)
13 (1.69)
26 (2.81)
Total CVD
311 (9.82)
31 (3.18)
59 (11.87)
86 (11.18)
135 (14.56)
0.001
Categorical data are presented as numbers (n) of patients and percentages. MI myocardial infarction, CHF congestive heart failure, PAD peripheral arterial disease
events was significantly higher than that of other cardiovascular events. The participants with advanced CKD
were more likely to have CVD. The prevalence of MI increased with declining eGFR, with percentage of 0.6, 1.8,
2.9, 2.9%, respectively (P for trend = 0.001). The same pattern was observed with cerebrovascular disease (P for
trend < 0.001) and PAD (P for trend = 0.001). The proportions of MI, cerebrovascular disease and PAD were significant higher in CKD stages 3b and 4 (eGFR < 45 ml/min/
1.73 m2) (P < 0.001). The proportion of CHF presented a
gradual increment with CKD progression, but no significant difference was observed through eGFR groups (P for
trend = 0.14).
C and HDL-C were also different with and without CVD
(P < 0.05). However, no significant difference was observed in DBP (P = 0.83) or TG (P = 0.72).
Lower lipid levels were observed in the CVD-CKD
population compared to the non-CVD CKD population
(P < 0.001). The CVD population likely attracts more attention for hyperlipidemia and receives prescription
medications for lowering lipid levels, whereas the nonCVD population is less likely to receive treatment. This
is confirmed by our finding that the proportion of statin
treatment was 37.9% in the CVD patients versus 17.0%
in the non-CVD patients.
Non-traditional CVD risk factors
Traditional CVD risk factors
Table 3 shows the baseline characteristics of the traditional risk factors for CVD. Comparisons between patients with and without CVD are presented. The
participants with CVD were more likely to have hypertension and diabetes (P < 0.001). SBP, blood glucose and
HbA1C were significantly higher in CKD participants
with CVD than without CVD (P < 0.001). The TC, LDL-
Table 4 shows the baseline characteristics of nontraditional risk factors for CVD. The participants with
CVD had higher SCr than those without CVD (P < 0.001).
iPTH and abdominal aorta calcification were significantly
different with and without CVD as well (P < 0.001). Significant difference was also found in hemoglobin and HsCRP (P < 0.05). There were no significant differences in
UTP/24 h, serum calcium and phosphorus.
Table 3 Baseline characteristics of traditional risk factors characteristics for CVD in C-STRIDE Study (Nov 2011–Mar 2016)
Variable
Hypertension
P
CVD
Total
Yes
No
(n = 3168)
(n = 311)
(n = 2857)
2106 (77.80)
232 (93.55)
1874 (76.21)
Missing
value
461
<0.001
SBP (mmHg)
129.29 ± 17.51
134.71 ± 17.25
128.74 ± 17.44
342
<0.001
DBP (mmHg)
80.93 ± 11.65
80.48 ± 10.98
80.98 ± 11.71
342
0.83
Diabetes
697 (22.27)
135 (43.41)
562 (19.94)
38
<0.001
Blood glucose (mg/dl)
94.32 ± 28.62
103.86 ± 30.78
93.24 ± 27
221
<0.001
G-Hb (%)
5.92 ± 1.24
6.58 ± 1.56
5.84 ± 1.17
1625
<0.001
TC (mg/dl)
231.63 ± 496.52
194.51 ± 95.90
235.89 ± 522.81
192
0.02
LDL-C (mg/dl)
108.66 ± 103.64
99.38 ± 39.06
109.82 ± 108.66
242
0.002
HDL-C (mg/dl)
44.86 ± 43.70
41.38 ± 13.92
45.24 ± 46.02
241
0.001
TG (mg/dl)
255.90 ± 1125.41
193.03 ± 128.39
262.98 ± 1185.9
193
0.72
Continuous variables are presented as mean ± SD. Categorical data are presented as numbers (n) of patients and percentages. SBP systolic blood pressure, DBP
diastolic blood pressure, G-Hb glycosylated hemoglobin, TC total cholesterol, LDL-C low density lipoprotein cholesterol, HDL-C high density lipoprotein cholesterol,
TG triglycerides
Yuan et al. BMC Nephrology (2017) 18:23
Page 6 of 12
Table 4 Baseline characteristics of non-traditional risk factors characteristics for CVD in C-STRIDE Study (Nov 2011–Mar 2016)
Variable
CVD
Total
Yes
No
Missing
value
P
(n = 3168)
(n = 311)
(n = 2857)
eGFR (ml/min/1.73 m2)
50.72 ± 30.03
36.71 ± 18.87
52.25 ± 30.62
0
<0.001
Urine protein/24 h (g)
0.94 (0.34,2.30)
1.04 (0.24,2.84)
0.93 (0.35,2.26)
438
0.53
Serum calcium (mg/dl)
8.92 ± 0.76
9.00 ± 0.76
8.92 ± 0.76
160
0.34
Serum phosphorus (mg/dl)
3.66 (3.22,4.12)
3.66 (3.22,4.19)
3.66 (3.22,4.12)
163
0.55
Total iPTH (pg/mL)
46.66 (29.6,74.61)
55.85 (37.66,91.32)
45.79 (28.83,71.94)
578
<0.001
AAC (n)
2.62 ± 4.02
3.51 ± 4.25
2.52 ± 3.98
0
<0.001
Hemoglobin (g/dl)
12.76 ± 2.26
12.38 ± 2.16
12.80 ± 2.27
268
0.002
Hs-CRP (mg/L)
1.32 (0.53,3.20)
1.71 (0.64,4.46)
1.28 (0.51,3.10)
504
0.004
Continuous variables are presented as mean ± SD, or median with interquartile ranges. Categorical data are presented as numbers (n) of patients. SCr serum
creatinine, AAC abdominal aorta calcification, hs-CRP high-sensitivity C-reactive protein
Overall CVD risk factors
The results of multiple logistic regression analysis of the
traditional and non-traditional risk factors for CVD
prevalence at enrollment are shown in Table 5. ORs
were adjusted mutually for all potential risk factors listed
in the table. In multivariable analysis, the variables significantly associated with the presence of CVD were age,
hypertension, diabetes mellitus, CKD stage, and AAC.
The risk factors of CVD with higher ORs were older age
(OR: 3.78; 95% CI: 2.55–5.59) (P < 0.001) in age 45–64
years, (OR: 6.07; 95% CI: 3.89–9.47) (P < 0.001) in age
65–74 years), followed by lower eGFR (OR: 2.07;95%
CI:1.28–3.34) in CKD stage 3a (P = 0.003), (OR: 1.66;
95% CI: 1.00–2.62) in CKD stage 3b (P = 0.032), (OR:
2.73; 95% CI: 1.72–4.36) in CKD stage 4 (P < 0.001)),
hypertension (OR: 2.57; 95% CI:1.50–4.41) (P < 0.001),
AAC (OR: 1.82; 95% CI: 1.23–2.70) (P = 0.003) and diabetes (OR: 1.70; 95%CI:1.30–2.23) (P < 0.001).
Discussion
C-STRIDE is a prospective observational multicenter
study of the risk factors for CVD in stage 1–4 CKD.
Here we investigated the prevalence and risk factors of
CVD in CKD populations. We report that the overall
prevalence of CVD among 3168 participants was 9.8% at
enrollment. The percentage of different CVD subtypes
among the subset of patients with CVD was MI 20.6%,
CHF 9.0%, cerebrovascular disease 69.1%, and PAD
10.1%, respectively. Our results also show that age, diabetes, hypertension, abdominal aorta calcification and
stage 3 & 4 CKD are significantly associated with the
prevalence of CVD.
C-STRIDE was designed to establish a Chinese cohort
similar to the CRIC study [11], and to examine risk factors for CKD progression and CVD development in
CKD patients with an eGFR between 15–90 ml/min/
1.73 m2. C-STRIDE’s cohort consists of Chinese living in
China, while CRIC is a mix of 45% White, 46% Black,
and 5% Hispanic participants living in the US. There are
many differences between Chinese and Western populations, such as ethnicity, calorie intake, and body size
[12]. These differences are apparent between the CSTRIDE and CRIC cohorts, which also show differences
in age, causes of CKD, prevalence of hypertension, diabetes and CVD, BMI, and eGFR. Any of these differences could affect the progression and treatment of
CKD. As shown in Table 6, the C-STRIDE participants
were younger with a lower average BMI, and with a
lower prevalence of diabetes, hypertension and CVD.
The C-STRIDE baseline indicated that age is an independent and graded risk factor for CVD events in 45–74
year old patients. China is a rapidly aging society in
which more than one quarter of Chinese will be older
than 65 years by 2050 [13]. The C-STRIDE study will
help clarify the dimension of risks for ESRD and CVD
among aging individuals with CKD. As summarized in
Tables 3, 4 and 5, the C-STRIDE cohort exhibits numerous risk factors for CVD and several differences with the
CRIC cohort. The baseline prevalence of CVD was
33.4% in CRIC, more than three times the 9.8% prevalence reported in C-STRIDE. The blood glucose control
in diabetic participants was also better in C-STRIDE
(mean A1C 6.0%) versus CRIC (mean A1C 7.7%). Finally, the mean BMI in C-STRIDE was 24.47 kg/m2,
considerably lower than that in CRIC (32.1 kg/m2). A
comparison of baseline characteristics between multiple
CKD cohort studies is shown in Table 6 [2–5].
The overall CVD prevalence of 9.8% in CKD patients
is much lower than reported in developed countries including Japan, but much higher than the overall percentage of 1.4% in the general Chinese population [14]. The
significantly lower prevalence of baseline CVD observed
in our study compared to similar cohorts might be attributable to the higher average eGFR, lower prevalence
of diabetes and hypertension, and/or the younger age of
subjects. These variables have been confirmed to be
Yuan et al. BMC Nephrology (2017) 18:23
Page 7 of 12
Table 5 Risk factors for the prevalence of CVD in C-STRIDE Study (Nov 2011 - Mar 2016)
Univariate
OR (95% CI)
P
Age and sex adjusted
OR (95% CI)
P
−
−
Multivariate adjusted
OR (95% CI)a
P
Male
1.61 (1.25–2.07)
<0.001
Female (ref)
1
−
1
1.36 (0.96─1.94)
0.09
18–44 (ref)
1
−
1
45–64
5.16 (3.56–7.48)
<0.001
−
−
3.78 (2.55–5.59)
<0.001
65–74
10.25 (6.85–15.34)
<0.001
−
−
6.07 (3.89–9.47)
<0.001
Gender
Age
Tobacco use (yes/no)
1.79 (1.41–2.27)
<0.001
1.46 (1.071–1.99)
0.017
1.31 (0.95–1.81)
0.10
Exercises < 3.5 h/week (yes/no)
1.07 (0.82–1.41)
0.61
0.81 (0.61–1.07)
0.14
0.80 (0.60–1.08)
0.14
Diabetic (yes/no)
3.08 (2.42–3.93)
<0.001
1.93 (1.49–2.49)
<.0001
1.70 (1.30–2.23)
<0.001
Hypertension (yes/no)
4.53 (2.70–7.58)
<0.001
3.37 (2.00–5.68)
<.0001
2.57 (1.50–4.41)
<0.001
HDL-C <35 mg/dl
1.40 (1.08–1.81)
0.01
1.26 (0.96–1.65)
0.09
1.14 (0.84–1.54)
0.41
LDL-C >120 mg/dl
0.76 (0.58–1.01)
0.05
0.74 (0.56–0.99)
0.04
0.81 (0.59–1.10)
0.17
TG >150 mg/dl
1.06 (0.84–1.35)
0.63
1.09 (0.85–1.40)
0.48
0.98 (0.75–1.28)
0.87
<0.001
1.39 (1.06–1.81)
0.0174
1.30 (0.97–1.72)
BMI
<24 (ref)
1
≥24
1.68 (1.29–2.18)
1
1
0.08
CKD stages
1–2(ref)
1
3a
4.10 (2.62–6.43)
<0.001
2.60 (1.64–4.13)
<.0001
2.07 (1.28–3.34)
<0.003
3b
3.83 (2.51–5.85)
<0.001
2.22 (1.44–3.44)
0.0003
1.66 (1.00–2.62)
0.03
4
1
1
5.19 (3.47–7.76)
<0.001
3.28 (2.16–4.97)
<.0001
2.73 (1.72–4.36)
<0.001
1.03 (0.72–1.45)
0.89
1.25 (0.87–1.795)
0.23
0.96 (0.66–1.42)
0.85
Ca <8.4 mg/dl
1 (0.74–1.35)
0.10
0.97 (0.71–1.33)
0.86
0.97 (0.69–1.36)
0.85
IPTH >65 pg/mL
1.62 (1.25–2.09)
<0.001
1.42 (1.09–1.85)
0.01
1.03 (0.77–1.40)
0.83
P >5 mg/dl
AAC
3.71 (2.58–5.33)
<0.001
2.18 (1.498–3.18)
<.0001
1.82 (1.23–2.70)
0.003
Hb <11 g/dl
1.06 (0.78–1.43)
0.72
0.93 (0.68–1.27)
0.64
0.67 (0.47–0.95)
0.03
Note: aAll variables listed in the table were included in the multivariate adjusted analysis. OR odds ratio, CI confidence interval, LDL-C low density lipoprotein
cholesterol, HDL-C high density lipoprotein cholesterol, TG triglycerides, BMI body mass index, P serum phosphorus, Ca serum calcium, iPTH intact parathyroid
hormone, AAC abdominal aorta calcification, Hb hemoglobin
independent risk factors for CVD among CKD patients
[15–19]. Deserving additional attention is the prominence of cerebrovascular disease among C-STRIDE participants exhibiting CVD. This is similar to the findings
of the ROUTE study (Japan) [20], but different from the
MERENA (Spain) [5] and CRIC (USA) [21] studies, in
which heart disease and PAD constituted the majority of
CVD events. There are two possible explanations for the
high incidence of cerebrovascular disease. First, the CSTRIDE study excluded CKD patients with NYHA Class
III or IV heart failure. Second, it appears that the
Chinese general population may have a higher CVA
prevalence than is observed in other countries. In a
Chinese cohort study of ischemic cardiovascular disease,
45 cases (5.4%) of ischemic stroke and 24 cases (2.9%) of
coronary heart disease were reported in 840 middle age
men followed for 20 years [22]. The Japan Public Health
Center-based prospective Study revealed 1,565 strokes
(2.7%) among 57,017 subjects in a Japanese populationbased cohort [23].
Based on the results of previous similar cohorts including the US CRIC [11] and the Japan CKD-JAC [24]
studies, we had anticipated that the distribution of CKD
etiology in C-STRIDE would be 30% glomerulonephritis
(GN) and 30% diabetic nephropathy (DN) [8]. However,
the actual distribution of CKD etiology was GN 60.6%
(twice as high as the targeted 30%), DN 13.9% (less than
half of the targeted 30%) and other causes 25.6%. This is
consistent with the data from the Chinese Renal Data
System, a national registry system for patients undergoing dialysis, which revealed that in China glomerular disease was the most common cause of ESRD (57.4%),
Yuan et al. BMC Nephrology (2017) 18:23
Page 8 of 12
Table 6 Comparison of baseline characteristics of CKD cohort studies
C-STRIDE China
n = 3168
ROUTE Japan
n = 1138
CRIC US
n = 3612
CRISIS UK
n = 1325
MERENA Spain
n = 1129
Inclusion range of eGFR (ml/min/1.73 m2)
15–90
0–90
20–70
10–60
15–60
Age (years)
48.2
68
58.2
65.1
68
Male gender (%)
59.2
69.6
54
63.7
64
2
BMI (kg/m )
24.5
23
32.1
Actual eGFR (ml/min/1.73 m2)
50.7
32.7
43.4
30.9
28
Diabetes (%)
21.7
37.1
47
32.4
40.8
Hypertension (%)
66.5
90.2
86
SBP (mmHg)
129.3
140
127.7
138.3
141
DBP (mmHg)
80.9
78
71.4
75.2
76
Hb (g/dl)
12.76
11.9
12.7
12.41
12.8
HDL-C (mg/dl)
44.86
LDL-C (mg/dl)
108.66
110
102.5
Ca (mg/dl)
8.9
9.1
9.2
9.14
P (mg/dl)
3.7
3.6
3.7
3.72
3.7
iPTH (pg/ml)
63.6
109
53
93.2
145
1.08 g/24 h
1.2 g/24 h
(median)
0.94 g/24 h
0.74 g/gCr
0.17 g/24 h
CVD prevalence (%)
9.8
26.8
33.44
47.2
39.1
Proteinuria (mean)
2.16 g/24gCr
28.4
92.7
116
eGFR estimated glomerular filtration rate, BMI body mass index, SBP systolic blood pressure, DBP diastolic blood pressure, Hb hemoglobin, HDL-C high density
lipoprotein cholesterol, LDL-C low density lipoprotein cholesterol, Ca calcium, P, phosphorus, iPTH intact parathyroid hormone, CVD cardiovascular disease, g/gCr
gram per gram creatinine
followed by DN (16.4%), hypertension (10.5%), and cystic
kidney disease (3.5%) [25]. Together, these data indicate
that the etiological constituents of CKD in China are different from those reported in developed countries,
where the leading cause of ESRD is DN [2–5]. Nevertheless, China has the highest overall number of diabetic
patients in the world, rising rapidly from 92.4 million in
2007 to 113.9 million diabetic patients in 2013 [26].
Therefore, diabetes complications such as DN will likely
become the main cause of ESRD in the coming decades.
Proteinuria is considered a risk factor for CVD and
mortality in patients with CKD. Microalbuminuria, or
even normal-range albuminuria, constitutes a risk for
CVD [27–32]. For instance, the AASK study of African
Americans, which investigated the cardiovascular and
renal outcomes of 59,508 participants with stage 1–3
CKD, indicated a significantly increased risk of CVD
with higher urinary albumin excretion, despite relatively
low levels of baseline proteinuria [31]. Likewise, in a
population-based cohort study in Taiwan, elevated albuminuria was a key predictor of progression to CKD or
ESRD as well as indicating a higher risk of CVD and
mortality [32]. The amount of urinary protein in the CSTRIDE patients (0.94 g/24 h) was higher compared
with the CRIC cohort (0.17 g/24 h). In the Chinese cohort, urine protein was not significantly associated with
CVD in CKD (P = 0.526) (Table 4). This is different from
the results found in Japan [20] and US [21], where increased proteinuria was associated with a higher CVD
prevalence.
It is generally thought that albuminuria always precedes loss of renal function in diabetic kidney disease
[33]. However, an increasing number of studies have cast
doubt on this classic paradigm. In a large number of
recent studies, 20–39% of patients with diabetes and reduced eGFR had normal albuminuria [34–37]. In some
clinical trials [38, 39], improvement in proteinuria did
not translate into increased GFR or reduced end points
such as the need for dialysis or death. Therefore, the role
of proteinuria in representing renal function and in
predicting adverse outcomes of CKD warrants further
research. At baseline of our study, proteinuria was not
associated with CVD. Long-term follow-up will provide
more information to help answer this question.
Over the past two decades the leading causes of mortality and morbidity have shifted from infectious diseases
to non-communicable disease such as vascular disease,
renal disease and DM. These disorders have become
major public health problems in developed and developing countries alike, imposing heavy economic burdens
[40, 41]. The relationship between DM and CVD has
been demonstrated in a series of studies [2–5, 42]. One
recent study reported that the prevalence of DM among
a representative sample of Chinese adults was 11.6%,
Yuan et al. BMC Nephrology (2017) 18:23
and the prevalence of pre-diabetes was 50.1% [26]. These
statistics illustrate the importance of DM as a public
health problem in China and suggest that DM will become the leading future cause of ESRD in China [43].
Indeed, DN now accounts for 46.2% and 43.2% of ESRD
cases in economically advanced regions such as Hong
Kong and Taiwan [25]. Unfortunately, despite recent improvements in glycemic and blood pressure control as
well as proteinuria reduction, DN remains the leading
cause of ESRD in developed countries [44]. Therefore,
there is an urgent need for development of novel therapeutic approaches that offer effective nephroprotection
and that block key pathogenic pathways leading to diabetic kidney disease.
Hypertension is a main cause of secondary CKD in
China [45]. Numerous studies have demonstrated hypertension as an important risk factor for CVD and all
causes of mortality [24, 46, 47]. With the 24-h ambulatory blood pressure (ABP) monitoring, the baseline of
C-STRIDE showed higher SBP and similar DBP in those
with CVD. ABP was recently demonstrated to be more
important than office blood pressure for predicting CVD
and mortality [46]. Morning surge in blood pressure was
shown to be a predictor of stroke in elderly hypertensives [47]. In the CKD-JAC study, where ABP was measured at different times to distinguish the impacts of
night and morning blood pressure, a higher morning
ABP surge was associated with CVD risk independently
[24]. In short, nearly all studies support the importance
of effective BP management in CKD as a public health
priority.
Internationally, a BMI of 25.0–29.9 kg/m2 is considered overweight and a BMI ≥30 kg/m2 is considered
obese. Based on the BMI data of the Chinese population,
the Working Group on Obesity of the International Life
Science Institute China Office recommended a BMI of
24 kg/m2 as the cut-off value for overweight and 28 kg/m2
as the cut-off value for obesity for Chinese [48]. The CSTRIDE cohort and the ROUTE cohort (Japan) [2]
had similar BMI, both lower than that in Western
studies [3–5]. Although some reports have suggested
higher BMI as an independent risk factor for advanced
CKD and CVD [49], the link between BMI and CVD is
not clear cut. Our study does not support a correlation between higher BMI and CVD. Several studies have shown
that higher BMI was actually associated with favorable
outcomes. For instance, a BMI greater than 30 kg/m2 was
associated with lower mortality among 920 patients with
advanced CKD in a Swedish study [50]. In the Atherosclerosis Risk in Communities (ARIC) cohort, a higher
body size was also associated with better overall survival
in stage 3 CKD [51].
Our results demonstrate declining GFR as a major risk
factor for CVD prevalence in the C-STRIDE cohort. To
Page 9 of 12
better examine the function of eGFR, we employed the
staging of 3a and 3b instead of a single stage 3. Although
a cohort study of Taiwan found no difference between
3a and 3b in predicting CVD incidence [52], we observed significant differences in the occurrence of MI,
cerebrovascular disease and PAD between stages 3a and
3b. A multitude of studies have clearly demonstrated
that overt renal dysfunction is independently and significantly associated with an increased risk of CVD events
and mortality [53–55]. A study from Japan indicated that
even after adjustment for other risk factors, the presence
of CKD conferred a higher risk of cardiovascular death
with a hazard ratio of 1.20 [53]. A negative graded correlation between eGFR and risk of cardiovascular death
was observed. The Framingham Heart Study suggested
the same association [54]. The KORA Study demonstrated that CKD was strongly associated with an increased risk of incident MI and CVD mortality,
independent from common cardiovascular risk factors in
men and women [55]. The MATISS Study suggested
that in an elderly general population with low risk of
CVD and low incidence of reduced renal function, even
a modest eGFR reduction was related to all-cause mortality and CVD incidence [56].
The overall prevalence of AAC in the C-STRIDE study
baseline was 32.9%, with statistically higher percentages
in stages 3b and 4. Multiple regression analysis indicated
that AAC increases the risk for CVD in CKD. Another
Chinese study [57] reported an AAC incidence of 54% in
the CKD patients, and also showed a strong association
between the incidence of AAC and cardiovascular risks.
Specifically, AAC was positively correlated with left
atrial anteroposterior diameter (LAD), pulmonary arterial systolic pressure (PASP) and carotid artery intimamedia thickness (IMT), and negatively correlated with
ejection fraction (EF) and shortening fraction (SF) [57].
A cohort study performed on adult Japanese patients
with pre-dialysis CKD demonstrated 82% subjects had
AAC, and identified AAC as independent predictors for
de novo cardiovascular events in CKD stages 4 and 5
[58]. A US study [59] evaluated the association of AAC
and CVD in 1974 randomly selected subjects (45 to
84 years old) with complete AAC and coronary artery
calcification (CAC) data from computerized tomographic scans. It was found that AAC and CAC predicted hard coronary heart disease and hard CVD events
independent of one another. Only AAC was independently related to CVD mortality, and AAC showed a
stronger association with total mortality than CAC.
It is worth noting some limitations of our study. First,
we had a less-than-anticipated diabetes recruitment,
which could cause a potential bias. The strict criteria for
DN screening may in part account for the lower diabetes
diagnosis in our cohort. The defining eligibility of DN
Yuan et al. BMC Nephrology (2017) 18:23
was eGFR 15–59 ml/min/1.73 m2, or eGFR ≥ 60 ml/min/
1.73 m2 with “nephrotic range” proteinuria, which was
defined as 24-h urinary protein ≥3.5 g or urinary
albumin creatinine ratio (UACR) ≥2 000 mg/g [8]. As a
result, early stage DN was not adequately screened for.
Nevertheless, this design would ensure sufficient power
to observe adverse consequences in the DN-subgroup
population, which will provide valuable information on
diabetes as a cause of CKD in China. Second, we used
self-report and review of medical records to define CVD
in this study. This may have missed a small group of
participants with undiagnosed CVD, and therefore the
results of CVD-related morbidity may not be allinclusive. Third, abdominal aorta calcification was determined by radiograph, which is less sensitive in detecting
atherosclerotic lesions than newer modalities such as
computerized tomography [60]. Therefore, early stage
vascular calcification may have been under reported.
Computerized tomography was not available in this research due to the high costs. However, color Doppler
ultrasound has been used in the C-STRIDE cohort to
evaluate carotid artery calcification. This will improve
diagnostic sensitivity of cardiovascular calcification by
integration of radiographic and ultrasound techniques
during follow-up.
Conclusions
In summary, the C-STRIDE baseline analysis has demonstrated that participants with progressive CKD have a
higher prevalence of CVD at entry than the general
Chinese population. Age, diabetes, hypertension, abdominal aorta calcification and stage 3 & 4 CKD are significantly associated with the prevalence of CVD. In the
next phase of the study, all subjects will be sampled annually for at least 5 years. This Long-term follow-up of
participants will provide critical insight into the epidemiology of CVD in CKD, reveal the impact of individual
risk factors on adverse outcomes, and serve as a foundation for future interventional investigations.
Additional file
Additional file 1: Table S1. Anticipated and actual target distributions
of CKD etiology and renal function, C-STRIDE study (Nov 2011- Mar 2016).
(DOC 33 kb)
Abbreviations
AAC: Abdominal aorta calcification; ABP: Ambulatory blood pressure;
ANOVA: Analysis of variance; aOR: Adjusted odds ratios; ARIC: Atherosclerosis
risk in communities; BMI: Body mass index; CAC: Coronary artery calcification;
CI: Confidence interval; CKD: Chronic kidney disease; CRIC: Chronic renal
insufficiency cohort; C-STRIDE: Chinese Cohort Study of Chronic Kidney
Disease; CVD: Cardiovascular disease; DBP: Diastolic blood pressure;
DM: Diabetes mellitus; DN: Diabetic nephropathy; EF: Ejection fraction;
eGFR: Estimated glomerular filtration rate; ESRD: End-stage renal disease;
GN: Glomerulonephritis; Hb: Hemoglobin; HbA1c: Hemoglobin A1C; HDLC: High density lipoprotein cholesterol; hs-CRP: High-sensitivity C-reactive
Page 10 of 12
protein; IMT: Intima-media thickness; iPTH: Intact parathyroid hormone;
KDIGO: Kidney Disease Improving Global Outcomes; LAD: Left atrial
anteroposterior diameter; LDL-C: Low density lipoprotein cholesterol;
MI: Myocardial infarction; MOP: Manual of operation procedure; NYHA: New
York Heart Association; PAD: Peripheral arterial disease; PASP: Pulmonary
arterial systolic pressure; ROUTE: Research and outcome in treatment and
epidemiology; SAS: Statistical analysis system; SBP: Systolic blood pressure;
SCr: Serum creatinine; SD: Standard deviation; SF: Shortening fraction;
TC: Total cholesterol; TG: Triglyceride; UACR: Urinary albumin creatinine ratio;
UACR: Urinary albumin creatinine ratio
Acknowledgements
The authors thank every member of C-STRIDE Group for close and seamless
cooperation. The detailed information on the members of the C-STRIDE Group
can be found in the published literature [8]. We thank Drs. Yuan Clare Zhang
and Parker B. Antin for critical reading of the manuscript and constructive
comments.
Funding
The study was supported by National Key Technology R&D Program of the
Ministry of Science and Technology (Project 2011BAI10B01) and Beijing Science
and Technology Committee (Project D131100004713007, “Establishment of
early diagnosis pathway and model for evaluating progression of chronic
kidney disease”). We declare that the funding bodies didn’t take part in the
design of the study and collection, analysis, and interpretation of data and in
writing the manuscript.
Availability of data and material
The datasets during the current study are available from the corresponding
author on reasonable request.
Authors’ contributions
Study concept and design: XQW, JY; Acquisition of data: SPH, LW, XRZ;
Analysis and interpretation of data: JWW, LXZ; Drafting of the manuscript: JY,
HC, XQW; Critical revision of the manuscript for important content: JWW,
LXZ, MHZ; Statistical analysis: JWW, LXZ; Person in charge of study: XQW. All
authors read and approved the final manuscript.
Competing interests
The authors declare that they have no competing interests.
Consent for publication
Not applicable.
Ethics approval and consent to participate
This study was approved by the ethics committee of Peking University First
Hospital. The institutional review boards of each participating hospitals
approved the study protocol and the study was conducted in accordance
with the ethical principles of the Declaration of Helsinki. The written
informed consents were obtained from all study participants.
Author details
1
Hubei University of Chinese Medicine, Wuhan 430065, China. 2Renal
Division, Department of Medicine, Hubei Provincial Hospital of Traditional
Chinese Medicine, The Affiliated Hospital of Hubei University of Chinese
Medicine, Wuhan 430061, China. 3Renal Division, Department of Medicine,
Peking University First Hospital, Beijing 100034, China. 4Institute of
Nephrology, Peking University, Beijing 100034, China. 5Key Laboratory of
Renal Disease, Ministry of Health of China; Key Laboratory of Chronic Kidney
Disease Prevention and Treatment, Peking University, Ministry of Education,
Beijing 100034, China.
Received: 12 July 2016 Accepted: 6 January 2017
References
1. Zhang L, Wang F, Wang L, et al. Prevalence of chronic kidney disease in
China: a cross-sectional survey. Lancet. 2012;379(9818):815–22.
2. Iimori S, Naito S, Noda Y, et al. Anaemia management and mortality risk in
newly visiting patients with chronic kidney disease in Japan: The CKDROUTE study. Nephrology (Carlton). 2015;20(9):601–8.
Yuan et al. BMC Nephrology (2017) 18:23
3.
4.
5.
6.
7.
8.
9.
10.
11.
12.
13.
14.
15.
16.
17.
18.
19.
20.
21.
22.
23.
24.
25.
26.
Shah R, Matthews GJ, Shah RY, et al. Serum Fractalkine (CX3CL1) and
Cardiovascular Outcomes and Diabetes: Findings From the Chronic Renal
Insufficiency Cohort (CRIC) Study. Am J Kidney Dis. 2015;66(2):266–73.
Ritchie J, Rainone F, Green D, et al. Extreme Elevations in Blood Pressure
and All-Cause Mortality in a Referred CKD Population: Results from the
CRISIS Study. Int J Hypertens. 2013;2013:597906.
Martinez-Castelao A, Gorriz JL, Portoles JM, et al. Baseline characteristics of
patients with chronic kidney disease stage 3 and stage 4 in Spain: the
MERENA observational cohort study. BMC Nephrol. 2011;12:53.
Collins AJ, Foley RN, Chavers B, et al. United States Renal Data System 2011
Annual Data Report: Atlas of chronic kidney disease & end-stage renal
disease in the United States. Am J Kidney Dis. 2012;A7:e1–420.
Drury PL, Ting R, Zannino D, et al. Estimated glomerular filtration rate
and albuminuria are independent predictors of cardiovascular events
and death in type 2 diabetes mellitus: the Fenofibrate Intervention
and Event Lowering in Diabetes (FIELD) study. Diabetologia. 2011;
54(1):32–43.
Gao B, Zhang L, Wang H, Zhao M. Chinese cohort study of chronic kidney
disease: design and methods. Chin Med J (Engl). 2014;127(11):2180–5.
Kidney Disease: Improving GlobalOutcomes (KDIGO) CKD Work Group.
KDIGO 2012 Clinical Practice Guideline for theEvaluation and Management
of Chronic Kidney Disease. Kidney inter. 2013;3:1–150.
Levey AS, Stevens LA, Schmid CH, et al. A new equation to estimate
glomerular filtration rate. Ann Intern Med. 2009;150(9):604–12.
Lash JP, Go AS, Appel LJ, et al. Chronic Renal Insufficiency Cohort (CRIC)
Study: baseline characteristics and associations with kidney function. Clin J
Am Soc Nephrol. 2009;4(8):1302–11.
Le ML, Wilkens LR, Kolonel LN, Hankin JH, Lyu LC. Associations of sedentary
lifestyle, obesity, smoking, alcohol use, and diabetes with the risk of
colorectal cancer. Cancer Res. 1997;57(21):4787–94.
Feng Z, Liu C, Guan X, Mor V. China’s rapidly aging population creates
policy challenges in shaping a viable long-term care system. Health Aff
(Millwood). 2012;31(12):2764–73.
Yang ZJ, Liu J, Ge JP, Chen L, Zhao ZG, Yang WY. Prevalence of
cardiovascular disease risk factor in the Chinese population: the 2007–2008
China National Diabetes and Metabolic Disorders Study. Eur Heart J. 2012;
33(2):213–20.
Ohno M, Deguchi F, Izumi K, et al. Correlation between renal function and
common risk factors for chronic kidney disease in a healthy middle-aged
population: a prospective observational 2-year study. PLoS ONE. 2014;9(11),
e113263.
Yamagata K, Ishida K, Sairenchi T, et al. Risk factors for chronic kidney
disease in a community-based population: a 10-year follow-up study.
Kidney Int. 2007;71(2):159–66.
Go AS, Chertow GM, Fan D, McCulloch CE, Hsu CY. Chronic kidney disease
and the risks of death, cardiovascular events, and hospitalization. N Engl J
Med. 2004;351(13):1296–305.
Ryan TP, Fisher SG, Elder JL, et al. Increased cardiovascular risk associated
with reduced kidney function. Am J Nephrol. 2009;29(6):620–5.
Ninomiya T, Kiyohara Y, Kubo M, et al. Chronic kidney disease and
cardiovascular disease in a general Japanese population: the Hisayama
Study. Kidney Int. 2005;68(1):228–36.
Iimori S, Noda Y, Okado T, et al. Baseline characteristics and prevalence of
cardiovascular disease in newly visiting or referred chronic kidney disease
patients to nephrology centers in Japan: a prospective cohort study. BMC
Nephrol. 2013;14:152.
Rahman M, Xie D, Feldman HI, et al. Association between chronic kidney
disease progression and cardiovascular disease: results from the CRIC Study.
Am J Nephrol. 2014;40(5):399–407.
Jin X, Zhou J, Zhou J, Pan X, Chen H, Ge J. Role of novel risk factors in predicting
risk of ischemic cardiovascular diseases in middle aged men in twenty years in
Shanghai. Zhonghua Liu Xing Bing Xue Za Zhi. 2016;37(3):335–8.
Svensson T, Inoue M, Sawada N, et al. Coping strategies and risk of
cardiovascular disease incidence and mortality: the Japan Public Health
Center-based prospective Study. Eur Heart J. 2016;37(11):890–9.
Imai E, Matsuo S, Makino H, et al. Chronic Kidney Disease Japan Cohort
study: baseline characteristics and factors associated with causative diseases
and renal function. Clin Exp Nephrol. 2010;14(6):558–70.
Liu ZH. Nephrology in china. Nat Rev Nephrol. 2013;9(9):523–8.
Xu Y, Wang L, He J, et al. Prevalence and control of diabetes in Chinese
adults. JAMA. 2013;310(9):948–59.
Page 11 of 12
27. Culleton BF, Larson MG, Parfrey PS, Kannel WB, Levy D. Proteinuria as a risk
factor for cardiovascular disease and mortality in older people: a
prospective study. Am J Med. 2000;109(1):1–8.
28. Hillege HL, Fidler V, Diercks GF, et al. Urinary albumin excretion predicts
cardiovascular and noncardiovascular mortality in general population.
Circulation. 2002;106(14):1777–82.
29. Xu J, Knowler WC, Devereux RB, et al. Albuminuria within the “normal”
range and risk of cardiovascular disease and death in American Indians: the
Strong Heart Study. Am J Kidney Dis. 2007;49(2):208–16.
30. Wright Jr JT, Bakris G, Greene T, et al. Effect of blood pressure lowering and
antihypertensive drug class on progression of hypertensive kidney disease:
results from the AASK trial. JAMA. 2002;288(19):2421–31.
31. Brantsma AH, Bakker SJ, Hillege HL, De Zeeuw D, De Jong PE, Gansevoort
RT. Cardiovascular and renal outcome in subjects with K/DOQI stage 1–3
chronic kidney disease: the importance of urinary albumin excretion.
Nephrol Dial Transplant. 2008;23(12):3851–8.
32. Liao LN, Liu CS, Li CI, et al. Three-year incidence of elevated albuminuria
and associated factors in a population-based cohort: The Taichung
Community Health Study. Eur J Prev Cardiol. 2015;22(6):788–97.
33. Fernandez-Fernandez B, Ortiz A, Gomez-Guerrero C, Egido J. Therapeutic
approaches to diabetic nephropathy–beyond the RAS. Nat Rev Nephrol.
2014;10(6):325–46.
34. Molitch ME, Steffes M, Sun W, et al. Development and progression of renal
insufficiency with and without albuminuria in adults with type 1 diabetes in
the diabetes control and complications trial and the epidemiology of
diabetes interventions and complications study. Diabetes Care. 2010;33(7):
1536–43.
35. Kramer HJ, Nguyen QD, Curhan G, Hsu CY. Renal insufficiency in the
absence of albuminuria and retinopathy among adults with type 2 diabetes
mellitus. JAMA. 2003;289(24):3273–7.
36. Retnakaran R, Cull CA, Thorne KI, Adler AI, Holman RR. Risk factors for renal
dysfunction in type 2 diabetes: U.K. Prospective Diabetes Study 74. Diabetes.
2006;55(6):1832–9.
37. Garg AX, Kiberd BA, Clark WF, Haynes RB, Clase CM. Albuminuria and renal
insufficiency prevalence guides population screening: results from the
NHANES III. Kidney Int. 2002;61(6):2165–75.
38. Haller H, Ito S, Izzo JL, et al. Olmesartan for the delay or prevention of
microalbuminuria in type 2 diabetes. N Engl J Med. 2011;364(10):907–17.
39. Mann JF, Schmieder RE, McQueen M, et al. Renal outcomes with
telmisartan, ramipril, or both, in people at high vascular risk (the ONTARGET
study): a multicentre, randomised, double-blind, controlled trial. Lancet.
2008;372(9638):547–53.
40. Beaglehole R, Yach D. Globalisation and the prevention and control of noncommunicable disease: the neglected chronic diseases of adults. Lancet.
2003;362(9387):903–8.
41. Atkins RC. The epidemiology of chronic kidney disease. Kidney Int Suppl.
2005;94:S14–8.
42. Levin A, Djurdjev O, Barrett B, et al. Cardiovascular disease in patients with
chronic kidney disease: getting to the heart of the matter. Am J Kidney Dis.
2001;38(6):1398–407.
43. Zhang L, Long J, Jiang W, et al. Trends in Chronic Kidney Disease in China.
N Engl J Med. 2016;375(9):905–6.
44. Fernández FB, Elewa U, Sánchez-Niño MD, et al. 2012 update on diabetic
kidney disease: the expanding spectrum, novel pathogenic insights and
recent clinical trials. Minerva Med. 2012;103(4):219–34.
45. Wang C, Deng WJ, Gong WY, et al. High prevalence of isolated nocturnal
hypertension in Chinese patients with chronic kidney disease. J Am Heart
Assoc. 2015;4(6), e002025.
46. Ohkubo T, Imai Y, Tsuji I, et al. Prediction of mortality by ambulatory blood
pressure monitoring versus screening blood pressure measurements: a pilot
study in Ohasama. J Hypertens. 1997;15(4):357–64.
47. Kario K, Pickering TG, Umeda Y, et al. Morning surge in blood pressure as a
predictor of silent and clinical cerebrovascular disease in elderly
hypertensives: a prospective study. Circulation. 2003;107(10):1401–6.
48. Wu YF, Ma GS, Hu YH, et al. The current prevalence status of body
overweight and obesity in China: data from the China National
Nutrition and Health Survey. Zhonghua Yu Fang Yi Xue Za Zhi. 2005;
39(5):316–20.
49. Kramer H, Luke A, Bidani A, Cao G, Cooper R, McGee D. Obesity and
prevalent and incident CKD: the Hypertension Detection and Follow-Up
Program. Am J Kidney Dis. 2005;46(4):587–94.
Yuan et al. BMC Nephrology (2017) 18:23
Page 12 of 12
50. Evans M, Fryzek JP, Elinder CG, et al. The natural history of chronic renal
failure: results from an unselected, population-based, inception cohort in
Sweden. Am J Kidney Dis. 2005;46(5):863–70.
51. Kwan BC, Murtaugh MA, Beddhu S. Associations of body size with
metabolic syndrome and mortality in moderate chronic kidney disease. Clin
J Am Soc Nephrol. 2007;2(5):992–8.
52. Chen YC, Su YC, Lee CC, Huang YS, Hwang SJ. Chronic kidney disease itself
is a causal risk factor for stroke beyond traditional cardiovascular risk factors:
a nationwide cohort study in Taiwan. PLoS ONE. 2012;7(4), e36332.
53. Nakamura K, Okamura T, Hayakawa T, et al. Chronic kidney disease is a risk
factor for cardiovascular death in a community-based population in Japan:
NIPPON DATA90. Circ J. 2006;70(8):954–9.
54. Parikh NI, Hwang SJ, Larson MG, Levy D, Fox CS. Chronic kidney disease as a
predictor of cardiovascular disease (from the Framingham Heart Study). Am
J Cardiol. 2008;102(1):47–53.
55. Meisinger C, Doring A, Lowel H. Chronic kidney disease and risk of incident
myocardial infarction and all-cause and cardiovascular disease mortality in
middle-aged men and women from the general population. Eur Heart J.
2006;27(10):1245–50.
56. Donfrancesco C, Palleschi S, Palmieri L, et al. Estimated glomerular filtration
rate, all-cause mortality and cardiovascular diseases incidence in a low risk
population: the MATISS study. PLoS ONE. 2013;8(10), e78475.
57. Bao HD, Sheng XH, Wang NS, et al. Analysis the Occurrence and Risk
Factors of Abdominal Aorta Calcification in Advanced CKD Patients. CJITWN.
2014;11:957–60.
58. Hanada S, Ando R, Naito S, et al. Assessment and significance of abdominal
aortic calcification in chronic kidney disease. Nephrol Dial Transplant. 2010;
25(6):1888–95.
59. Criqui MH, Denenberg JO, McClelland RL, et al. Abdominal aortic calcium,
coronary artery calcium, and cardiovascular morbidity and mortality in the
Multi-Ethnic Study of Atherosclerosis. Arterioscler Thromb Vasc Biol. 2014;
34(7):1574–9.
60. Wilson PW, Kauppila LI, O’Donnell CJ, et al. Abdominal aortic calcific
deposits are an important predictor of vascular morbidity and mortality.
Circulation. 2001;103(11):1529–34.
Submit your next manuscript to BioMed Central
and we will help you at every step:
• We accept pre-submission inquiries
• Our selector tool helps you to find the most relevant journal
• We provide round the clock customer support
• Convenient online submission
• Thorough peer review
• Inclusion in PubMed and all major indexing services
• Maximum visibility for your research
Submit your manuscript at
www.biomedcentral.com/submit