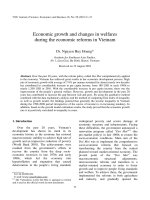
Báo cáo " Economic growth and changes in welfares during the economic reforms in Vietnam " doc
Bạn đang xem bản rút gọn của tài liệu. Xem và tải ngay bản đầy đủ của tài liệu tại đây (136.62 KB, 13 trang )
VNU Journal of Science, Economics and Business 26, No. 5E (2010) 11-23
11
Economic growth and changes in welfares
during the economic reforms in Vietnam
Dr. Nguyen Huy Hoang*
Institute for Southeast Asia Studies,
No 1, Lieu Giai, Ba Dinh, Hanoi, Vietnam
Received on 19 August 2010
Abstract. Over the past 20 years, with the reform policy called Doi Moi comprehensively applied
to the economy, Vietnam has achieved great results in her economic development process. High
rate of economic growth with average of 7-8% per annum sustained for almost nearly two decades
has contributed to considerable increase in per capita income, from 180 USD in early 1990s to
nearly 1,200 USD in 2010. With the considerable increase in per capita income, there was the
improvement of the people’s general welfare. However, growth and development in the past 20
years has contributed to increase the gap between rich and poor. By using the qualitative method
combined with the data explanatory analysis and the method of computing Gini index of inequality
as well as growth model, the findings pointed that generally the income inequality in Vietnam
during the 1998-2008 period (irrespective of the source of income) is in increasing tendency. In
addition, based on the growth model estimation results, the study proved that the economic growth
rate is in positively correlated to inequality in come.
1. Introduction
*
Over the past 20 years, Vietnam’s
development has shown its mark in its
economic history as the economy has restored
macroeconomic stability to achieve high rate of
growth and an impressive reduction of poverty
(World Bank 2001). The achievements were
resulted from the government’s efforts to
recover the country from the deep socio-
economic recession in late 1970s and early
1980s, which led the economy into
hyperinflation and stagnation that caused
deterioration in the people’s living standard,
______
*
Tel: 84-983994104
E-mail: hoang
–
(1)
The Vietnamese words Doi Moi is analogue to reform
and is used as the official words in most documents.
widespread poverty and severe damage of
economic structure and infrastructure. Facing
these difficulties, the government announced a
renovation program called “Doi Moi”
(1)
(the
pro-market policy) in late 1980s to restore the
socio-economic conditions. Main aim of the
Doi Moi was to implement the comprehensive
socio-economic reforms that focused on
transforming the country from the central
planned toward market-oriented economy. The
pivotal point of the “Doi Moi” was
macroeconomic structural adjustments,
microeconomic reforms and transition to a
market-oriented economy in order to foster
growth and to improve people living standards
and welfare. To achieve these, the government
implemented the reforms in both agriculture
and industry, and gradually opened the
N.H. Hoang / VNU Journal of Science, Economics and Business 26, No. 5E (2010) 11-23
12
economy to the outside world. With a high rate
of economic growth attained, people’s welfare
has changed. Poverty rate declined sharply as it
is recognized that “almost no other country has
recorded such a sharp decline in poverty in such
a short period of time” (Government of
Vietnam-Donor-NGO Poverty Working Group,
1999), and household living standards have
been considerably improved. The data from
various household living standard surveys
revealed the proportion of the population living
below poverty line
(2)
measured by head count
index significantly declined from 59% in 1993
to just over 14% in 2006.
2. A Review of the economic development
before Doi Moi: Period 1975-1985
After the country’s reunification in 1975,
Vietnam’s economy was characterized by the
continuation of socialist transformation nation-
wide. This is marked by the Fourth National
Congress of the Communist party in December
1976, which mapped out the period of transition
to socialism throughout the country as “to carry
out socialist industrialization and transform the
economy from small scale production into large
scale socialist production, and to give priority
to development of heavy industry based on
______
(2)
There are two poverty lines used in Vietnam namely the
national poverty line and the international poverty line.
The international poverty line is derived by the Vietnam
General Statistical Office (GSO) has two components. The
lower food poverty line is a measure of the expenditure per
capita required to secure an intake of 2100 calories a day,
regarded as the minimum nutritional requirement. Non-
food items are added to obtain the general poverty line.
The basket of food and non-food items is determined by
the consumption patterns of the first quintile of households
in terms of capita expenditure. People whose expenditures
beneath the poverty line are considered poor. Meanwhile
the national poverty line was developed by the Ministry of
Labor, Invalids and Social Affairs. In the 1990s this line
was the income equivalent of buying 15kg, 20kg and 25kg
of rice per month as poverty line for food items. In 2001
the line was increased to include non-food items. The
poverty rate is the proportion of households that fall
beneath the line. In this study, we use the international
poverty line.
development of agriculture and light industry”
(Fourth National Congress of the Communist
Party, 1976). During this period, the economy
was performing poorly. In the North, two
decades of war and isolation with inherent
problems of applying soviet model central
planning to a poor and subsistence agrarian
economy had done little to improve the well-
being of the population (VGSO, 1992; Fforde
and de Vylder, 1996). In the South, war and the
distorted structure of incentives that had
resulted from large and sustained volumes of
US aid had impoverished many and enriched a
few (Dacay,1986). Trapped in both low
economic growth and dissimilar economic
styles between two regions, the state quickly
moved into the Second Five Year Plan
(3)
(1976-
1980) and the Third Five Year Plan (1981-
1985) to apply the central planning upon the
entire country, and to correct the shortcomings
of the economy due to the application of central
planning across the entire country in the Second
Five Year Plan that caused a downturn in the
late 1970s as shown in Table 1. As the table
revealed the decomposition of growth rate into
different categories for 1979 and 1980 was below
zero, the consumer price index (free market price)
was so high, yearly-basic increase by more than
100%, and high levels of trade deficit.
The Second Five-Year Plan, from 1976 to
1980, contained many points of voluntarism
such as: i, to strive for achieving rapid
development of agriculture, to improve people’s
living standard and to accumulate capital for
industrialization production (agro-based
______
(3)
After the war with France (First Indochina War) ended
in 1954, Vietnam had been partitioned into two regions:
North and South. In the recovering period after the war,
the North Vietnam’s economy grew well, quickly
recovering agriculture and transportation. Since 1958, the
North has realised socialist transformation in the economy,
establishing centralised-economy developing model and
nationalising all means of production, planning the
national economy centrally. In this period, the North
government implemented the First Five-Year Plan which
took place from 1961 to 1965, the country moved into a
constructing period under central planning.
N.H. Hoang / VNU Journal of Science, Economics and Business 26, No. 5E (2010) 11-23
13
developing model); ii, to develop heavy
industry to support agriculture and then to
increase capital accumulation; and iii, to
implement basic socialist transformation to the
South. In this period, the economic model
developed in the North was applied to the South
as the government nationalized state enterprises
and cracked down private businesses, organized
farmers into the northern style of agricultural
collectives.
In the Third Five Year Plan from 1981 to
1985, in order to reverse the bad economic
situation at the end of the previous plan, the
country attempted to break the rigidity of the
centrally planned mechanism. Being supported
by the top leaders, a new and relatively liberal
resolution had been introduced as to encourage
the development of a private and household
economy, which was strictly prohibited before.
Most important breakthrough was the
introduction of the product contract system in
agriculture, a step further away of the agrarian
reform proclaimed in the late 1979s by passing
Directive No. 100. In this system, households,
rather than cooperatives were considered as the
main economic unit, and were assigned lands in
a cooperative by signing a contract to deliver a
given amount of output at fixed prices as quota
for using the cooperative land. The households
were allowed to retain and trade surplus output
beyond their quota. The cooperative remained
responsible for providing various services as
ploughing, irrigation and marketing, and supply
of seeds, fertilizers and pesticides.
In the industrial sector, a significant change
was the application of market-oriented reform,
whereby the state-owned enterprises (SOEs)
were allowed to operate under the Three Plan
System Mechanism. Under Plan One, the
enterprises were provided with the inputs at
subsidized prices, but were required to supply
set quantities of goods to the state. Under Plan
Two, the enterprises could produce beyond the
amount specified in Plan One and were able to
buy additional inputs needed. Plan Three
allowed enterprises to engage in sideline
activities as they were permitted to produce and
sell surplus products from freely purchased
inputs.
However, most targets set by the second
five year plan were hard to meet. Collective
mechanism in agriculture and nationalization of
industry proved its shortcomings and many
setbacks as growth of these sectors in the
second plan was very little. However, with the
introduction of Product Contract System in
agriculture and Three Plan System in industry
in early 1980s, the economy recovered and was
in better prospect. Table 1 reveals total social
product and industrial outputs growth rates
were negative during 1980-1981, then increased
in early years of 1981-1985 before falling again
in 1985-1986. For the 1976-80 period, annual
agricultural growth was around 1.9%,
significantly lower than annual population
growth of 2.3%. However, total agricultural
output increased in 1981-1982 before declining
again during 1984-1986. There was no different
story in the industrial and trading sectors.
Nationalization of industries and commerce was
not successful. Industrial sector had a very low
rate of growth. Industrial production was
stagnant with an annual growth rate of about
0.4% only (VGSO 1991). As a result of
mismanagement and misleading policies, the
economy was in very bad condition. Food
shortage was so critical that the government is
forced to import 1,576 millions tons of food
grains in 1980 despite as an agricultural-based
economy. Budget deficit was very high, from as
low as 2.5% for the 1976-1980 period, it rose to
14% in 1981-1985 and reached peak of 36% in
1985. Gross investment was too low. Prices
rose almost more than 50% annually and import
was much higher than export. The economy
was in short of investment capital leaving many
plans unfinished and leading to serious shortage
of essential consumer goods. As table 1
showed, after a slight recovery in the early
years of the 1980s, the economy was in
recession again in the mid 1980s.
N.H. Hoang / VNU Journal of Science, Economics and Business 26, No. 5E (2010) 11-23
14
Table 1: Selected Macroeconomic Indicators, Period 1976-1986
Indicators 76-80 81-85 1979 1980 1981 1982 1983 1984 1985 1986
Growth rate (% per year)
Total social product
a
0.5 6.4 -2.0 -1.4 2.05 8.9 6.7 8.3 5.7 2.2
Per capita social product -1.8 4.2 -4.2 -3.6 0.3 6.7 4.5 6.1 3.5 2.1
Total industrial output 0.6 9.5 -5.5 -1.4 1.0 8.1 12.8 13.1 11.9 6.5
Total agriculture output 1.9 4.9 1.7 5.2 4.9 10.9 7.0 4.2 4.7 0.3
Retail price index 60.0 74.2 119.4 125.2 69.6 95.4 49.5 64.9 91.6 590.0
Gross investment (as %
of net material product)
13.1
13.0
14.0
13.3
11.7
10.8
12.8
14.9
15.0
8.0
Budget deficit (as % of
total govern. expenditure)
2.5
14.0
5.2
1.0
17.5
8.0
4.5
4.0
36.0
30.0
Trade deficit
(% export/import)
24.2
33.8
33.1
30.3
29.1
32.6
37.5
35.0
35.0
37.0
Per capita staples
production (kgs)
259
295
266
268
273
300
296
303
304
301
Unemployment rate (%) 12 20 13 15 29 32 25 19 10 9
Notes: a. The net material product national accounting system is explained in endnote 111.
Sources: GSO of Vietnam and the World Bank Vietnam: various years.
Prior to the Sixth Congress of the Party in
1986, the Government was facing two
difficulties. First, the process of the economic
transformation was stagnant. In the beginning,
especially in 1979 and 1980 there was no
output growth but the population grew very
fast. Real capita income continued to fall from
an already low level with per capita total
product declined at 2.0% and 1.4% for
respective 1979, 1980 (Table 1). Second, the
partial and gradual market-oriented reform was
seriously defected. There was output response
but the macroeconomic imbalance undermined
the support of the reforms. In 1985 and 1986
the price rose almost from 100% to 300 % in
the free market retails. To cope with the
downturn, in 1985 the state introduced a
comprehensive reform in currency, price and
wage. The number of goods subject to price
controls was reduced. Efforts were made to
eliminate subsidies to producers and
consumers. However, the efforts to reform
subsidies and prices resulted in heavy losses for
SOEs. The coverage by the state for the losses
of SOEs had a dual impact. First, it boosted the
budget deficit, which rose to an unsustainable
12% of GDP in 1985 (World Bank, 1990).
Second, the budget constraint of the SOEs
stimulated further inflation. The GDP deflator,
which rose from 307 in 1984 to 588 in 1985,
took off to reach 3415 in 1986 (World Bank,
1990). As a result, hyperinflation prevailed and
domestic saving collapsed (Fforde and de
Vlyder, 1996). The economy was again facing
severe stagnancy and downturn. Therefore, in
December 1986, the Government decided to
change the course of the reform toward more
intensive to transform the economy from a
centrally planned to a market-oriented
economy. This transformation had been known
as Doi Moi. The Doi Moi suggests not a full-
scale conversion to capitalism, but rather a
cautious acceptance of the market as a means
for achieving economic growth, improving
people’s living standard and, thereby,
maintaining and strengthening the party’s
political and economic control.
3. Economic reform under Doi Moi and its
impacts on macroeconomic performance
The severe macroeconomic imbalances in
the mid-1980s exposed the inherent
contradiction of a state-led, market-
subordinated development strategy (Sepehri
and Akram-Lodhi, 2002). In addition, the
advent of hyperinflation led to a collapse of real
N.H. Hoang / VNU Journal of Science, Economics and Business 26, No. 5E (2010) 11-23
15
spending and a liquidation of domestic saving.
Whilst the state’s earlier attempts to sustain
central planning and its institutions succeeded
in slowing down the growth of the non-planned
economy, the symbiotic relationship between
the planned and non-planned sectors created
more pressure for further intensive reform.
Thus, in 1986 the Party launched a
comprehensive reform called Doi Moi. The
basic viewpoints of Doi Moi were: i) to develop
a multi-sectoral economy; ii) to shift the
economy from a planned centralized, state
subsidized mechanism to a socialist-oriented
market economy under management of the
state; iii) to enhance foreign economic
efficiency on the basis of expanding economic
cooperation to the countries in the region and
the world; and iv) to democratize all fields of
the socio-economic life, to implement
administration reforms, to improve people’s
living standard and to build a good welfare
system.
3.1. Economic reform under Doi Moi
The start of the reform was applying a set of
microeconomic reforms to agriculture in the
late 1980s. The most important measure was
the introduction of Directive No. 10 in 1988,
which formally de-collectivized agriculture.
The reform further went beyond the contract
system. The quota system on household
production was eliminated, allowing farmers to
make all decisions regarding resource
allocation, production and sales. Crop and input
prices were liberalized. Land tenure had been
given to the farmers in 1988. Next to the land
reform, the new land law was passed by in
1993, which classified those farmers who had
right to use land distributed to them for 20 years
and the right could be renewed. This gave more
opportunities to farmers to sell or mortgage the
rights to use their land (World Bank, 1993:
chapter 2).
In the industry sector, there were only few
reforms initially as there was no attempt to
reform and privatize the state owned enterprises
(SOEs). However, private economic activities
bloomed in informal commercial and service
sectors. SOEs had been granted more autonomy
by primarily removing the role of planning
targets in the decision making processes. Of
greater importance in the reforms in this period
were the efforts to strengthen the economic role
of the private sector. Prior to the Doi Moi, the
private sector had not played a significant role
in the transition process. Another important step
was the elimination of the state monopoly of
foreign trade in 1988, allowing the
establishment of Foreign Trade Organizations
(FTOs) and permitting some firms to engage
directly in international trade outside the FTOs.
The economy had been opened to foreign direct
investment (FDI) by the introduction of the first
law on foreign investment in 1987.
There were strong economic responses to
market-oriented reforms. Macroeconomic
imbalance again continued to undermine the
economy. During the 1986-1989, inflation was
extremely high, at 487%, 301%, and 394% in
respective 1986, 1987 and 1988. The cause of
this imbalance was perhaps the deficits of the
public sector. The rapid expansion of credit
resulted in a sharp increase in prices. The
higher the rate of inflation was, the more people
shifted from Vietnamese dong to use dollars
and gold, which was circulating freely at the
time. This behavior had triggered further
economic instability. The inflation also
undermined international competitiveness, with
the dong significantly overvalued in real terms.
The trade balance was also at high deficit, up to
about 10% of GDP in 1989 (Ministry of Trade,
1990). Although trade with the non-socialist
countries covered only 26.8% of import bills
over this period as compared to 31% over the
period between 1981-1985 (Phong and
Beresford, 2000).
Under the pressure of an impending crisis,
the government decided to accelerate the
transition process with combination of
structural reform and stabilization measures.
N.H. Hoang / VNU Journal of Science, Economics and Business 26, No. 5E (2010) 11-23
16
The main structural reform (adopted in 1989)
was the elimination of price control and state
procurement system. The dual pricing system
under the three-plan system in industrial reform
destroyed both efficiency and stability. Firms
were to sell at low prices and they then had to
be financed by credit from the central bank.
This led to the creation of money and, as a
result, inflation.
Facing extremely high rates of inflation, the
country adopted the stabilization program in
1989. Two key components of the program
were to raise and to stabilize interest rates, and
devaluate and unify the exchange rate
(4)
. In this
period, the central planning was abandoned.
The authorities readily implemented an IMF
type stabilization program without IFM
funding. The program called, among other
things, for a tight monetary policy, a reduction
in government spending, deeper, more profound
market liberalization, the introduction of user
fee for publicly provided services, the
broadening of the tax system, and a drastic
devaluation of the dong (Ljunggen, 1993;
Fforde and van Vylder, 1996). As a result,
inflation was almost brought to a halt by mid
1989. Credit continued to grow but there was a
substantial portfolio shift from dollars and gold
to dong assets.
In parallel with these measures, in order to
reduce the government deficits perhaps caused
by the growth of the public sector spending, the
government chose to raise taxes and to reform
the public sector. In fact, the tax base in
Vietnam was very weak. Most of government
revenue was from taxing the SOEs, and the
price reform undermined the profitability of
______
(4)
Vietnam had a dual exchange rate system prior to the
intensive reform in 1989: the official exchange rate and
the swap rate. The official exchange rate referred to the
exchange rates between Vietnamese Dong and other
foreign currencies, as set by the State Bank of Vietnam.
Whilst, the swap rates were the rate applied for the
purpose of facilitating purchase and sale of foreign
currencies between two business entities at non official
rates. These swap rates were determined by market supply
and demand.
these enterprises. The only way that the
government was able to bring the budget deficit
down was to cut government spending and to
cut short the credit subsidized to the SOEs, to
improve the fiscal burden and budget deficits.
In this process, the government launched the
SOE reforms program called equitization in
1989. Before Doi Moi, the country had over
12,000 SOEs. The economic performance of
these SOEs lagged as they lacked incentives to
be more efficient and profitable. Accumulated
bad debts of poor performing SOEs led to
increased fiscal burdens and budget deficits that
caused a protracted problem
(5)
to the
Vietnamese government.
In the process of SOEs restructuring, there
were a large number of workers left the sector,
and the number of SOEs considerably declined
to 1,997 in 2003 from 12,000 in 1989. These
policies gradually brought the expansion of
credits under control. In two years, 1990 and
1991, they reduced the deficits by 6% of GDP
by cutting subsidies to state enterprises,
reducing investment programs, constraining
wage increases to below inflation, and also
demobilizing one-half million soldiers. As a
result, money growth was under control, and
inflation was cut down to a single-digit level. In
1995 domestic credit increased by 20.3%, none of
which went toward the budget, credit to state
firms increased by 16.7%, and credit to the private
sector increased by 37.2%. All these policies
along with restrained monetary policy succeeded
in bringing inflation down to a one digit figure.
______
(5)
In his speech at the National Conference for
accelerating SOE reform on March 14 2004, PM. Phan
Van Khai said: “Not many SOEs are profitable. The taxes
collected from SOEs are just VND 8 billion while the state
budget is VND 87 billion. SOEs’ bad debts are high as
8.5% while the average rate for the economy is just 6.1%.
Total receivable and payable debts of SOEs are VND
300,000 billion (US$ 20 billion), more than 50% of
Vietnam’s GDP. I have had to settle bad debts of SOEs at
least twice since I was Deputy PM. After just settling
VND 18,000 billion, I found another VND 18,000-19,000
billion bad debt “returning”. If this situation continues, the
growth rate of the economy will be affected.”
N.H. Hoang / VNU Journal of Science, Economics and Business 26, No. 5E (2010) 11-23
17
Another important element in Vietnam’s
successful stabilization program was the
export’s growth. Vietnam was critically
dependent on some key imported inputs as steel
and fertilizer, which came mainly from the
Soviet Union and other socialist countries in the
Eastern Europe. However, the fall of the Soviet
Block has negative impacts on import of these
inputs. Shortage of foreign exchange propelled
the government to strive for a proper solution as
further liberalization of trade and devaluation of
dong to stimulate the growth of export to earn
more foreign exchange to promote input’s
import. As a fact, Vietnam was known as one of
the transition economies most open to foreign
trade and investment (Desai, 1998).
These reforms have brought successes to
the economy. The liberalization in agriculture
has transformed the country from a rice
importer to one of the largest rice exporters in
the world. Rice output increased around 25%
per year that played an important role and had a
very positive impact on exports to convertible
currency areas. Further, as a crude oil exporter,
when oil became the most rapidly growing
export in 1992, it contributed substantially to
the country’s export’s growth. Nevertheless,
industrial sector still played a very small role in
export, accounting for just 13% of total export
in 1992 (Ministry of Trade, 1993). Increases in
export of industrial products partly help the
country to solve the problem of foreign
exchange and partly meet the demand for
import of inputs. With the effectiveness of the
first foreign investment law, the FDI was
blooming in Vietnam during 1990s (Table 2).
3.2. The consequences of economic reforms on
macroeconomic performance
The Doi Moi brought about tremendous
successes to the economy. Certainly, its
achievements exceeded what the reformers
imagined when they launched the Doi Moi. To
go through the achievements by the reform, we
examine its outcomes in different stages of
development.
3.2.1. Economic achievements during the
1986-1993 period
Despite the severe recession in the second
half of 1980s, the economy showed the sign of
recovery and started to grow in the late 1980s
helped by solutions from the government in its
attempt to improve economic management,
monetary and agricultural policies. As Table 2
reveals, on average, GDP increased by 3.9% per
year during this period, per capita GDP
increased 2% during 1986-1988, and 4.8%
during 1989-1993 despite skyrocket increase in
consumer price, which rose to 365.3% per
annum during 1986-1988.
Table 2: Selected Macroeconomic Indicators, 1986-1993
Indicators 1986-1988 1989-1993
Growth rate (% per annum)
Real GDP 4.4 6.5
Per capita real GDP 2.0 4.8
Inflation (CPI) 365.3 38.9
Unemployment rate 14.6 12.7
As a share of GDP
Gross investment 8.4 16.4
National saving -1.4 11.3
Government deficit 5.9 4.9
Current account balance -9.8 -5.1
Per capita staples production 296 332
Sources: GSO of Vietnam and the World Bank Vietnam: various years
N.H. Hoang / VNU Journal of Science, Economics and Business 26, No. 5E (2010) 11-23
18
Since the late 1980s, there have been
evidence of positive changes, especially in
agriculture. As mentioned, in 1988 the
government put forward the new regulation not
to fix farm output quotas to each household,
and to consider each household as an economic
unit. This new regulation brought positive
changes in the food grain production. Instead of
having to import 450,000 tons of food as in
1988 and before, Vietnam became one of the
rice exporting countries one year later in 1989,
and became the world third biggest rice
exporter in 1990 with export volume reaches
1.5 million tone. In the industrial sector, key
industries as electricity, laminated steel, cement
and crude oil attained fairly good growth. These
improvement in export helped reduce the ratio
of import-export 28%, gradually reducing the
trade deficit. The ratio of export to import
during the 1986-90 was 1/1.8 in comparison
with 1/4 during 1976-1980. Another great
success was that inflation had been kept under
control and driven back from 774.7% in 1986 to
67.4% in 1990.
In short, the successes of the renovation in
the 1986-1993 period were a recovery of
production, a growing economy and rolled-back
inflation. More importantly, there was a
fundamental shift to a new management
mechanism as application of market-oriented
system and private ownership, implementation
of trade liberalization and multi-sectoral
economy. FDI started to accrue into the country
to help boosting production, generating income
and employment and improving people living
standard. However, it took the country almost 5
years more to get rid of the social-economic
crisis which broke out in the first half of 1980s.
3.2.2. From 1994: period of high economic
growth
With the achievements attained during the
1986-1993 period, the country’s confidence had
been boosted. The government continued to
work out the strategy toward stabilizing and
developing socio-economic conditions, putting
forward the orientation and tasks for the period
thereafter. The major setbacks for the economy
in the end of 1980s and early 1990s were the
protracted economic embargo imposed by the
US while the Eastern European countries were
facing crises during transitional period. These
factors has had negative impacts on the
economy. Total foreign trade turnover to these
countries sharply decreased as trade turnover in
1991 was accounting for only 15.1% of that in
1990. However, it was of great advantage that
the renovation started to have effectiveness;
economic units were gradually adapted to the
new management mechanism. Achievements in
this period are as follows:
1. Fundamental mechanism changes: There
were multiple sectors functioning in the economy
as state-run, state capital, private capital,
cooperative, individual, etc. in which non state-
run sector accounted for 60% of GDP. Economic
sectors were handed with rights of land use and
export-import activities. The state-run sector,
however, was still given special attention to help
it play the decisive role in the economy.
2. Economic structure reform: In pursuing
the high rate of growth, the country continued
the reform in economic structure. To do this,
the government paid attention to raise the
proportion of service and industry, steadily
reduce that of fishing, forestry, and agriculture.
Economic structure began to shift towards
establishing essential areas, industrial zones,
export processing zones and areas specialized in
industrial plants, etc.
3. Inflation was kept under control and
driven back: With the development of
production, convenient commodities circulation
and anti-inflation experiences from several
years before, prices were gradually stabilized.
Prices of goods and services increased by 67%
in 1991, 5.3% in 1993, and only 4.5% in 1996.
4. Establish commercial relations with
more than 120 countries helped increase trade
turnover by more than 20% a year. Non-refund
aids and loans for social-economic development
by many countries and international
organizations have been granted. Total ODA
N.H. Hoang / VNU Journal of Science, Economics and Business 26, No. 5E (2010) 11-23
19
loan to Vietnam during 1994 -1997 was 8.53
billion USD. In the field of FDI, during 1988-
2008, there were nearly 5,000 projects licensed
with total capital of approximately 80 billion
US dollars (Ministry of Planning and
Investment, 2005).
The achievements resulting from intensive
reform had further created stability and
fundamental changes in the economy. As a
result, fair and high economic growth rate has
been attained for over last 15 years, unlike other
transitional economies in Eastern Europe and
the former Soviet Union as these economies
experienced a dramatic decline in the initial
period of transition (Ivaschenko, 2001).
Vietnam was considered as a success story with
high rates of economic growth without any
decline, macroeconomic stability, stable prices,
and increasing annual rate of employment over
the years despite a marginal slump in a very
short time in 1986-87 when GDP growth
reduced to 0.7% from the level of 2.3% in one
year earlier
(6)
. Since 1990, GDP growth rate in
the country was always sustained at high level.
During the first half of 1990s, the average GDP
growth rate was kept at 8.2% annually. In
addition, the economy was also registered a
very impressive annual growth rate of
employment and a low level of inflation rate.
As Table 3 shows, during 1996-2008, the rate
of economic growth was always more than 7%
on average, and employment rate increased
during the period by about 2 to 5%. The growth
performance of Vietnam has been among the
best transitional economies both in Eastern
Europe and Asia. Meanwhile, as shown in
Table 3, year-on-year changes in consumer
prices kept at a single digit. Stable and low
inflation rate for over last 10 years indicate
stability in the domestic market. However, there
is change recently caused by the global crisis
that shows inflation rose to double digit (12.6%
in 2007 and 23.9% in 2008).
These successes of Doi Moi during the last
two decades have changed people’s welfare.
The economy had sustained a fair growth rate
from the beginning years before attaining a very
high rate of growth for nearly last 20 years. We
cannot deny the fact that there were also
negative impacts on the people’s welfare as
people lost their job during the SOEs reforms,
which negatively affected the people’s income
and household welfare. However, the benefits
gained from the reforms have surpassed the
loss. As shown in Table 4, the GDP per capita
increased almost 4 times during the 1997-2008
period which led to a sharp fall in the poverty
rate over times. According to VLSS surveys
conducted in 1993, 1998, 2002, 2004 and 2006,
the poverty rate was respective 59%, 37%,
29%, 19%, and 14.8%.
Table 3: Selected macroeconomic indicators: 1996-2006
Indicators ‘96 ‘98 ‘99 ‘00 ‘02 ‘03 ‘04 ‘05 ‘06 ‘07 ‘08
Real GDP growth rate (%) 9.3 5.7 4.8 6.8 7.0 7.1 7.5 8.4 8.2 8.5 6.3
Changes in consumer price (%) n.a 9.2 4.0 7.0 3.8 4.0 9.0 8.4 8.0 na na
Employment (changes in %) 2.2 2.1 2.1 2.0 3.5 4.2 5.0 5.3 5.4 5.8 5.2
Inflation rate (%) 4.5 9.2 0.7 5 2.9 3.0 2.7 8.9 7.8 12.6 23.9
Unemployment rate (%) 5.8 6.8 6.7 6.4 6.0 5.7 5.6 5.3 4.8 4.6 5.4
Note: n.a indicates data are not available.
Sources: General Statistical Office, various years.
(6)
______
(6)
Before 1988, Vietnam’s national accounts were calculated using the Net Material Product System (MPS). Subsequently,
Vietnam followed the System of National Accounts (SNA) and has calculated GDP in 1989 market prices for 1988. The MPS
data for the pre-1988 period excluded some services counted as part of GDP in SNA. More importantly, production data were
aggregated using the rather arbitrary fixed prices of 1982.
N.H. Hoang / VNU Journal of Science, Economics and Business 26, No. 5E (2010) 11-23
20
4. Changes in people’s welfare
Vigorous economic growth for the last 20
years has brought changes to living conditions
and people’s welfare in Vietnam. Over the last
two decades, per capita income had increased
almost four times and poverty sharply reduced.
In parallel, the state of welfare distribution in
the country has also changed. It would not be
surprising, given such a good economic
performance, to see that many economic and
social indicators have improved considerably
during the period. Table 4 illustrates the extent
of the improvement in a range of welfare
indicators showed all the indicators have been
improved. The second row of the table shows
the real GDP per capita consumption has
increased close to six times between 1992-93
and 2004-05. The poverty rate has also declined
considerably, from 58% in 1992-93 to only
14.8% in 2007-08. Other key welfare indicators
representing education, health and basic needs
have also improved indicates a better welfare
for people in the country.
Table 4: Key welfare indicators during Doi Moi
Indicators 1992/93 1997/98 2004/05 2007/08
GDP per capita consumption (USD)
180
311 720 1024
Poverty rate 58.1 37.4 19.5 14,8
Lower secondary enrolment rate (%) 30 62 90 92
Doctors per thousand population (doctor) 26 38 50 55
Child malnutrition (%) 50 34 26 21
Adult malnutrition (%) 32 27 19 15
Access to clean water (%) Rural 17 29 40 48
Urban 60 75 81 87
Source: General Statistics Office of Vietnam
Consequently, the improvement in welfare
indicators have raised questions to those
concerned about how the patterns of welfare
distribution and how welfare inequality have
evolved during the Doi Moi. Previous studies
on household expenditure distribution using
Gini index have found the increasing trend in
household expenditure inequality (Dollar et al.,
1998; Binh Nguyen et al., 2003; World Bank
and the GSO, various years). Initial estimates of
the Gini for income and expenditure inequality
representation for different income categories
(Table 5) show the increasing trends of income
inequality. In Table 5, we computed Gini
coefficient for various types of income and
expenditure in order to represent a picture that
shows the pattern of income and consumption
of the people in the country. These breakdown
calculations would further help people
understand the way the people spend on their
food, non food items. As the breakdown Gini
has shown, inequality in total income increases
over the times but it is more moderate than the
inequality in non-wage income but inequality in
non-farm income has declined between 2002
and 2004 and increased in 2006 and in 2008. In
the case of expenditures, as statistics reveal,
inequality in total expenditure has increased
over the times but that of non-food expenditure
and durable consumption declined from 1992 to
2006 but increase in 2008 and Gini for non-
durable consumption has increased. These
findings reflect the consumption patterns of
people in Vietnam as the country records a
faster growth, economic situation is improved.
As a result, people’s income increases which
leads to increase in their living standard. It is in
line with the consumption behavior theory as
that people consumption pattern changes
towards spending more on luxury good when
they become rich.
N.H. Hoang / VNU Journal of Science, Economics and Business 26, No. 5E (2010) 11-23
21
Table 5: Gini coefficients for overall inequality in income and expenditures
Gini coefficients 1998 2002 2004 2006 2008
Total income - 0.409 0.414 0,423 0,431
Income excluding wage - 0.496 0.498 0,504 0,509
Non-farm income - 0.609 0.570 0,573 0,592
Total expenditure 0.351 0.368 0.372 0,389 0,401
Non-food expenditure 0.505 0.481 0.472 0,470 0,486
Durable consumption 0.634 0.596 0.564 0,552 0,557
Non-durable consumption 0.336 0.351 0.360 0,373 0,393
Source: Own calculation, based on data from VLSS 97/98, VHLSS 2002, VHLSS 2004 and VLSS2006.
In order to understand fully about the
relationship between the economic growth and
welfare inequality presented by the composite
index of welfare calculated from various key
welfare indicators provided in Table 4 for the
period 1990-2008, we estimate a simple linear
growth model, which takes the form:
iiiii
XIyg εγλβα ++++=
(1)
Where g
i
is annual GDP growth rate of
province i, y
i
is logarith per capita GDP of
province i in the begining year of the studied
period, I
i
is welfare inequality of province i
presented by composite Gini of key welfare
variables in Table 4, and X
i
is matrix of the
control independent variables that affect
economic growth such as public investment,
human capital and variables that affect social
welfare such as dependent rate of province i
(8)
.
Table 6: Estimation results of equation
Dependent variable: g
i
Independent variables 1998 2002 2004 2006 2008
y
i
-0.647 -0.416 -0.408 -0.401 -0.396
I
i
1.899 1.948 1.956 1.971 1.972
x
1
4.189 4.240 4.217 4.219 4.206
x
2
0.0005 0.0006 0.0006 0.0007 0.0006
x
3
-2.587 -2.698 -2.734 -2.795 -2.668
Source: Author
Results provided in Table 6 pointed out that
the rate of GDP growth is positively correlated
with welfare inequality, public investment, human
resources but negatively correlated with the initial
level of logarithm per capita income and
dependent rate. These findings are conformity
with the literature of economic development
which stated that in the beginning of economic
development, the rate of economic growth and
welfare inequality are proportionally correlated. In
addition, public investment and human resources
are important factors contributed to economic
growth. Further, high level of initial per capita
income and high rate of dependency may
negatively affect the rate of economic growth.
5. Summary and conclusion
In this paper we provided an overview of
the Vietnam’s economic development process
since the country’s reunification in 1975. In
1976 the country started to apply the soviet
model already existing in the North to the
South. The main economic mechanism was
centrally planning. However, this economic
model performed poorly. The economy was in a
severe downturn at the end of the 1970s and the
beginning of 1980s. The growth during this
period was low, even minus. Inflation was very
high and protracted. Trade and government
deficits were high. All major macroeconomic
N.H. Hoang / VNU Journal of Science, Economics and Business 26, No. 5E (2010) 11-23
22
indicators indicated a stagnant economy. The
agricultural and industrial production was low
that led to food shortages for many years in the
1980s despite the agrarian based country. The
entire economy was in an impasse.
In the midst of the recession, the
government launched a comprehensive reform
program in 1986 to strive for overcoming the
crisis and stabilizing the macroeconomic
condition. Initially, the reforms were a step to
partly abandon the central planning. However,
because the old mechanism did not completely
give way to the market-oriented system, the
economy still faced a downturn in the second
half of the 1980s despite the initial recovery
recorded. However, the Doi Moi succeeded in
getting the process of institution building and
marketization on track. The government, once
again, took a step further to push up to the more
intensive reform in the early 1990s. The
intensive reforms had been carried out in
agriculture, industry, foreign trade and pricing.
The trade was liberalized and the economy
completely opened to the outside world for
foreign trade and investment.
As the reforms took effects, the economy
started to grow in the beginning of 1990s. High
rates of economic growth have been recorded in
nearly last 20 years. The country has become
the second biggest rice exporter in the world.
Vietnam has been considered as a potential and
prospect destination for foreign investment with
macroeconomic and political stability and other
advantageous conditions. As a consequence,
people’s incomes almost tripled over the last
ten years and the living standard of the people
substantially lifted.
Achievements recorded over the last 20 years
of economic reforms in Vietnam had tied down to
all aspects of the socio-economic changes, and
therefore there is no way for Vietnam to drive
away from a market oriented economy
mechanism. Hopefully, new significant changes
in policy direction and reform implementation
toward more openness would be made in Vietnam
in years to come in order to switch the economy
toward complete market system for freer
mechanism and higher growth. The prevailing
institutional limitations and constraints mean that
there is still a large space for Vietnam to change
in order to meet expectation of the initial reforms
as to create a stable and strong market economy in
its socialist orientation. In addition, the social and
investment policies should concentrate more on
reducing welfare disparities and promote future
sustainable growth.
References
[1] Congress of the Communist Party of Vietnam
(1976), Official Documents of the Congress,
National Political Publisher, Hanoi.
[2] Dacy, D. (1986), Foreign Aid, War and Economic
Development: South Vietnam, 1955-1975,
Cambridge, Cambridge University Press.
[3] Fforde, A. and S. de Vylder (1996), From Plan to
Market: The Economic Transition in Vietnam,
Boulder, The Westview of the Press.
[4] Government of Vietnam-Donor-NGO Poverty
Working Group (PWG) (1999), Vietnam: Attacking
Poverty, Hanoi, World Bank.
[5] Epprecht M. and A. Heinimann eds. (2004),
Socioeconomic Atlas of Vietnam. A Depiction of the
1999 Population and Housing Census, Swiss
National Centre of Competence in Research
(NCCR) North-South, University of Berne. Berne.
[6] Ljunggen, B. (ed.), (1993), The Challenge of
Reform in Indochina, Cambridge, Mass: Harvard
University Press.
[7] Nghia, L.X., Van Donge and Litvack, J. (1999),
Fostering High Growth in a Low Income Country:
Program Aid to Vietnam, Stockholm: Sida.
[8] Phong, D. and M. Beresford (2000), Economic
Transition in Vietnam: Trade and Aid in the Demise
of a Centrally Planned Economy, London: Edward
Elgar (Table 2.10).
[9] Sepehri, A. and A H. Akram-Lodhi (2002), A
Crouching Tiger? A Hidden Dragon? Transition,
Saving and Growth in Vietnam, 1975-2006,
Working Paper 359, the University of Manitoba,
Winnipeg, Canada R3T 2N2.
[10] World Bank (1990), Vietnam: Vietnam Stabilization
and Structural Reforms, Washington, the World
Bank.
[11] World Bank (2001), Vietnam Economic Monitor
Spring 2001, hppt://www.worldbank.org.vn/rep30.
[12] World Bank (2004), Vietnam, Vietnam
Development Report, Washington, the World Bank.
N.H. Hoang / VNU Journal of Science, Economics and Business 26, No. 5E (2010) 11-23
23
Tăng trưởng kinh tế và những biến đổi về phúc lợi xã hội
trong thời kỳ cải cách kinh tế ở Việt Nam
TS. Nguyễn Huy Hoàng
Viện Nghiên cứu Đông Nam Á,
Số 1, Liễu Giai, Ba Đình, Hà Nội, Việt Nam
Tóm tắt: Hơn 20 năm qua, với chính sách cải cách kinh tế hay còn gọi là “đổi mới”được áp dụng
một cách toàn diện, kinh tế Việt Nam đã đạt được một bước khá dài trong chặng đường phát triển của
mình. Tăng trưởng kinh tế cao, đạt bình quân từ 7-8%/năm trong gần suốt hai thập kỷ đã làm cho thu
nhập bình quan đầu người tăng mạnh, từ mức 180 USD trong những năm đầu của thập niên 90 của thế
kỷ trước lên tới gần 1200 USD trong năm cuối cùng của thập niên đầu tiên của thế kỷ 21. Cùng với sự
tăng mạnh của thu nhâp bình quan đầu người là sự cải thiện đang kể mọi mặt cuộc sống và phúc lợi
của người dân như các chỉ số về giáo dục, y tế…đã được cải thiện. Tuy nhiên, tăng trưởng và phát
triển trong thời gian qua cũng đã làm cho cách biệt giàu nghèo giữa các tầng lớp trong xã hội và giữa
các vùng có chiều hướng tăng lên. Bằng việc sử dụng phương pháp phân tích định tính kết hợp với
phân tích số liệu theo kiểu giải thích (data explanatory analysis) và sử dụng hệ số bất bình đẳng Gini
tính cho các nguồn thu nhập của người dân cũng như mô hình tăng trưởng thể hiện sự tương quan giữa
tăng trưởng và bất bình đẳng thu nhập, bài nghiên cứu này đã chỉ ra sự thay đổi thu nhập bình quân
đầu người ở Việt Nam trong thời kỳ từ 1998 đến 2008. Kết quả nghiên cứu cho thấy rằng nhìn chung
bất bình đẳng thu nhập ở Việt Nam (bất kể là từ nguồn thu nhập nào) đang có xu hướng tăng lên cùng
với sự phát triển của nền kinh tế. Một kết quả nghiên cứu nữa dựa vào việc ước lượng mô hình tăng
trưởng là tỷ lệ tăng trưởng kinh tế có quan hệ tỷ lệ thuận với bất bình đẳng thu nhập.