Aging and decision making: a comparison between neurologically healthy elderly and young individuals ppt
Bạn đang xem bản rút gọn của tài liệu. Xem và tải ngay bản đầy đủ của tài liệu tại đây (189.24 KB, 16 trang )
Journal of Economic Behavior & Organization
Vol. xxx (2004) xxx–xxx
Aging and decision making: a comparison between
neurologically healthy elderly and young individuals
Stephanie Kovalchik
a,1
, Colin F. Camerer
b,2
, David M. Grether
b,∗
,
Charles R. Plott
b,3
, John M. Allman
c,4
a
California Institute of Technology, MSC 323, Pasadena, CA 91125, USA
b
California Institute of Technology, MSC 228-77, Pasadena, CA 91125, USA
c
California Institute of Technology, MSC 216-76, Pasadena, CA 91125, USA
Received 17 March 2003; accepted 15 December 2003
Abstract
We report the results of experiments on economic decisions with two populations, one of healthy
elderly individuals (average age 82) and one of younger students (average age 20). We examine
confidence, decisions under uncertainty, differences between willingness to pay and willingness to
accept and thetheory of mind (strategic thinking).Our findings indicatethat the olderadults’ decision
behavior is similar to that of young adults, contrary to the notion that economic decision making is
impaired with age. Moreover, some of the demonstrated decision behaviors suggest that the elderly
individuals are less biased than the younger individuals.
© 2004 Elsevier B.V. All rights reserved.
JEL classification: D00; D80; D81
Keywords: Age; Overconfidence; Willingness to pay/accept; Endowment effect; Theory of mind; Game theory;
Risk-taking
∗
Corresponding author. Tel.: +1 626 395 4068; fax: +1 626 405 9841.
E-mail addresses: (S. Kovalchik), (C.F. Camerer),
(D.M. Grether), (C.R. Plott), (J.M. Allman).
1
Tel.: +1 626 395 6800; fax: +1 626 795 1547.
2
Tel.: +1 626 395 4054; fax: +1 626 405 9841.
3
Tel.: +1 626 395 4209; fax: +1 626 793 8580.
4
Tel.: +1 626 395 6805.
0167-2681/$ – see front matter © 2004 Elsevier B.V. All rights reserved.
doi:10.1016/j.jebo.2003.12.001
2 S. Kovalchik et al. / J. of Economic Behavior & Org. xxx (2004) xxx–xxx
1. Overview
Though it is widely recognized that the population of the United States is aging, much
of our current understanding in the field of individual decision making is based on data
from student populations. While this could be a consequence of subject availability, it may
reflect acommon thoughlargely unsubstantiatedbelief thatdecision makingability declines
with aging (Peters et al., 2000). Many older individuals are productive and intellectually
viable throughout their lives. Still, others are vulnerable to dementia and neurodegenerative
illnesses, such as Alzheimer’s disease. Our objective in this study is to begin to characterize
the relationship between economic decision behavior and aging.
How well older people make economic decisions is an important issue for social policy.
Since wealth tends to accumulate over one’s lifetime, a large portion is in the hands of older
people. Both long-term trends (increased longevity) and short-term trends (baby booms)
mean that increasing proportions of the population are older and retired. Also, older people
are more likely to vote than young people are, so they may have disproportionate political
influence.Itisconceivablethat ourscientificmodel ofeconomic decisionmaking,so heavily
rooted in studies of 20-year-old students, is a misleading guide to the behavior of older
people.
We studiedfour typesof decisionswith apotentialforageeffects.Onefeatureof wisdom,
which presumablyisacquired over alifetime, is meta-knowledge, accuratelyknowing one’s
own knowledge and abilities. We assessed this through self-reported confidence on answers
to trivia questions. A common stereotype of older people is that they are “conservative,
dislike taking risk, and are set in their ways”. We tested this stereotype using choices over
monetary gambles similarto those performed bypsychologists and biologists; themonetary
gambles include incomplete and complete information designs (i.e., where probabilities are
known ex ante or unknown). A third group of experiments explored possible differences
in willingness to pay and willingness to accept. In these experiments, the choices involved
valuations of everyday objects (e.g. a coffee mug). It has been suggested that observed
differences are due to an asymmetry of preferences between losses and gains that might be
exacerbated by age. Finally, both younger and older subjects participated in beauty contest
games, in which strategic thinking plays a central role. In each case, the experiments were
taken from the literature allowing us to focus on age differences rather than on theories
behind the experiments.
2. Subject population and general experimental design
We interviewed two age groups: a young population (ages 18–26, 51 percent female)
and an elderly population (ages 70–95, 70 percent female). The older subjects (N= 50)
serve as controls for the Alzheimer’s Disease Research Center at the University of Southern
California. Based on annual cognitive and behavioral testing, the older individuals are
considered neurologically healthy having no history of dementia or mental illness. The
student population (N= 51) consisted of healthy undergraduates from a junior college near
California Institute of Technology. The younger participants have between 12 and 16 years
of formal education. The older population is highly educated relative to their age group, 78
S. Kovalchik et al. / J. of Economic Behavior & Org. xxx (2004) xxx–xxx 3
percent have more than 12 years of education and 60 percent have 16 or more years. As
otherpopulationsofolder adults(e.g.individualswithParkinson diseaseorother ailmentsor
people inassistedlivingarrangements)maybemore difficultto study, wechose apopulation
of healthy high-functioning individuals for our first attempt to study decision making in the
elderly.
Each subjectcompleted an individuallyadministered interview,involving awritten ques-
tionnaire and several interactive tasks. Onaverage, subjectsofboth populations took 50min
to complete the interview. For all areas of the investigation involving monetary rewards,
real cash was used. This method of collecting data is expensive, but for many populations
of older adults living outside of retirement communities, individual interviews may be a
necessary burden. The same method was used for all subjects to avoid confounding age
with the method of data acquisition.
3. Confidence
Research suggests that non-expert individuals are typically overconfident; they overes-
timate the quality of their own abilities or knowledge (Svenson, 1981; Weinstein, 1980)
and state extreme probabilities more often than they should. Work in economic theory, par-
ticularly with business-related forecasting, has provided further support for this behavioral
phenomenon (Camerer and Lovallo, 1999).
The reasons for overconfidence when answering trivia questions are a subject of in-
tense debate among decision theorists (Ayton and McClelland, 1997). Three prominent
explanations have emerged. One argument is that it is an illusion created by asymmetrically
misleading itemsininvestigation methods(Juslin, 1994; Gigerenzeret al., 1991).For exam-
ple, one questionusedwas: which city isfarther northRome or New York? MostAmericans
claim that the correct answer is New York, and are quite confident, even though that answer
is incorrect.Soll (1996)found thatoverconfidencepersists even whenquestions aresampled
randomly. Some contend that overconfidence results from subjects basing their answers on
a reasonable probability but responding with error, which biases their reported probabilities
in the direction of overconfidence (Erev et al., 1994). Wallsten and Gonzales-Vallejo (1994)
found overconfidence after adjusting forthissource of bias. A third explanation is that over-
confidence is a cognitive bias due to anchoring on an intuitive answer or snap judgment and
adjusting insufficiently for the ways in which the answer could be wrong (Kahneman and
Tversky, 1996). An important qualification is that many expert populations such as weather
forecasters (Murphy and Winkler, 1984), blackjack dealers and others (Camerer, 1995, pp.
590–592), and highly experienced subjects in repeated games do not show overconfidence
in their fields of expertise.
We investigated confidence by providing subjects with 20 trivia questions on diverse
subjects (appendices will be available on the JEBO website). Each subject answered the
same set of 20 general knowledge questions. All questions had two possible answers. Sub-
jects were instructed to select an answer and then provide a confidence assessment (50, 60,
70, 80, 90 or 100 percent) of their choice. Older subjects did somewhat better, answering
74.1 percent of the questions correctly, while 66.1 percent of answers given by the younger
subjects were correct.
4 S. Kovalchik et al. / J. of Economic Behavior & Org. xxx (2004) xxx–xxx
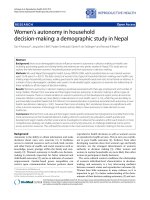
Fig. 1. Proportion of correct responses (±standard error of mean (S.E.M.)) for a given confidence level out of the
total responseswith thatconfidence. Thewidth ofeach bubble reflects the percentage of responses that were given
at each confidence level out of the total responses. Exact percentages for response distribution are labeled next
to bubbles for each population.
*
The hypothesis that the proportions correct are the same is rejected at P<0.05.
**
The hypothesis that the proportions choosing this response are the same is rejected at P < 0.05.
For bothgroups we combinedall the answersin which subjectsgavethesame confidence
assessment and calculated how often they were right. Good calibration means that the
fractionofcorrectanswers shouldbe aboutequal tothestatedconfidencelevel.For example,
on questions where subjects said they were 80 percent confident, they should be right about
80 percent of time. If subjects are well calibrated,thenagraph of the percent correct against
the confidence levels should lie near a 45
◦
line. Points below the line would represent
overconfidenceandpointsabovewould showunderconfidence. Fig.1containsthesescatters
for both older and younger subjects, along with standard errors and significance tests for
differences in accuracy and in distribution of responses.
Both groups of subjects display overconfidence at some levels, and neither group
shows underconfidence at any level. Older subjects’ assessments are significantly more
accurate at 60 percent (P<0.05) and 70 percent (P< 0.01) reported degrees of con-
fidence. The older subjects do exhibit overconfidence when reporting confidence lev-
els of 80 and 90 percent (17 percent of their total responses), but younger subjects
are overconfident at all the intermediate levels of reported confidence (48 percent of
their total responses). One interpretation of these results is that older subjects have
learned through experience to temper their overconfidence and, thus, look more like ex-
perts.
The groups also differed in their response distributions. The younger subjects spread
out their responses across the confidence levels: half of their selections were evenly dis-
tributed among the intermediate confidence levels. In the older subjects, the majority of
the responses were given with either 100 or 50 percent confidence (in calibration terms,
their assessments had “higher resolution”). While older subjects reported a confidence of
S. Kovalchik et al. / J. of Economic Behavior & Org. xxx (2004) xxx–xxx 5
100 percent significantly more often than the younger subjects (P<0.025), they made sub-
stantially fewer selections with 60–80 percent confidence (P <0.05 for each group). The
percentage of correct responses when reporting 100 percent confidence was about the same
forthetwogroups (94percent correctfor theolderpopulationand92 percentfor theyounger
subjects).
4. Decision making under uncertainty
Two gambling tasks are employed. The first task is a modified version of the card-deck
gambling task of Bechara et al. (2000) that has been used extensively in the biology and
psychology literature.
In the modified gambling task, subjects selected cards from one of two decks to earn
cash. The cards were pre-organized so that one deck (A) had an overall loss of $2.50
every 10 cards and the other deck (B) had an overall gain of $2.50 every 10 cards. All
the cards in deck A gave $1.00 on every turn but were occasionally accompanied with
losses, $7.50 for example (for a net loss of $6.50). The other deck B gave a smaller
gain for each card, +$0.50 but had smaller occasional losses. Subjects did not know the
composition of the decks (given in Appendix B). Subjects were instructed to select the
top card of one of the decks, and that they could switch between decks at any time dur-
ing the task. Each subject selected 50 cards one at a time, but was not informed in ad-
vance about the total number of draws. Deck A has a lower mean payoff and higher
variance than deck B. Since subjects do not know the composition of the decks, there
is no optimal strategy. In the neuroscience literature the choice of deck A is treated as a
mistake.
Bechara et al. conducted their gambling task with a population of healthy adults and a
population of individuals with damage to the ventromedial prefrontal cortex (VM). They
found that the VM patients, unlike the healthy adults, did not gradually shift their choices
to the more advantageous deck B. Other studies employing Bechara’s design have found
that individuals with damagedorbitofrontalcortex have an impaired abilityatadapting their
deck preferences to deck B in comparison to control subjects (Damasio, 1994). Denburg
et al. (1999) administered this task with a population of healthy older adults and argued that
the older individuals behave similarly to the frontal-lobe-damaged subjects. Our results do
not confirm this finding.
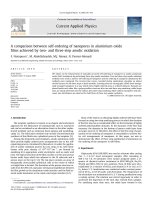
Consistent with the results of the Bechara study, our subjects gradually concentrated
their choices on deck B (Fig. 2). The beginning phase of the task was an exploratory period
in which bothpopulations sampled eachdeckequally.Forthe next 20draws subjects shifted
towards deck Bdrawing on average 8 of the20 cards from deckA.In the final 10drawsboth
groups largely abandoned deck A: on average the younger subjects chose deck A two times
of 10 and the older subjects chose deck A three times of 10. In summary both populations
appear to have adapted the same way to the payoffs.
In our second gambling experiment, subjects were asked to make six choices. For each
choice subjects had to select one of two decks of 10 cards. Unlike the Bechara et al.
experiment, subjects saw the payoffs from each of the 10 cards in the pair of decks before
making their selection. Once they decided which deck they wanted, the 10 cards were
6 S. Kovalchik et al. / J. of Economic Behavior & Org. xxx (2004) xxx–xxx
Fig. 2. The plot indicates the results for the median number of cards selected from deck A, the deck with high
variance and negative expected value (−$2.50 per interval). Selections from deck B would simply be 10 minus
those of deck A. Subjects with no switching behavior were removed from the data pool. The difference in the
number of choices in the final 10 draws is not significant (P-value 0.14).
shuffled and the subjects selected one card. In all six choices one of the two decks had
a positive mean payoff, and the other deck had a non-positive payoff. The deck with the
positive average payoff had a smaller variance. A total of six choices were given to 36 of
the older subjects (this task was added after the first 14 interviews were completed) and 51
of the student subjects. The decks used are shown in Appendix B.
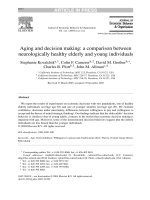
We do not see significant differences in behavior of the younger and older subjects.
Somewhat surprisingly subjects more often than not chose the lower average payoff decks.
Among older subjects, 58 percent chose the lower payoff decks on four or more of the six
choices,while59percent ofthe youngersubjects didso(Table 1andFig.3).The proportions
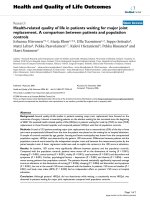
were similar across age groups for each of the six different deck pairs. Older women were
significantly more likely than older men to choose the lower mean, higher variance decks
(Fig. 4). Of the 54 choices made by the older male subjects, 17 were of the lower average
payoff decks while the older females chose those decks on 96 of their 162 choices. This is
the only significant gender effect we found in any of the tasks studied. We tested whether
there were any order effects of previous winning or losing draws, but found no significant
effects.
Table 1
Percentage of subjects preferring low payoff deck
Lotteries
123456
Older subjects 64 (N = 50) 56 (N = 50) 66 (N = 50) 53 (N = 36) 53 (N = 36) 36 (N = 36)
Young subjects (N = 51) 55 67 63 73 61 47
The table shows the percentage of subjects in each of the populations who chose the lower average payoff deck.
Percentages areshown foreach of thesix lotteries.For eachlottery,participants weregiven the optionto randomly
select one card from one of two decks, composed of 10 cards of varying monetaryreward/loss. In each lottery, one
deck had zero or negative expected value and one had positive expected value and smaller variance. Appendix B
shows the exact deck compositions that were shown to participants.
S. Kovalchik et al. / J. of Economic Behavior & Org. xxx (2004) xxx–xxx 7
Fig. 3. Each subject was given six choices. The plot indicates the percentage of subjects against the number of
times thedeck with alower average payoffand largervariance was chosenout of thesix choices.
*
Mann–Whitney,
P < 0.10.
Fig. 4. Choices by elderly men and women. The plot indicates the percentage of subjects against the number of
times the lower payoff, higher variance deck was chosen out of the six choices. Mann–Whitney test showed the
difference is significant (P<0.01).
5. Willingness to pay/willingness to accept asymmetry
Observed differences between stated willingness to pay (WTP) for an item and willing-
ness to accept payment (WTA) for the same item have been a subject of extensive research.
In previous investigations of this behavior, individuals have been divided into two groups:
sellers and buyers. The sellers are given an item and told that they are its owners. They are
then asked to indicate the minimum they would accept to sell the item, the WTA. Buyers
are shown the same item and are asked to indicate the maximum they would be willing to
pay for the item, the WTP. The consistent tendency for the WTA to be greater than the WTP
is the asymmetry that has attracted the attention of economists.
8 S. Kovalchik et al. / J. of Economic Behavior & Org. xxx (2004) xxx–xxx
The observed differences between willingness to pay and willingness to accept have
been labeled an “endowment effect”, intimating that the phenomena is due to loss-aversion
over the domain of choices (Thaler, 1980; Tversky and Kahneman, 1991). The theoret-
ical idea is that an individual who owns a good anticipates a loss from the sale and,
thus requires a higher payoff than the individual would pay to acquire the good if it
were not owned (Kahneman et al., 1990, 1991; Knetsch, 1989; Knetsch and Sinden,
1984). In other words, the willingness to accept (WTA) exceeds the willingness to pay
(WTP).
Some recent experiments support a claim that the observed differences between will-
ingness to pay and willingness to accept are related to experimental procedures and have
nothing todo withpreference asymmetries(Plott andZeiler, 2003)orareeliminated bytrad-
ing experience (List, 2004). Older people are often presumed to be more conservative and
more likely to avoid risk. If this is true, then it would seem natural to expect loss avoidance
to be stronger in the older populations. Alternatively, it may be that older people having ex-
perienced the loss of many everyday items have learned that such losses are not that serious
and do not show an endowment effect. In either event, by testing for an asymmetry between
WTA and WTP using the procedures of Plott and Zeiler to avoid confusion, we are able
to test endowment effect theory and to investigate possible preference differences between
young and old under circumstances that could exacerbate these differences if endowment
theory is correct.
In our experiments, subjects were interviewed one at a time and each subject performed
in one of two roles: seller or buyer. For each round, sellers were told that they own the item
in front of them (buyers were shown the item, but not told that they own it). Each subject
was then asked to report his/her value for the item. Each seller was instructed to offer the
minimum they would accept to give up the item, while buyers were instructed to offer the
maximum they would be willing to pay for the item. The subject’s offer was then compared
to a fixed offer. The fixed offer was randomly determined and not based on the actual value
of the item (Becker et al., 1964). For sellers, if WTA was less than or equal to the random
offer, they gave up their item and received the amount of the random offer. If the WTA was
greater, they kept the item. For buyers, if the WTP was greater than or equal to the random
offer, they purchased the item for the amount of the random offer. If the WTP was less than
the amount of the random offer, they kept their money. Subjects were informed that the
fixed offers had been determined by a random method that would be revealed at the end of
the interview (Plott and Zeiler, 2003).
There were a total of three rounds in the task. The first two were hypothetical and the last
was the actual round. A pen and a picture frame were used in the hypothetical situations,
and a coffee mug was used for the actual situation. Only the actual round had a real payoff,
either the mug or the cash value of the fixed offer.
On thethird roundwhen eachsubjecthad determinedtheir offer,they wroteit onan index
card and place it inside an envelope (both items were provided) along with the amount of
the WTA or WTP. Each subject was informed that the interviewer would not know his/her
offer or outcome. This was done to ensure that the subject’s offer was anonymous and not
influenced by the presence of the interviewer. The subjects subsequently received either the
mug or the return of their money in the mail.
S. Kovalchik et al. / J. of Economic Behavior & Org. xxx (2004) xxx–xxx 9
Table 2
Statistics for WTA/WTP [mean, median (S.D.)]
Round
Hypothetical 1 (pen) Hypothetical 2 (frame) Actual (mug)
Older WTA (N=25) 8.84, 3.5 (17.82) 6.61, 7 (3.74) 2.48, 2.5 (1.7)
Older WTP (N = 25) 5.13, 3.95 (6.12) 9.34, 6.5 (6.21) 3.25, 2 (3.04)
Younger WTA (N = 26) 2.2, 1.5 (3.2) 7.46, 5 (8.63) 3.88, 2.38 (4.88)
Younger WTP (N = 25) 1.62, 1.25 (1.12) 4.98, 4 (3.59) 2.24, 2 (1.75)
The data shows themean, median(standard deviation) for the WTAs (seller offers) and WTPs (buyer offers). Data
for each of the three rounds and the items used are given. Only the actual round used real cash. For the actual
round the difference between the WTA and WTP prices within each group is not significant (P > 0.25).
The data exhibit no significant differences between WTA and WTP in either group
(Table 2). Thus, for these findings, endowment effect theory must be rejected. We also
conclude that there is no significant difference between the young and the old.
Excluding the difference of reference states, the experimental design was identical for
both the seller and buyer groups. The median seller price is higher than the median buying
price for each sample. In the actual round, the coffee cup round, the median offer price
for the sellers in the older population is $2.50, and the median buyer price was $2.00. In
the student population, the median seller offer is $2.25, and the median buyer offer was
$2.00. These differences are not significant for either group (P >0.25). Pooling the young
and older subjects gives an insignificant difference between WTA and WTP. The median
offer price of sellers is slightly higher for the other rounds, excluding the first hypothetical
round for the older subjects. Thus, in both groups the results are consistent with those of
Plott and Zeiler.
6. Strategic thinking
In many situations a decision maker’s outcome does not depend on his or her own
choice alone but upon the choices of others. Investing in the stock market, crossing an
intersection where there is opposing traffic, and playing poker are all examples. A game
known as the “p-beauty-contest” has been widely used in economic studies to examine
some of the simplest principles of interdependent decision making (Nagel, 1995; Nagel
et al., 1999; Stahl, 2001). In the “p-beauty-contest” game, subjects select a number in
the range [0,100], and the winner is the individual whose selection is closest to a propor-
tion of the average of all the numbers selected. In our design, we used p= 2/3. Since the
winning number hinges on the average of all the numbers selected, the subject needs to de-
termine the numbers other players will choose, having been told that others are trying to do
the same.
The simplest strategy is to assume that other people choose randomly and therefore the
average will be around 50. In this case the best decision would be to choose a number
that is (2/3) 50 or 33, yet whether the subject continues with this rationale he or she will
consider that the other subjects may also use this strategy and therefore the average would
10 S. Kovalchik et al. / J. of Economic Behavior & Org. xxx (2004) xxx–xxx
decrease, becoming (2/3) 50. In this case, the best strategy is to choose the number that is
(2/3)
2
50 or 22. This line of strategies can be viewed as progressive steps of reasoning, the
strategy of each step being given by 50(2/3)
n
. In dozens of studies with students, business
executives, and individuals responding to newspaper experiments, the evidence has shown
that people’s choices are limited to the first, second, and sometimes third steps of iterative
reasoning. Formal models that assume an average of 1.5 steps generally predict better than
conventional equilibriumconcepts when people face a game forthe first time (e.g., Camerer
et al., in press).
Giventhat thinkingstepshavebeenshowntobemodestlycorrelatedwith theefficiencyof
working memory (measured by digit span; see Devetag and Warglien, 2003) and aging may
reduce working memory or, potentially, some other cognitive process related to strategic
reasoning, these changes could lead older subjects to use lower values of n and to choose
higher numbers than younger subjects.
For the actual task, participants were told that they would be playing with nine other
individualsfromtheirresearch populationwhohadgonethroughidenticalproceduresbefore
providing their numbers. A written questionnaire was used to outline the game procedures
and to inform participants that the winner of the competition would earn 20 dollars, which
would be sent as cash by US mail after the winner had been determined (within 2 weeks of
interview).
Our results show that both the old and young samples behave similarly on this task.
The majority of responses are clustered around the first step (50(2/3) =33) and the second
step (50(2/3)
2
= 22) of reasoning (Fig. 5). Overall the behavior for this task is very similar
Fig. 5. The plot shows the total number of subjects and number selections for the p-beauty contest (theory of
mind task). Players try to choose a number close to 2/3 times the average of 10 numbers provided by participating
subjects. The values in the left column are the “stems” or the tens digit, and the values on the right list the digits.
Each numerical response is therefore 10 times the left column stem plus the middle or right column “leaf” value.
For example, the most extreme guesses were 4, given by a younger subject, and an 86 given by an older subject.
Values greater than 50 may indicate confused responses. Older subjects were more likely to give aresponse above
50 (P < 0.07).
S. Kovalchik et al. / J. of Economic Behavior & Org. xxx (2004) xxx–xxx 11
for both populations. High responses (over 50), perhaps reflect confusion. The number of
responses above 50 is somewhat greater for the older subjects (6 out of 33 responses above
50), than for the younger subjects (3 of 51 responses above 50). After the first 17 interviews
were conducted, the instructions were changed because of a high incidence of possibly
confused responses. Revised instructions were used for 33 of the older subjects and all of
the younger ones.
7. Summary and conclusions
We conducted four sets of experiments using 50 high functioning neurologically healthy
older subjects (average age 82) and 51 healthy students (average age 20). The experiments
were chosen on two criteria. First, we used experiments that a priori seemed likely to
elicit different responses from the two groups. Second, we wanted experiments that had
been used in the economic, psychological or neuroscientific literatures so that we could
concentrate on observed behavior of the two subject pools rather than on justifying the
particular experiments or the theories supporting them.
Thegeneralconclusionisthattheperformanceof thetwogroupsof subjectsisremarkably
similar. With one exception we do not observe significant differences by gender.
Elderly individuals demonstrate highly accurate meta-knowledge evaluations. The dis-
tribution of responses shows that older individuals more frequently respond that they are
completely certain (100 percent) or completely unsure (50 percent) than do the younger
subjects. These results support the view that older individuals have more accurate beliefs
about their knowledge and its limitations.
Evidence from the gambling experiments contains no significant differences in the be-
havior of young and old subjects. In the gambling task with incomplete information, by
the third 10-draw interval, both populations demonstrate a preference for the higher paying
deck. The two populations exhibit no difference in tendencies. Thus, our findings largely
disagree with Denburg et al. who report that older adults have tendencies similar to patients
with frontal-lobe damage. However, in the final 10-draw interval the older subjects chose
the lower paying deck more often than the younger subjects (but not significantly so), con-
sistent with Denburg et al. Whether or not experiments with larger number of draws would
become consistent with the Denburg et al. results cannot be determined without further
experiments.
Inthe gamblingtaskswith fullinformation,the averagetendencyof theolderand younger
groups was to make proportionately more choices from the lower average payment and
higher variancedecks thanwas observedin theincompleteinformation task.The tasksdiffer
on two major dimensions, complete versus incomplete information and one draw versus
repeated draws. In the complete information experiments it is possible that choice could be
sensitive to the format in which the information is displayed as suggested by regret theory
(Loomes and Sugden, 1982). Explanations along these lines cannot be confirmed without
more experiments. We do not offer an explanation for the difference, but do emphasize that
the observed behavior is the same in both populations.
From ourinvestigation, onegenderdifferenceisidentified. Olderfemalesare more likely
to select the low payoff high variance deck than are older males.
12 S. Kovalchik et al. / J. of Economic Behavior & Org. xxx (2004) xxx–xxx
Economic studies tend to show that the financial choices of men are more risk-seeking
than those of women, an observation that has been frequently attributed to overconfidence
amongmales (Barberand Odean,2001;PowellandAnsic, 1997;Prince,1993).The majority
of economic studies focus on younger subject populations for which the distribution of risk
behavior may be different from that of an elderly population.
The gender gap in life expectancy, observed across cultures, has been linked to higher
incidences of risk behavior (substance abuse, violence, and suicide) among men in both
biological and psychological research (Allman and Hasenstaub, 2000; Girard, 1993; Thom,
2003). Thiscouldaccountforthe observedconservatismamongsurvivingmenand,also,the
disproportionate representation of females in the neurologically healthy elderly population.
Further research is required to determine whether the effects observed in our data are
representative of that population.
In our investigation of the WTP and WTA difference, we found that there was not a
significant difference between the median offer price of the seller and buyer groups in
both the old and young populations (although the older subjects named higher prices in the
hypothetical rounds,bothas buyers andas sellers). We adoptedthe experimental procedures
of Plott and Zeiler who found no significant difference between WTA and WTP. Our results
are consistent with theirs.
We began this work as a pilot study to determine the feasibility of systematically study-
ing cognitive process in older individuals. Our sample size is necessarily small as the data
collection method was time consuming and expensive. Overall, the findings of this compar-
ative study, including the results from the beauty contest task, present compelling evidence
for the stability of decision making behavior with age, the choices of the 80 year olds and
20 year olds are generally the same time. Aside from a minor propensity to make more con-
fused responses on the theory of mind task (the beauty contest game), there is no evidence
of impairment in the reasoning and choices of the elderly population we studied on any of
the areas of the survey. This is in itself an important finding, since it is a widely held notion,
even among decision researchers, that decision making faculties decline with aging. Our
results counter this notion and show that decision behavior is robust for at least a subset of
the healthy elderly population. At the same time, there are some intriguing differences that
should beinvestigatedin furtherresearch. Giventheincreasingsizeoftheelderlypopulation
in the United States and their share ofpersonalwealth,additional timely studies are needed.
Acknowledgments
We thank Dr.Gail MurdockandDr.LindaClark, fromtheAlzheimer’sDiseaseResearch
Center, who coordinated the recruitment of the older population and provided demographic
data for these subjects. We also thank Kathy Zeiler for her assistance with the loss-aversion
methodology, as well as Neda Afsarmanesh for her involvement in the questionnaire de-
sign. The financial support of the National Science Foundation, the Summer Undergraduate
Research Fellowship at the California Institute of Technology, the Arthur R. Adams Fel-
lowship, and the David and Lucile Packard Foundation are gratefully acknowledged.For
their reading of and helpful responses to early versions of our paper, we thank an Associate
Editor and an anonymous referee.
S. Kovalchik et al. / J. of Economic Behavior & Org. xxx (2004) xxx–xxx 13
Appendix A. Trivia questions
All questions were presented in the same format as question 1.
1 The population of Los Angeles is
3,400,000 4,500,000
How confident are you in the answer you have chosen?
50% 60% 70% 80% 90% 100%
Order Question Answer choices
2 Abraham Lincoln was president from (1861–1865, 1862–1866)
3 The present chief justice of the Supreme
Court
(John Ashcroft, William
Rehnquist)
4 The population of London is (10,000,000, 7,000,00)
5 In what country is the Cannes film festival
held?
(Canada, France)
6 What musical features the songs “Amer-
ica” and “Maria”?
(West Side Story,A Chorus
Line)
7 Which is a natural satellite of Earth? (Moon, Sun)
8 What do a penny,nickel, dime, and quarter
add up to?
($0.41, $0.51)
9 What does the acronym TWA stand for? (Trans West Airlines,Trans
World Airlines)
10 Which actress won an AcademyAward for
her role in Shakespeare in Love?
(Julia Roberts, Gwyneth
Paltrow)
11 Who played Green Bay in the first Super
Bowl?
(KansasCityChiefs,Wash-
ington Redskins)
12 What is the birthstone for May? (Diamond, Emerald)
13 What does an anemometer measure? (Wind Speed, Humidity)
14 What are Cygnus, Pegasus, and Phoenix? (Egyptian gods,
constellations)
15 Who had “the face that launched a thou-
sand ships”?
(Helen of Troy, Cleopatra)
16 On a traditional clock, which number is
180 degrees from 5?
(1, 11)
17 Which of these words is a participle? (What, Following)
18 Which is the title of a Jane Austen novel? (Emma, Wuthering
Heights)
14 S. Kovalchik et al. / J. of Economic Behavior & Org. xxx (2004) xxx–xxx
Order Question Answer choices
19 What does the architectural feature known
as an atrium traditionally lack?
(Ceiling, Frames)
20 Whichofthese artistspainted TheScream? (Edvard Munch, Edgar
Degas)
Appendix B
Gambling task deck design (incomplete information)
Card order A B Card Order A B
1 + 1.00 +0.50 26 +1.00 +0.50
2 +1.00 +0.50, −1.00 27 +1.00, −6.00 +0.50,
0.500
3 +1.00, −2.00 +0.50 28 +1.00 +0.50
4 +1.00 +0.50 29 +1.00 +0.50, −1.00
5 +1.00, −7.50 +0.50, −1.00 30 +1.00 +0.50
6 +1.00 +0.50, 31 +1.00, −11.00 +0.50, −1.50
7 +1.00, +0.50 32 +1.00 +0.50
8 +1.00, −3.00 +0.50 33 +1.00 +0.50
9 +1.00 +0.50, −0.50 34 +1.00, −1.50 +0.50
10 +1.00 +0.50 35 +1.00 +0.50, −.50
11 +1.00 +0.50 36 +1.00 +0.50
12 +1.00, −6.00 +0.50 37 +1.00 +0.50, −.50
13 +1.00 +0.50 38 +1.00 +0.50
14 +1.00, −1.00 +0.50, −1.00 39 +1.00 +0.50
15 +1.00, −4.50 +0.50 40 +1.00 +0.50
16 +1.00 +0.50, −1.00 41 +1.00 +0.50
17 +1.00 +0.50, −0.50 42 +1.00,−3.50 +0.50, −2.00
18 +1.00, −1.00 +0.50 43 +1.00 +0.50
19 +1.00 +0.50 44 +1.00 +0.50, −.50
20 +1.00 +0.50 45 +1.00, −5.00 +0.50
21 +1.00 +0.50, −0.50 46 +1.00 +0.50
22 +1.00, −6.50 +0.50 47 +1.00, −4.00 +0.50
23 +1.00 +0.50, −0.50 48 +1.00 +0.50
24 +1.00 +0.50 49 +1.00 +0.50
25 +1.00 +0.50 50 +1.00 +0.50
S. Kovalchik et al. / J. of Economic Behavior & Org. xxx (2004) xxx–xxx 15
Gambling task decks (complete information)
Choice 1 Choice 2 Choice 3 Choice 4 Choice 5 Choice 6
ABCDEF GHI J KL
+1.00 +0.50 +1.00 +3.00 +1.00 +4.00 +2.00 +1.00 +4.00 +1.00 +1.00 +0.50
+1.00 +0.50 +0.50 +2.00 +0.50 +2.00 +2.00 +0.50 +1.00 +1.00 +1.00 +0.50
+1.00 +0.50 +0.50 +2.00 +0.50 +2.00 +2.00 +0.50 +1.00 +0.50 +1.00 +0.50
+1.00 +0.50 +0.50 +1.00 +0.50 +1.00 +1.00 +0.50 +1.00 +0.50 +1.00 +0.50
+1.00 +0.50 +0.50 +1.00 +0.50 +1.00 +1.00 +0.50 +1.00 +0.50 +1.00 +0.50
+1.00 +0.50 +0.50 +1.00 +0.50 +1.00 +1.00 +0.50 +1.00 +0.50 +1.00 +0.50
+1.00
+0.50 +0.50 +1.00 +0.50 +1.00 +1.00 +0.50 +1.00 +0.50 +1.00 +0.50
+1.00 +0.50 0.00 −2.00 −0.50 −22.00 −2.00 0.00 −3.00 −0.50 +1.00 +0.50
−4.00 0.00 −0.50 −3.00 −0.50 −4.00 −4.00 −0.50 −4.00 −0.50 −4.00 0.00
−4.00 −0.50 −0.50 −6.00 −0.50 −7.00 −4.00 −0.50 −4.00 −0.50 −4.00 −0.00
References
Allman, J., Hasenstaub, A., 2000. Caretaking, risk-seeking, and survival in anthropoid primates. In: Robine, J.,
Kirkwood, T.B.L., Allard, M. (Eds.), Sex and Longevity: Sexuality, Gender, Reproduction. Springer Verlag,
Parenthood, New York, pp. 75–89.
Ayton, P., McClelland, A.G.R., 1997. How real is overconfidence? Journal of Behavioral Decision Making 10,
279–285.
Barber, B.M., Odean, T., 2001. Boys will be boys: gender, overconfidence, and common stock investment. The
Quarterly Journal of Economics 116 (1), 261–292.
Bechara, A., Damasio, H., Damasio, A.R., 2000. Emotion, decision making and the orbitofrontal cortex. Cerebral
Cortex 10, 295–307.
Becker, G., DeGroot,M., Marshak, J., 1964. Measuringutility by asingle-response sequential method. Behavioral
Science 9, 226–232.
Camerer,C.F.,Lovallo,D.,1999.Overconfidenceandexcessentry: an experimentalapproach.American Economic
Review 89, 306–318.
Camerer, C.F., 1995. Individual decision making. In: Kagel, J.H., Roth, A.E. (Eds.), Handbook of Experimental
Economics. Princeton University Press, Princeton, pp. 587–616.
Damasio, A.R., 1994. Descartes’ error: emotion, reason, and the human brain. Grosset/Putnam Publishing, New
York.
Devetag, G.,Warglien, 2003.Games and phone numbers: do short-term memorybounds affect strategic behavior?
Journal of Economic Psychology 24 (2), 189–202.
Denburg, N.L., Bechara, A., Tranel, D., Hindes, A.R., Damasio, A.R., 1999. Neuropsychological evidence for
why theability todecide advantageously weakens withadvancing age.Society forNeuroscience Abstracts25,
32.
Erev,I., Wallsten,T.S.,Budescu,D.V.,1994.Simultaneous over-andunder confidence: the roleoferrorinjudgment
processes. Psychological Review 101, 519–527.
Gigerenzer, G., Hoffrage, U., Kleinb
¨
olting, H., 1991. Probabilistic mental models: a Brunswickian theory of
confidence. Psychological Review 98, 506–528.
16 S. Kovalchik et al. / J. of Economic Behavior & Org. xxx (2004) xxx–xxx
Girard, C., 1993. Age, gender, and suicide: a cross-national analysis. American Sociological Review 58 (4),
5553–5574.
Juslin, P., 1994. The overconfidence phenomenon as a consequence of informal experimenter-guided selection of
almanac items. Organizational Behavior and Human Decision Processes 57, 226–246.
Kahneman, D., Knetsch, J.L., Thaler, R.H., 1990. Experimental tests of the endowment effect and the coase
theorem. The Journal of Political Economy 98, 1325–1348.
Kahneman, D., Knetsch, J.L., Thaler, R.H., 1991. Anomalies: the endowment effect, loss aversion, and status quo
bias. Journal of Economic Perspectives 5, 193–206.
Kahneman, D., Tversky, A., 1996. On the reality of cognitive illusions. Psychological Review 103, 582–591.
Knetsch, J.L., 1989. The endowment effectandevidence of nonreversibleindifference curves.AmericanEconomic
Review 79, 1277–1284.
Knetsch, J.L., Sinden, J.A., 1984. Willingness to pay and compensation demanded: experimental evidence of an
unexpected disparity in measures of value. Quarterly Journal of Economics 99, 507–520.
List, J.A., 2004. Neoclassical theory versus prospect theory: evidence from the marketplace. Econometrica 74 (2),
615–625.
Loomes, G., Sugden, R., 1982. Regret theory: an alternative theory of rational choice under uncertainty. Review
of Economic Studies 53, 271–282.
Murphy, A.H., Winkler, R.L., 1984. Probability forecasting in meteorology. Journal of the American Statistical
Association 79, 489–500.
Nagel, R., 1995. Unraveling in guessing games: an experimental study. American Economic Review 85,
1313–1326.
Nagel, R., Boschi-Domenech, A., Satorra, A., Garcia-Montalvo, J., 1999. One, Two (Three), Infinity: Newspaper,
and Lab Beauty-contest Experiments in Economics Working Papers.
Peters, E., Finucane, M.L., MacGregor, D.G., Slovic, P., 2000. In: Stern, P.C., Carstensen, L.L. (Eds.), The Aging
Mind: Opportunities in Cognitive Research. National Academy Press, Washington, DC, pp. 144–165.
Plott, C.R., Zeiler, K., 2003. The willingness to pay/willingness to accept gap, subject misperceptions and ex-
perimental procedures for eliciting valuations. Social Science Working Paper no. 1132R Pasadena, California
Institute of Technology.
Prince, M., 1993. Women, men and money styles. Journal of Economic Psychology 14 (1), 175–182.
Powell, M., Ansic, D., 1997. Gender differences in risk behavior in financial decision-making: an experimental
analysis. Journal of Economic Psychology 18 (6), 605–628.
Soll, J., 1996. Determinants of overconfidence and miscalibration: the roles of random error and ecological
structure. Organizational Behavior and Human Decision Processes 65 (2), 117–137.
Stahl, D.O., 2001. Population rule learning in symmetric normal-form games: theory and evidence. Journal of
Economic Behavior and Organization. 45, 19–35.
Svenson, O., 1981.Are we allless risky andmore skillful thanour fellow drivers? ActaPsychologica 47, 143–148.
Thaler, R.H.,1980. Toward a positive theoryof consumer choice. Journal ofEconomic Behaviorand Organization
1, 39–60.
Thom, B., 2003. Risk-taking in men: substance abuse and gender. Health Development Agency, London, ISBN:
1-84279-148-6.
Tversky,A., Kahneman, D., 1991. Loss aversioninrisklesschoice:areference-dependentmodel.QuarterlyJournal
of Economics 106, 1039–1061.
Wallsten, T.S., Gonzales-Vallejo, C., 1994. Statement verification: a stochastic model of judgment and response.
Psychological Review 101, 490–504.
Weinstein,N.D., 1980. Unrealistic optimismabout future life events. Journal ofPersonalityand Social Psychology
39, 806–820.