Anatomy of a Health Scare: Education, Income and the MMR Controversy in the UK doc
Bạn đang xem bản rút gọn của tài liệu. Xem và tải ngay bản đầy đủ của tài liệu tại đây (764.92 KB, 58 trang )
IZA DP No. 3590
Anatomy of a Health Scare:
Education, Income and the MMR Controversy in the UK
Dan Anderberg
Arnaud Chevalier
Jonathan Wadsworth
DISCUSSION PAPER SERIES
Forschungsinstitut
zur Zukunft der Arbeit
Institute for the Study
of Labor
July 2008
Anatomy of a Health Scare:
Education, Income and the
MMR Controversy in the UK
Dan Anderberg
Royal Holloway University of London,
IFS, CEPR and CESifo
Arnaud Chevalier
Royal Holloway University of London,
CEE, GEARY and IZA
Jonathan Wadsworth
Royal Holloway University of London,
CEP and IZA
Discussion Paper No. 3590
July 2008
IZA
P.O. Box 7240
53072 Bonn
Germany
Phone: +49-228-3894-0
Fax: +49-228-3894-180
E-mail:
Any opinions expressed here are those of the author(s) and not those of IZA. Research published in
this series may include views on policy, but the institute itself takes no institutional policy positions.
The Institute for the Study of Labor (IZA) in Bonn is a local and virtual international research center
and a place of communication between science, politics and business. IZA is an independent nonprofit
organization supported by Deutsche Post World Net. The center is associated with the University of
Bonn and offers a stimulating research environment through its international network, workshops and
conferences, data service, project support, research visits and doctoral program. IZA engages in (i)
original and internationally competitive research in all fields of labor economics, (ii) development of
policy concepts, and (iii) dissemination of research results and concepts to the interested public.
IZA Discussion Papers often represent preliminary work and are circulated to encourage discussion.
Citation of such a paper should account for its provisional character. A revised version may be
available directly from the author.
IZA Discussion Paper No. 3590
July 2008
ABSTRACT
Anatomy of a Health Scare:
Education, Income and the MMR Controversy in the UK
*
One theory for why there is a strong education gradient in health outcomes is that more
educated individuals more quickly absorb new information about health technology. The
MMR controversy in the UK provides a case where, for a brief period of time, some highly
publicized research suggested that a particular multi-component vaccine, freely provided to
young children, could have potentially serious side-effects. As the controversy set in, uptake
of the MMR vaccine by more educated parents decreased significantly faster than that by
less educated parents, turning a significant positive education gradient into a negative one.
The fact that the initial information was subsequently overturned and the decline in uptake
ceased suggests that our results are not driven by other unrelated trends. Somewhat
puzzling, more educated parents also reduced their uptake of other non-controversial
childhood vaccines. As an alternative to the MMR, parents may purchase single vaccines
privately; the MMR is the only vaccine for which we observe a strong effect of income on
uptake.
JEL Classification: H31, I38, J12
Keywords: childhood vaccinations, health outcomes, education
Corresponding author:
Arnaud Chevalier
Department of Economics
Royal Holloway, University of London
Egham, Surrey TW20 0EX
United Kingdom
E-mail:
*
The authors would like to thank NatCen for providing additional data from the Health Survey for
England. We also thank Jerome Adda, Amanda Gosling, and seminar participants at the Tinbergen
Institute, Kent, Rouen, Maynooth, Royal Holloway, IFS, Bristol, Bologna, St. Andrews, CEP, SOLE,
and NBER for numerous helpful comments.
I Introduction
In February 1998 a paper was published in the highly respected British medical journal The
Lancet. The article reported on twelve children, referred to the Royal Free Hospital in London,
with developmental disorders and a set of bowel symptoms, and suggested a link between autism
and the particular gastrointestinal pathologies. While the paper did not claim to have proven any
link between the syndromes and the measles, mumps and rubella (MMR) vaccine, the parents
of eight of the twelve children blamed the combined vaccine, saying that the symptoms had set
in days after receiving the immunization. In the press conference before the publication and in
a video release issued to broadcasters Dr Andrew Wakefield, who led the research, suggested
that there was a case for administering the three vaccines separately until further research could
rule it out as an environmental trigger. Between 1998 and 2002, the claim of a potential link
between the particular vaccine and autism was reiterated on a number of occasions by Wakefield.
While the government consistently tried to reassure the public about the safety of the vaccine,
confidence in the multi-component vaccine declined (see below). Following the initial publication
and subsequent coverage by the media, the uptake of the MMR also declined sharply, dropping
by over ten percentage points in five years, before eventually picking up again. However, by
2003, a substantial body of research had failed to verify any link between the MMR and autism
and the emerging consensus among researchers was that the vaccine was safe to use.
The case of the MMR controversy provides an interesting case where, for a relatively short
period of time, some research, publicized in the media, suggested a potential risk of serious
side-effects associated with a standard medical procedure and where there was a sharp behav-
ioral response. We consider the controversy from the perspective of health inequalities and the
diffusion of information on advances in medical knowledge.
A large literature has documented the positive link between individuals’ education and their
health outcomes.
1
Indeed, a small number of recent studies, mainly using school leaving age
reforms as instruments, have found evidence of a causal link running from education to health.
1
A literature review is provided in the next section
2
One of the hypotheses to receive recent attention in the economics literature is that more edu-
cated individuals have better understanding of, and more quickly absorb, advances in medicine.
The ideal setting to study this hypothesis empirically is situations where new health related
information becomes available.
We thus consider whether and how the reaction to the controversy, in terms of vaccine uptake
behavior, differed among groups of parents with different levels of education and income. The
case of the MMR controversy provides a useful case for studying individuals’ behavioral responses
to new information for several reasons. First, a set of childhood vaccines are provided free of
charge through the National Health Service (NHS); hence parents can either accept or reject
them at no monetary cost.
2
Second, the controversy took place over a relatively short period
and the response was strong; moreover, the fact that the initial information was subsequently
overturned and the decline in uptake ceased gives us confidence that our results are not driven
by other unrelated trends.
3
Finally, the information coming from different sources regarding
the safety of the MMR vaccine was, at times, contradictory; experimental evidence (Viscusi,
1997) suggests that individuals may give undue weight to high risk information while low risk
information, especially when provided by the government, is underweighted.
For our main analysis we use data on the uptake of the MMR, and other childhood im-
munizations, at the Health Authority area level for the years 1997 to 2005, which we combine
with corresponding data on the characteristics of the local populations obtained from the Health
Survey for England (HSE). We find that the uptake rate of the MMR among parents who stayed
on in education past the age of 18 declined by around ten percentage points more than that
for less educated parents over the period 1998 to 2003; most of the relative decline in uptake
also appear to have occurred during the early stages of the controversy when media attention
was relatively low. We also find, however, that the same group of parents reduced their relative
2
There are no vaccination requirements in the UK. This contrasts e.g. with the USA where children must have
proof of immunization or immunity to certain infectious diseases before they can start school.
3
It is also known that the trend in aggregate uptake behavior mirrored the trend in parents’ perceptions of
the safety of the vaccine (see below).
3
uptake of other “uncontroversial” childhood immunizations, suggesting a “spillover” effect from
the MMR controversy.
After analyzing the area level data, we also consider data from the Millennium Cohort Survey
(MCS) which follows a set of children born in the UK within a twelve month period starting in
September 2000. These children were due the MMR vaccine at the height of the controversy and
the survey therefore provides an excellent opportunity for studying in more detail the behavior
of parents at that point in time. Analysis of this data allows us to confirm that there was,
at the peak of the controversy, a negative education gradient in the uptake of the MMR after
controlling for a range of other potentially confounding individual characteristics. Among all the
vaccines freely provided through the NHS, the MMR is the only vaccine for which we observe a
significant negative effect of income on uptake. The MCS also allows us to explore which parents
purchased alternatives to the MMR in the private market.
The outline of the paper is as follows. Section II provides a background, including a research
and media timeline. Section III describes the area-level data and the trends in the uptake of
childhood immunizations. Section IV presents the results from the analysis of this data while
Section V provides further evidence based on the cohort survey data. Finally, Section VI provides
a discussion.
II Background
Literature Review
Two theoretical models are often invoked to explain why there may be a causal effect of education
on health outcomes. The production efficiency hypothesis (Becker, 1965) states that human
capital is effectively a factor of production that allows the individual to obtain a better outcome
given a set of inputs. This would imply that more educated individuals would demand fewer
inputs into health production while still enjoying better health (Grossman, 2000). Indeed,
much of the literature associated with the production efficiency hypothesis is concerned with
estimating the demand for health inputs and in particular its relation to education. In contrast,
4
the allocative efficiency hypothesis argues that human capital is not a primary input into health
production — it is simply something that allows individuals to make better choices of input
mixes (Rosenzweig and Schultz, 1982). A few existing empirical tests of the allocative efficiency
hypothesis examine whether the more educated are quicker to absorb information about risks or
new medical technologies.
4
Lleras-Muney and Lichtenberg (2002) find that the more educated
are more likely to use drugs recently approved by the Federal Drug Administration, at least
among individuals who experience repeat prescriptions. In contrast, Goldman and Smith (2005),
focusing on hypertension drugs, find no effect of education on the adoption of new medical
technologies.
The identification strategy to testing the allocative efficiency hypothesis in our paper con-
cerns the reaction by different groups to information under uncertainty.
5
It is thus related to the
work of De Walque (2004) on the U.S. Surgeon General’s warning on the health risks associated
with smoking, and De Walque (2007) on the provision of AIDS information in Uganda. Both
studies find that more educated individuals reacted quicker to new information regarding risk.
One extra dimension in our case is that the risk information was “reversed” within a relatively
short period of time. This means that the reaction patterns that we observe are unlikely to
reflect long-run trends.
Any study of the links between education and several health outcomes (see Grossman (2006)
or Cutler and Lleras-Muney (2008) for recent surveys) has to deal with the issue that any
realized correlations between education and health may originate from three sources: i) a causal
effect of education on health, ii) a common factor explaining both the education and health
investment decisions (Fuchs, 1982), iii) reverse causality, where bad health as a child would
prevent educational investment (Case et al., 2005). Several studies have attempted to estimate
the causal effect of education by relying on natural experiments; see among others Arendt
4
Innovation in health technology could lead to a temporary increase in health inequality (Victora et al., 2000,
Glied and Lleras-Muney, 2008).
5
Education may alter access, quality or the interpretation of the information. Conditional on intensity of the
sources of information used, Blinder and Krueger (2004) find that education improves (economic) knowledge.
5
(2005) for Denmark, Lleras-Muney (2005) and Mazumder (2006) for the US, and Clark and
Royer (2007) for the UK. While the general view, expressed in the reviews of Grossman (2006)
and Cutler and Lleras-Muney (2008), is that there is a causal effect of education on health, the
accumulated evidence is mixed. Clark and Royer (2007) and Mazumder (2006) for example find
no significant impact of education. Moreover, instrumental variable methods often only identify
local average treatment effects, as typically the policy changes identifying the effect of education
affect only a specific population. As an alternative, Lundborg (2008) uses a representative sample
of monozygotic twins and a between-twin fixed effect model to control for genetic and family
characteristics, finding that compared to high school dropouts, other individuals have a higher
level of self-reported health and fewer chronic health conditions. Regarding the intergenerational
effect of education and health, Currie and Moretti (2003), Chou et al. (2007), and Chevalier and
O’Sullivan (2008) all report positive effects of maternal education on birth weight, in contrast
to the findings of Lindeboom et al. (2006).
A handful of papers in other disciplines have analyzed the determinants of the decision to
immunize children using the MMR vaccine, using datasets similar to ours. Middleton and Baker
(2003) use Health Authority (HA) data on MMR vaccination at age 2 over an earlier period
1991-2001 and report that MMR coverage fell faster in more affluent areas. However they
make no attempt to control for area fixed effects or time varying confounding characteristics
of the HA. Wright and Polack (2005) use the same dataset to estimate the determinants of
vaccinations in 1997 and 2003. They use the 2001 census to map local area level information on
deprivation and education and estimate that between these two years, areas with a greater share
of the population with no qualifications experienced less of a decrease in the MMR vaccination
rate. Pearce et al. (2008) use the MCS and report that failure to immunize is greater among
children with more educated mothers and among higher household incomes. However, they do
not account for many observable characteristics of the mother that may explain this correlation.
In short, while these papers find that more education and less deprivation are associated with a
reduction in the propensity to vaccinate with the MMR after the information on the potential
side-effect became available, they do not provide enough evidence that these associations are
6
not due to other characteristics.
The MMR Controversy and a Timeline
In this section we establish a timeline outlining how the MMR controversy developed in the
research literature and in the media. The timeline can be summarized as follows. Claims
that the MMR was potentially unsafe were made on four occasions between February 1998 and
February 2002 by Wakefield and coauthors. Research rejecting any link between the MMR and
autism was published in nearly all years, with the majority of studies being published between
2001 and 2003. The media has been identified as a key source of information used by parents
concerning potential side-effects of the MMR (Pareek and Pattison, 2000). The media covered all
claims of potential side-effects and the majority of the research rejecting such claims; moreover,
media coverage was particularly intense from spring 2001 through 2004.
A Research Timeline
The original paper (Wakefield et al., 1998), published in The Lancet in February 1998, reported
on twelve children referred to the Royal Free Hospital in London with developmental disorders.
The paper described a collection of gastrointestinal conditions said to be evidence of a possible
novel syndrome (subsequently referred to as “autistic enterocolitis”). While the paper suggested
that the connection between the bowel conditions and autism was real, it did not claim to have
proven any link between the MMR vaccine and autism. However, the parents of eight of the
twelve children claimed that the onset of the conditions had occurred within days of vaccination.
At the press conference before the paper’s publication, Dr Wakefield said that he thought it
prudent to use single vaccines rather than the triple vaccine until further research could rule it
out as an environmental trigger.
The claim of a potential link between the MMR and autism was repeated in April 2000
when Dr Wakefield (together with a colleague) presented further evidence at a US Congressional
Hearing showing that tests on 25 children with autism had revealed that 24 had traces of the
measles virus in their gut (U.S. House of Representatives, 2000). In a second journal article
7
published in the spring of 2001, Wakefield and Montgomery (2001) claimed that the MMR
vaccine had never undergone proper safety tests, and in a third journal article published in the
spring of 2002 Wakefield and others provided further evidence of the presence of measles virus
in gut samples from children with autism (Uhlmann et al, 2002).
Following the initial claim, a large number of studies, many from epidemiology, failed to
confirm any link between the MMR vaccine and autism in particular. Here we will mention only
a few of the main studies. One study (Peltola et al., 1998) traces, out all Finnish babies given
the MMR since its introduction in 1982, all those who developed gastrointestinal side-effects
lasting 24 hours or more. 31 children were identified and it was verified that all recovered and
none developed any signs of autistic disorders. Another study traced all children diagnosed with
autism within the North-East Thames region in the UK since 1979 and looked for evidence
of a change in incidence or age of diagnosis before and after the introduction of the MMR in
the UK in 1988; the authors found no evidence of any discontinuity or change in the trend, no
evidence of any differences in age of diagnosis between vaccinated and unvaccinated children,
and no evidence for any clustering in onset in the months after vaccination (Taylor et al., 1999).
Another research design compared the incidence of gastrointestinal disorders in children with
autism (prior to their diagnosis) to children without autism and found no differences (Black et al.,
2002). Other studies look for discontinuities in the incidence of autism in “natural experiments”
settings: e.g. Gillberg and Heijbel (1998) find no differences in incidence of autism among those
born before and after the introduction of the MMR vaccine in Sweden in 1982, while Honda et
al. (2005) consider the “reverse” experiment in Japan where, for reasons unrelated to autism
and bowel disease, the MMR vaccine was withdrawn in 1993, and find no evidence that this
reduced the upward trend in diagnosed cases of autism. Virological studies have similarly found
no evidence of persistent measles infection in autistic children (D’Souza et al., 2006).
These six studies are all included in the list below of the main studies rejecting a causal link
between the MMR and autism. That list contains an additional seven studies which are Kaye
et al. (2001), Farrington et al. (2001), Taylor et al. (2002), Donald and Muthu (2002), Madsen
8
et al. (2002), Miller et al. (2003), and Smeeth et al (2004).
6
There have also been a number of research reviews that have rejected any causal link between
the MMR and autistic spectrum disorders, most notably by the US Institute of Medicine of the
National Academies (2001, 2004), the American Academy of Pediatrics (Halsey et al. 2001), the
UK Medical Research Council (2001), and by Demicheli et al. (2005) for the Cochrane Library.
Sources of Information and Media Coverage
It is of interest to consider where parents obtain information about vaccinations. One of the
most authoritative studies to document parents’ sources of information is Gellin et al. (2000).
The authors conducted a telephone survey in the US with a nationally representative sample of
1,600 expectant parents and parents with young children in 1999. In response to an open-ended
question about sources of information (“Where do you get information about immunizations?”),
the most frequent answers were doctor (84.2%); other information sources were newspapers or
magazines (18.1%), books or journals (12.3%), a nurse (8.2%), a health clinic (7.5%), friends or
family members (7.3%), and the internet (7.0%). In the UK, Pareek and Pattison (2000) studied
sources of information in the particular context of the MMR using a cross-sectional survey of 295
mothers in Birmingham. They found that mothers consulted a wide variety of sources to obtain
general information about the MMR vaccine, including health professionals, friends, family, and
the media. In contrast, mothers predominantly acquired information about the potential side-
effects of the MMR vaccine from the media rather than from health professionals, with television
the most commonly cited source of information (cited by 35 percent of mothers).
Given this apparent importance of the media in the context of the MMR it is useful to
establish the volume and timing of media coverage as part of the general timeline. To this end,
we collected time-series statistics on the coverage of the controversy from the online editions
of BBC news and four major daily newspapers.
7
For each source we collected, through the
6
The list of main studies rejecting a causal link was compiled from the summaries of the research provided by
the NHS and the BBC.
7
The four main newspapers considered were the Guardian, the Independent, the Daily Mail, and the Telegraph.
9
internet, all articles relating to the controversy. For BBC news, articles are available online all
the way from the start of the controversy. For the newspapers, articles are generally available
online since 1999.
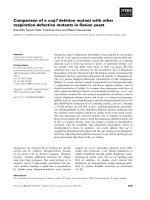
Figure 1 highlights the number of relevant articles, by quarter, appearing in BBC news online
in each of the years 1998 to 2006. The figure also highlights the timing of (i) the four claims of
a potential risk associated with the MMR noted above, (ii) the main research studies indicating
no causal effect of MMR on autism, and (iii) the four main research reviews noted above.
Figure 1: A timeline indicating the number of articles relating to the controversy appearing in
BBC news online and in four main newspapers, as well as the timing of the publications of the
main relevant pieces of research.
A noticeable feature of the timing of media’s coverage was the relatively small number of
articles appearing during 1998 and 1999 – a total of 15 articles appearing in BBC news online
over two years. This contrasts with the sharp increase in media coverage starting in the spring
10
of 2001, with 20 articles appearing in a single quarter. In terms of content, all four instances
of claims of potential side-effects were reported; indeed, the two spikes in media coverage in the
spring of 2001 and 2002 were sparked by the two publications appearing at those times (Wakefield
and Montgomery, 2001 and Uhlmann et al, 2002). The majority of the aforementioned main
studies finding no link between the MMR and autism were also reported.
Other issues covered include news on how the uptake changed, on the increased demand for
single vaccines, on government reassurances about the safety of the vaccine, on warnings about
future outbreaks, on the increase in the incidence of autism, on the immunization status of the
youngest son of the then prime minister Tony Blair, on the rise in the number of confirmed cases
of measles. In 2004, there was substantial coverage of the mounting doubts about the initial
1998 study with.the editor of the Lancet stating that the article should, with hindsight, not
have been published and with news that the General Medical Council was preparing to charge
Dr Wakefield with professional misconduct.
In order to verify that the amount of coverage by the BBC is representative, figure 1 also
shows the average number of newspaper articles relating to the controversy from 1999 onwards.
The volume and timing of coverage is clearly very similar to that of the BBC, again showing
how media coverage was relatively low until the first quarter of 2001.
III The Data
We first use area-level data. The areas that will serve as our unit of observation are 95 so-called
Health Authorities (HA). The HAs were introduced in April 1996 and were then the lowest
health administrative level. In 1999 a lower level of administration, known as the Primary Care
Organisations (PCO), was established. In June 2003 the HAs were abolished. However, the
three hundred or so PCOs can be aggregated up to reconstruct the HAs after the latter had
been abolished.
8
8
In 2006 the PCOs were reduced to 152; after this last restructuring it is possible to reconstruct only a subset
of the HAs.
11
The childhood immunization schedule for children in the UK is as follows. Between the ages
of two and four months, children receive a primary course (consisting of three doses) of vaccines
against diphtheria, tetanus, pertussis (whooping cough), polio and haemophilus influenzae type
b (“hib”); then at around 13 months a first dose of the measles, mumps and rubella (MMR)
joint vaccine is administered.
9
All these vaccines are provided free of charge through the NHS.
In particular, the NHS does not provide single measles, mumps and rubella vaccines: any parent
who would prefer to have singles vaccines of any of these three would need to obtain these
privately at a significant cost (see below).
10
The data on area-level uptake rates, available through the NHS Information Centre, is col-
lected by the Health Protection Agency through the Cover of Vaccination Evaluated Rapidly
(COVER) data collection programme; the COVER system receives data from the health ad-
ministration units (the HAs until 2002 and the PCOs thereafter). The programme collects
information about the immunization status of all children who reach their second birthday (and
other ages) within the specific year, where the year refers to the period April 1st to March 31st
of the following year; it reports the fraction of children resident in the geographical unit having
received the first dose of the MMR and the fraction of children completing a primary course of
the other immunizations.
11
It is hence important to keep three things in mind. First, the “year” refers to the adminis-
trative period April to March. Second, there is nearly a year’s gap between the parental decision
9
Between the ages of three and five years, there are boosters of all the above except the hib. We focus on the
uptake of the primary courses and hence do not consider the boosters. A particular hib booster known as “hib
extra” was introduced after routine monitoring revealed that the number of cases of hib had gone up in 2001
and 2002. It is given to all children between the age of six months and four years. We consider the “hib extra”
in the analysis of the cohort survey data below. In November 1999 a further vaccine against meningitis C was
introduced; since uptake data is only available from 2000 onwards we do not consider this vaccine.
10
The data thus contains information about vaccinations obtained through the NHS, not those obtained through
the private market. Hence the statistics may underestimate the total vaccination rate (see below).
11
Data on immunization uptake is missing for three London HAs in 2005 due to IT problems in the data
collection process.
12
on the MMR and the data collection; hence e.g. the MMR uptake rate in the 2005 data refers to
children who reached their second birthday between April 2005 and March 2006 and who were
hence eligible for the MMR between May 2004 and April 2005. Finally, there is up to a year’s
gap between the parental decision on the other vaccines and the MMR.
We combine uptake data with information about the characteristics of the local populations.
To this end we use data from the HSE, which is an annual cross-sectional survey monitoring
trends in the nation’s health. We use the HSE since it is the only survey in the UK that identifies
household area information in terms of the administrative health geography.
12
Unfortunately,
income data is only available in the HSE from 1997 onwards. Hence we will focus on the years
1997 to 2005.
Demographic Characteristics
We start by establishing that the HAs are diverse. In characterizing the adult populations of
parenting age, we include all adults aged 16-55 in the HSE’s general population sample and we
give each observed adult a weight that depend on his/her age, where the weight is the value of
an empirical density function of age among parents to newborn babies.
13
Pooling across years,
a total of 63,963 men and women could be allocated to HAs. With 95 areas and nine years, this
implies that the average number of adults per cell is 75.
14
Two key demographic variables for our purposes are education and household income. We
focus on simple binary measure of education – the fraction of adults remaining in education
until at least age 19, which we label as “high” education.
15
Household income measures not only
12
We would like to thank the National Centre for Social Research for constructing and providing this information
for all years.
13
The frequency distribution of age among parents to newborn children is obtained from the Millennium Cohort
Survey which is described below.
14
The average number of babies in an area-year cell is 6,106 with a standard deviation of 2,629. Most of this
variation is due to area-size differences: the standard deviation in number of babies across areas after pooling
across years is 2,604.
15
We also tried other threshold values but found that 19 provided the best fit; this choice of threshold is also
13
earnings but also benefit income, maintenance, and interest from savings etc. We also include a
number of further characteristics of the adults of parenting age, some of which have previously
been found to be related to uptake of childhood vaccines (see e.g. Samad et al. (2006)); these
include controls for ethnic composition, the average number of children per household, the
fraction of females that are lone parents, and the fraction of adults that ever smoked (since
smokers may have different health risk attitudes). It has been suggested in the literature that
uptake of the MMR might also be related to the quality of health care provision (Middleton
and Baker, 2003). In order to control for this we include two further area-level variables: the
numbers of General Practitioners/physicians (GPs) per thousand babies, and the average age
among adults living in the area (as a proxy for the demand for health care).
16
The first column of Table 1 shows the mean across all areas and years and the standard devi-
ation across area-year cells. The standard deviations indicate substantial diversity. The second
column of Table 1 shows the aggregate annual trend in each variable (obtained by regressing the
annual means on time). Hence e.g. we see that the educational attainment of adults of parenting
age increased significantly over time. Similarly, there was substantial income growth (about 2
percent/year), the number of GPs relative to babies grew substantially, there were some ethnic
compositional changes, the number of children per household declined slightly, and there was
some degree of ageing among the adult population.
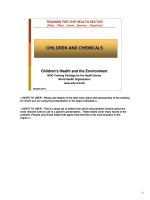
The geographical variation in educational attainment is illustrated in the left panel of Figure
2. This figure shows the percent of adults in each HA that stayed in full-time education until the
age of 19 or above when we pool the data across all years. The right panel of Figure 2 presents
a similar description of the variation in household income. Comparing the two panels of Figure
2, one can see that, as expected, there is a positive correlation between education and income,
with clusters of high education and income in the south of the country.
corroborated by our finding for the MCS below.
16
We would like to thank the NHS Information Centre for providing the information on the number of GPs.
14
Figure 2: Percent of adults of parenting age staying on in full time education until age 19 or
above (left panel) and average household income in thousands, 2000 prices (right panel).
Uptake of Childhood Immunizations
The MMR is the childhood immunization that has seen the largest variation in uptake over the
last decade. This is illustrated in the left panel of Figure 3 which shows how the uptake rate of
the MMR has varied since 1992. The vertical lines identify four phases: (i) a pre-controversy
phase, (ii) an early controversy phase (during which there was some decline and low media
coverage), (iii) a phase of sharp decline and intense media coverage, and (iv) a recovery phase.
The right panel shows the corresponding uptake of the other childhood vaccines.
17
The figure
illustrates how the uptake of the MMR was already, prior to the controversy, low relative to that
of the other vaccines and below the target rate of 95 percent required for herd immunity against
measles, mumps and rubella. The uptake of the MMR drops in the 1998 data; this data point
contains children born between April 1996 and March 1997; since the MMR is administered
17
The Hib vaccine was introduced in 1992. It’s first measured uptake in 1993, which was 75.1 percent, is not
included in the figure order to make the other trends more visible.
15
after the age of 13 months, this means that little less than one third of the children that make
up this data point would have been due the MMR in February 1998 or later. After this initial
drop, the MMR uptake rate levelled off somewhat in the 1999 and 2000 data; it then dropped
again sharply in the 2001 to 2003 data before finally picking up in the last two years of data.
Even though the uptake of the other vaccines has been more stable, it is clear that they too
have shown some variation over time; indeed, in all cases we see a general reduction lasting until
2004.
The trend in the uptake rate for the MMR is closely related to the perceived safety of
the vaccine. Parental attitudes towards immunizations have been tracked across time through
a monitoring programme that surveys around 2,000 mother per year (Yarwood et al. 2005,
Smith et al. 2007). The respondents are asked, inter alia, to assess the safety of a number of
immunizations by rating them on a four point scale: ‘completely safe’, ‘slight risk’, ‘moderate
risk’ and ‘high risk’. To illustrate the strong correspondence between uptake and perceived
safety, Figure 3 (left panel, right scale) illustrates the proportion of mothers saying that the
MMR was completely safe or posing a slight risk. The strong correlation between perceived
safety and uptake of the MMR strengthens the idea that the measured changes in uptake over
time are mainly driven by changes in parental beliefs about the safety of the vaccine.
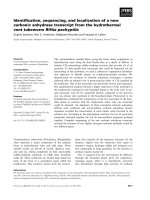
Figure 4 shows the uptake of the MMR across HAs prior to the controversy and at its peak.
The figure shows how, in the 1997 data, there were no areas with uptake rates below 75 percent
with the vast majority of areas at 90 percent or above. In contrast, in the 2003 data, all areas
except one have uptake rates less than 90 percent and 15 areas are below 75 percent.
In order to see more clearly the variation across time in the uptake of the MMR, Figure 5
shows the change from 1997 to 2003 and from 2003 to 2005. This figure shows how the uptake of
the MMR dropped more in the south than in the north, and in the London region in particular.
16
Figure 3: Trends in the uptake of immunizations; data for children who reach their second
birthday and the proportion of mothers with young children who perceive the MMR vaccine to
be either “completely safe” or pose a “slight risk”. (Source: Smith et al., 2007).
IV The Model and Results
The main hypothesis that we wish to test is whether there were different responses to the
MMR controversy for parents with different levels of education in terms of uptake of the freely
provided combined vaccine. However, we do not want to focus too narrowly on education. One
option available to parents rejecting the MMR would be to purchase single vaccines (see below).
However, single vaccines would come at a substantial cost to the parents, which would suggest
a potentially important role played by household income.
In order to consider the role of education and household income in shaping the response to the
MMR controversy we adopt a flexible empirical model where education and income potentially
affect the time-path of the MMR uptake rate. We model the uptake rate in area j at time t as
17
Figure 4: The MMR uptake rate in 1997 and 2003 across Health Authorities for children who
reached their second birthdays.
follows:
MMR
jt
= δ
t
D
t
+ ζ
j
D
j
+ α
z
z
jt
+ α
y
y
jt
+ α
x
x
jt
+ β
z
t
D
t
z
jt
+ β
y
t
D
t
y
jt
+ ε
it
. (1)
In this specification D
t
is a dummy variable for the year being t; hence δ
t
is a year fixed-effect
(with 1997 as the omitted reference year). Similarly, D
j
is a dummy for area j; hence ζ
j
is
a HA area fixed effect. The area fixed effects control for any time-invariant differences across
HAs associated with level differences in uptake rates. The variable z
jt
measures the fraction of
adults of parenting age in area j at time t who stayed on in education until age 19 or above;
hence α
z
measures the impact of education on the baseline uptake rate. Similarly, y
jt
is the
average household income in area j at time t; hence α
y
measures its impact on the baseline
uptake rate. The vector x
jt
contains our remaning controls; the vector α
x
hence measures the
impact of these variables on the uptake rate.
18
18
Since the model includes area- and year fixed-effects the α-coefficients are identified from the fact that the
change over time in educational attainment, income, ethnicity, smokers, number of children in households, pro-
18
Figure 5: The change in the uptake of the MMR between 1997 and 2003, and between 2003 and
2005, for children who reached their second birthdays.
Our main interest concern the β coefficients; these are the coefficients on the interactions
between education and income, respectively, with the year dummies. These measure how edu-
cation and household income affected the time trend in uptake. In all our estimates of equation
(1) the observations are weighted by the number of babies and we apply a robust fixed effects
estimator (Wooldridge, 2002, Ch. 10).
Analysis of the Uptake of the MMR
Table 2 presents estimates of various versions of equation (1). The first specification includes
only year- and area-fixed-effects. The time dummies in this specification are very similar to the
aggregate trend observed in figure 3: an initial drop of 2-3 percentage points in 1998 to 2000
was followed by a sharp drop in 2001 to 2003, making the total drop between 1997 and 2003 in
the order of eleven percentage points, and followed by an increase of about 4 percentage points
in the last two years of data.
portion of lone parents, number of GPs, and average age of adults, has not been uniform across areas.
19
The second specification adds education to the regression. Educational attainment has a
large positive and significant effect, close to nine percentage points, on the baseline uptake rate.
The coefficients on the year dummies now measure the change in the uptake rate across time
by parents who left education before the age 19. The coefficients on the interactions between
education and the year dummies measure the additional response across time for parents who
did stay on in full time education until age 19 or higher. Hence, adding the coefficients for
any one year gives the change in uptake, relative to the base year 1997, for parents with high
education. E.g. for 1998, the uptake rate by high educated parents was five (1.799 + 3.195)
percentage points lower than in the base year 1997.
These results suggest that parents with low education responded relatively less to the MMR
controversy, both in its initial phase and at it peak. E.g. for the years 1999 to 2001, the reduction
in uptake by low educated parents is about half of the observed aggregate reduction in uptake;
when the uptake by low educated parents reached its lowest point it was only about 8 percentage
points lower than their uptake prior to the controversy. In contrast, the results indicate a much
stronger response by high educated parents, increasing rapidly from a five percent reduction in
1998 to a nearly 17 percentage point reduction by 2001 and 21 percentage points reduction by
2003.
The third specification in Table 2 adds household income as an explanatory variable. Control-
ling for income generally reduces the estimated responses among low-educated parents, particu-
larly for the years 1998 to 2000. Indeed, for this group and these years, the estimated response is
effectively zero; only from 2002 onwards do we estimate responses for low educated parents that
are sizeable and statistically significant. In contrast, the estimated additional responses by high
educated parents remain negative and sizeable from 1999 onwards and statistically significant
for the years around the height of the controversy. Controlling for income reduces the estimated
downward trends in uptake for both educational categories but does not overturn the general
pattern of larger responses by high educated parents.
Higher income, while having zero effects on the baseline uptake rate, appears to be associated
with a faster decline in uptake for all years, but is only statistically significantly so for the years
20
around the height of the controversy. We argue below, based on results from the MCS, that
the income effect is consistent with parents declining the freely provided combined vaccine in
favor of buying single vaccines on the market. However, the size of the income responses is
fairly modest: at the height of the controversy, increasing household income from the 25th to
the 75th percentile of the income distribution would decrease the uptake rate by little less than
four percentage points.
The fourth specification in Table 2 adds further controls. Adding these controls has a
negligible impact on the other estimated coefficients. As for the controls themselves the results
suggest a positive effect of the number of GPs and, possibly, a lower uptake among blacks and
smokers; however the coefficients are only significant at the 10 percent level.
19
The estimates suggest that the decrease in relative uptake of the MMR by high educated
parents was particularly pronounced in the early stages of the controversy: this is reflected in the
coefficients on the interactions between time and education generally growing (in absolute value)
between 1998 and 2001 and becoming strongly significant in the last of these years. In contrast,
from 2001 until 2003 the estimates suggest that the decline in uptake among lower educated
parents was more or less on par with that for high educated parents. In order to consider this
in more detail, and also for parsimony, we re-estimate the model using a set of linear splines
instead of year dummies, allowing for four subperiods with knots at 1998, 2000, 2003. As noted
above 1998 is the first year of data for which some children – about one-third – would have been
due the MMR after the start of the controversy. The choice of 2000 as a second knot is natural
for two reasons. First, from the aggregate data we know that uptake decreased only slowly up
until 2000 and fell sharply thereafter (see Figure 3). Second, from the timeline we know that
media coverage of the controversy was relatively low until the spring of 2001. Finally, the choice
19
The uptake response to the controversy could potentially be related to local infection risk. To explore this we
estimated a further specification where we used data on uptake in 1996 (as a proxy for the local immunity rate
at the onset of the controversy) interacted with time. These interactions were not statistically significant and the
point estimates were positive. This is the opposite of what would be expected if part of the decline in uptake
was due to initial high immunity rates. Furthermore, adding these controls, did not alter much the estimated
differential response by high and low educated parents.
21
of 2003 as a knot is natural since this is the year when the MMR uptake reaches it lowest point.
The results are shown in Table 3. Focusing on the main specification (4), the coefficient on
each subperiod in this regression measures the annual change in the vaccine uptake rate by low
educated parents. Similarly, the coefficient on the interactions between education and a given
subperiod measures the additional annual change in uptake by highly educated parents. In the
spline specification, again, we see no significant response by low educated parents until after 2000
(i.e. the first significant response occurs in the third subperiod); in contrast, for high educated
parents we see a sharp decline in the second subperiod, i.e. from 1998 onwards. Moreover, in
the third and fourth subperiods there are no statistically significant differences in trends across
the two educational groups.
The results again suggest that high educated parents reduced their uptake of the MMR
relative to that of low educated parents; in other words, the results suggest that the education
gradient in the uptake of the MMR changed as the controversy evolved. To see this more clearly
we contrast the model’s predictions as we vary parental education. In particular, consider the
predicted aggregate uptake rate in two counterfactual scenarios: (i) a “high education” scenario
where all parents stay on in education until at least age 19, and (ii) a “low education” scenario
where no parents stay on.
20
In constructing the predictions we rely on the most general of our
estimated models: model (4) in Table 2. Figure 6 shows the time paths for these predicted
counterfactual uptake rates along with the actual aggregate uptake rate. The figure shows how,
prior to the controversy, high education was associated with a markedly higher uptake rate;
this reflects the estimated seven percentage points impact of high education on the baseline
uptake rate. This positive education gradient for uptake was then gradually eroded over the
following years, so that for the years 2001 to 2003, the uptake rate among high educated parents
was about one to three percentage points below that of the less educated parents. In contrast
the model suggests that, by 2005, the two educational groups had the same uptake rate of 84
20
In practical terms we use the model to predict the takeup rate in each area-year cell under the two counter-
factual scenarios, and then compute the mean of the predictions for each year by taking the weighted average
across HAs. The predictions are based on the final model specification (4) in Table 4.
22
percent.
21
It should be noted, however, that these predictions are effectively extrapolations (or
“out-of-sample” predictions) since there are no areas where no- or all adults have high education.
One reason for using the cohort survey data below is to verify these predictions at one point in
time.
Figure 6: The predicted uptake rates in the counterfactual scenarios of high- and low-educated
populations.
21
Two previous studies, mentioned above, from other disciplines present related results partially based on the
same data. Middleton and Baker (2003) focus on a subset of 60 HAs for the period 1991-2001, grouping areas into
“deprived”, “affluent”, “neither” according to a deprivation index. They find that after 1997 there was a faster
decline in the more affluent areas. Wright and Polack (2005) also use data on uptake rates at the HA level which
they combine with data on demographic characteristics obtained primarily from the 2001 census. The estimate a
model where the dependent variable is the change in uptake rate between 1997 and 2003 – an implicit area-fixed
effect model – and find that having no qualifications is associated with a lower decline in uptake. However that
the authors measure the educational attainment of the economically active population rather than that of the
adult population of parenting age which could result in a substantial bias.
23