Social contact patterns in vietnam and implications for the control of infectious diseases
Bạn đang xem bản rút gọn của tài liệu. Xem và tải ngay bản đầy đủ của tài liệu tại đây (417.65 KB, 7 trang )
Social Contact Patterns in Vietnam and Implications for
the Control of Infectious Diseases
Peter Horby1,2*, Pham Quang Thai3, Niel Hens4,5, Nguyen Thi Thu Yen3, Le Quynh Mai3, Dang Dinh
Thoang6, Nguyen Manh Linh3, Nguyen Thu Huong3, Neal Alexander7, W. John Edmunds7, Tran Nhu
Duong3, Annette Fox1,2, Nguyen Tran Hien3
1 Oxford University Clinical Research Unit, Hanoi, Vietnam, 2 Centre for Tropical Medicine, Nuffield Department of Clinical Medicine, University of Oxford, Oxford, United
Kingdom, 3 National Institute of Hygiene and Epidemiology, Hanoi, Vietnam, 4 I-Biostat, Hasselt University, Diepenbeek, Belgium, 5 Centre for Health Economics Research
and Modeling Infectious Diseases, Vaccine and Infectious Disease Institute, University of Antwerp, Antwerp, Belgium, 6 Ha Nam Centre for Preventive Medicine, Ha Nam,
Vietnam, 7 London School of Hygiene and Epidemiology, London, United Kingdom
Abstract
Background: The spread of infectious diseases from person to person is determined by the frequency and nature of
contacts between infected and susceptible members of the population. Although there is a long history of using
mathematical models to understand these transmission dynamics, there are still remarkably little empirical data on contact
behaviors with which to parameterize these models. Even starker is the almost complete absence of data from developing
countries. We sought to address this knowledge gap by conducting a household based social contact diary in rural Vietnam.
Methods and Findings: A diary based survey of social contact patterns was conducted in a household-structured
community cohort in North Vietnam in 2007. We used generalized estimating equations to model the number of contacts
while taking into account the household sampling design, and used weighting to balance the household size and age
distribution towards the Vietnamese population. We recorded 6675 contacts from 865 participants in 264 different
households and found that mixing patterns were assortative by age but were more homogenous than observed in a recent
European study. We also observed that physical contacts were more concentrated in the home setting in Vietnam than in
Europe but the overall level of physical contact was lower. A model of individual versus household vaccination strategies
revealed no difference between strategies in the impact on R0.
Conclusions and Significance: This work is the first to estimate contact patterns relevant to the spread of infections
transmitted from person to person by non-sexual routes in a developing country setting. The results show interesting
similarities and differences from European data and demonstrate the importance of context specific data.
Citation: Horby P, Thai PQ, Hens N, Yen NTT, Mai LQ, et al. (2011) Social Contact Patterns in Vietnam and Implications for the Control of Infectious Diseases. PLoS
ONE 6(2): e16965. doi:10.1371/journal.pone.0016965
Editor: Cesar Munayco, Direccio´n General de Epidemiologı´a, Peru
Received December 2, 2010; Accepted January 10, 2011; Published February 14, 2011
Copyright: ß 2011 Horby et al. This is an open-access article distributed under the terms of the Creative Commons Attribution License, which permits
unrestricted use, distribution, and reproduction in any medium, provided the original author and source are credited.
Funding: This work was supported by the Wellcome Trust UK (grants 081613/Z/06/Z and 077078/Z/05/Z). NH gratefully acknowledges financial support from
‘‘SIMID’’, a strategic basic research project funded by the Institute for the Promotion of Innovation by Science and Technology in Flanders (IWT), project number
060081 and by the IAP research network number P6/03 of the Belgian Government (Belgian Science Policy). The funders had no role in study design, data
collection and analysis, decision to publish, or preparation of the manuscript.
Competing Interests: The authors have declared that no competing interests exist.
* E-mail:
key parameter in infectious disease models is the probability of
contact between an infectious source and a susceptible individual.
For infections transmitted from person to person various
assumptions are required to simplify the range of human relations
into tractable mathematical models. Earlier assumptions of
homogenous mixing, where everyone in the population has an
equal probability of contact, have been replaced by more realistic
frameworks where the probability of contact varies between
groups, most often defined by age. The extent to which individuals
preferentially mix with people of the same age (assortativeness) is a
key heterogeneity that is now routinely included in models and
attempts have also been made to further represent the underlying
structure of contact patterns by partitioning the population into
household and workplace compartments [3,4,5].
Understanding and incorporating the key elements of population contact structures into models is important since it improves
Introduction
Mathematical models of infectious disease transmission have
become indispensible tools for understanding epidemic processes
and for providing policy makers with an evidence base for
decisions when empirical data is limited. The success of
mathematical models in informing critical decisions to protect
human and animal health has been demonstrated for many
diseases including pandemic influenza, SARS, foot and mouth
disease, and new variant CJD [1]. Infections directly transmitted
from person to person by the respiratory route have been of special
interest for modeling because of their ability to spread quickly and
affect large numbers of people.
The validity of mathematical models, and therefore the
effectiveness of policies based on these models, is dependent on
the robustness of the parameters entered in to the model [1,2]. A
PLoS ONE | www.plosone.org
1
February 2011 | Volume 6 | Issue 2 | e16965
Contact Patterns Vietnam
the predictive accuracy of the model and also permits investigation
of the effect of interventions targeted at specific settings, such as
schools, workplaces or homes [5,6]. Indeed, family size and
composition have been associated with both social contact
frequency and the risk of infection with influenza and other
respiratory pathogens [7,8,9].
Seroepidemiological studies have been used to infer contact
patterns relevant to the transmission of infections and a number of
surveys have been conducted to directly measure social contacts
[10,11,12,13,14]. The self reported social contact data derived
from such surveys have been shown to better predict the observed
patterns of respiratory infections than other representations of
contact probabilities, such as homogenous or proportionate
mixing [12,14,15,16]. The frequency and nature of social contacts
are however determined by demographic factors, the living and
working environment, socio-cultural norms and individual lifestyle
choices; all of which vary by place and time. A study of eight
European countries found that contact patterns were very similar
but little is known about differences in social contact behaviors
across more diverse socio-cultural environments [13].
The vast majority of social contact surveys have been conducted
in developed western countries yet the majority of the world’s
population live in less developed countries where family structures,
socio-cultural norms, population mobility and the home and work
environment may differ in important ways from Europe.
Developing countries are also more often sites for the emergence
of infectious diseases and in an increasingly connected world,
localized outbreaks can rapidly ‘go global’ with devastating health
and economic impacts. There is therefore a need to determine
social contact patterns in developing country settings, so that the
benefits of mathematical modeling can be extended to these higher
risk and more vulnerable populations [17].
To address this knowledge gap we have used a social contact
diary approach to estimate the frequency and nature of social
contacts in a semi-rural community of Vietnam. Since the
household is a fundamental unit for the transmission of many
infections and household characteristics clearly influence transmission risks, we employed a household-based survey design.
assistance of a trained interviewer, subjects recorded the details of
each contact made on the day preceding the interview. In order to
improve recall, subjects were informed of the day on which they
would be interviewed in advance. The same definition of a contact
was used as the European study, which was: either skin-to-skin
contact (a physical contact), or a two-way conversation with three
or more words in the physical presence of another person but no
skin-to-skin contact (a nonphysical contact). One entry was made
for each person contacted during the diary day, which was defined
as starting at 5 a.m. on the morning of the day assigned and
ending at 5 a.m. the next morning. If an individual was contacted
multiple times during the day, the individual was recorded only
once but the total time spent with that person during the day was
entered. Information was recorded on the age and gender of each
contact, the location and duration of the contact, whether skin-toskin contact had occurred, and how often the interviewee normally
had contact with the individual. The diary is available in the
Supporting Information (text S1).
Every member of each participating household was requested to
complete the contact diary. Participants completed the questionnaire with the assistance of trained village health workers during
face-to-face interviews. For children aged 10 years or less, the
diary was completed with the assistance of the child’s parent or
guardian. Data were double entered into an Access database.
Data analysis
We used generalized estimating equations (GEE) to model the
number of contacts participants in age-category I make with
persons in age-category J while taking into account the correlation
introduced by sampling households. GEEs use working correlation
matrices to take the correlation into account and provide unbiased
estimates even if the working correlation matrix is misspecified,
albeit at the potential loss of efficiency. We used an independence
working correlation matrix to take into account clustering within
households and as a result of using the GEE approach the
correlation between the number of contacts from the same
participant over different age-categories is also taken into account.
Sampling weights are calculated using Vietnamese census data to
balance the contribution over the different days of the week and to
balance the household size and age distribution towards the
Vietnamese population. Matrices of the relative intensity of
contact between age groups were estimated using weighted GEE
and were made reciprocal (i.e. the relative frequency of 0–5 years
old subjects having contact with 0–5 year olds is the same) by
averaging across the two cells. Reciprocal, balanced matrices are
needed for next generation matrices in mathematical models of
disease transmission. The use of a weighted GEE approach allows
population level inferences to be made from the sample dataset.
In order to model the effect of individual or household targeted
immunization strategies we mimicked the immunization process of
individuals or households by setting their corresponding contacts
to 0 for all age-categories. The basic reproduction number R0 can
be calculated as the dominant eigenvalue of the next generation
operator [19] which can be calculated as the dominant eigenvalue
of the matrix NDb where N is a vector of age-group specific
population sizes, D is the mean infectious period and b is the per
capita transmission rate. Under the social contact hypothesis,
Wallinga et al. 2006 assumed b = qC where q is a proportionality
factor and C is the per capita contact matrix. The relative
reduction in R0 when immunizing from p = 0% up to 30% of the
population can then be calculated as the ratio of dominant
eigenvalues of NCp and NC, respectively [20]. Here Cp is the
matrix of per capita contact rates between the different age-groups
as estimated using the GEE when immunizing a proportion p of
Methods
Study area and population
Vietnam has a population of 85.8 million people, making it the
3rd most populous country in Southeast Asia (after Indonesia and
the Philippines) and the 13th most populous nation in the world.
70% of the population lives in rural areas. The Red River Delta in
the north and the Mekong River Delta in the South together
comprise 43% of the population and the Red River Delta is the
most densely populated area, with 930 people per km2 [18]. Data
on the national distribution of household sizes and the population
age structure was obtained from the Vietnam General Statistics
Office (GSO; ).
Survey population
In 2007 a household-based cohort was established in a semirural community in the Red River Delta of North Vietnam.
Households were randomly selected from a list of all households in
the commune (the third administrative level) using a random
number table. If a selected household declined to participate the
nearest neighbor was approached for participation.
Survey methods
A paper-based questionnaire was developed based on an earlier
European study but adapted to the local context [13]. With the
PLoS ONE | www.plosone.org
2
February 2011 | Volume 6 | Issue 2 | e16965
Contact Patterns Vietnam
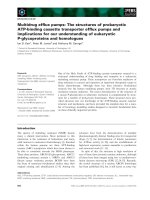
Figure 1. Household sizes (A) and number of reported contacts per person per day (B).
doi:10.1371/journal.pone.0016965.g001
Table 1. Number of recorded contacts per participant per day by characteristics, and relative number of contacts from weighted
GEE analysis.
Category
Covariate
Number of participants
Mean (SD) of Number of Reported
Contacts
Relative Number of Contacts
(95% Confidence interval)
Age of participant
0–4
74
5.47 (2.17)
1.00
5–9
66
6.74 (3.84)
1.23(1.10–1.37)
10–14
95
7.91 (5.65)
1.09(0.96–1.25)
15–19
94
7.67 (3.47)
1.30(1.08–1.56)
20–29
110
7.02 (2.68)
1.17(0.93–1.46)
30–39
120
8.02 (3.21)
1.33(1.13–1.58)
40–49
157
8.65 (4.44)
1.29(1.07–1.55)
50–59
76
8.71 (3.51)
1.44(1.19–1.75)
Sex of participant
Household Size
Day of the week
60+
73
8.21 (3.18)
1.31(1.02–1.68)
Female
471
7.74 (3.78)
1.00
Male
389
7.67 (3.97)
1.01(0.94–1.08)
Missing Value
5
9.00 (3.08)
1.77(1.54–2.02)
1
32
8.59 (3.40)
1.00
2
96
7.89 (3.48)
0.94(0.79–1.12)
3
219
8.01 (4.35)
1.06(0.88–1.26)
4
236
7.30 (4.35)
1.02(0.84–1.24)
5
185
7.72 (3.24)
1.16(0.94–1.44)
6+
97
7.60 (2.86)
1.03(0.84–1.26)
Monday
8
7.75 (2.66)
1.00
Tuesday
148
8.92(4.50)
1.17(0.92–1.49)
Wednesday
302
7.83 (3.24)
0.96(0.79–1.15)
Thursday
181
7.20 (4.21)
0.93(0.76–1.14)
Friday
134
7.15 (4.04)
0.97(0.81–1.17)
Saturday
30
6.82 (2.90)
0.93(0.79–1.08)
Sunday
26
7.19 (2.62)
1.05(0.92–1.18)
Missing Value
6
12.00 (6.36)
1.52(0.90–2.55)
Dispersion parameter alpha = 0.79 (0.33,1.24); alpha = 0 would correspond to no overdispersion.
NA indicating missing values.
doi:10.1371/journal.pone.0016965.t001
PLoS ONE | www.plosone.org
3
February 2011 | Volume 6 | Issue 2 | e16965
Contact Patterns Vietnam
Results
Participant characteristics, number of contacts and
associated covariates
We recorded 6675 contacts from 865 participants in 264
different households. The mean age of respondents was 32 years
(range 0–90) and 55% were female. The mode household size was
3 persons and the mean number of different people contacted per
respondent per day was 7.7 (sd 3.9) indicating the need to use a
count model that allows for overdispersion (i.e. the exhibited
variability exceeds what is expected using a Poisson model, where
the variability equals the mean. Note that the WGEE approach in
addition to the mean parameter uses a dispersion parameter to
allow for overdispersion) (figure 1). In a weighted GEE analysis we
observed no association between the total number of recorded
contacts and household size or gender. The number of reported
contacts was found to be smaller for infants aged 0–4 years as
compared to older participants, among which no difference was
observed (table 1). This demonstrates, at an aggregate level, rather
homogenous frequencies of social contacts across ages, genders
and days of the week.
Nature, duration, location and frequency of contacts
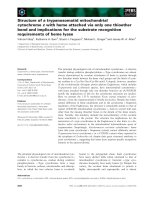
Figure 2. Contacts by location, duration and frequency. The
figures are based on a WGEE with weights based on household size,
days of the week and age.
doi:10.1371/journal.pone.0016965.g002
In the weighted GEE analysis just over 81% of all contacts lasted
more than four hours whilst contacts of shorter duration
(,5 minutes; 5–15 minutes; 15 minutes to 1 hour; 1–4 hours)
contributed between 4–5% of contacts each. Most reported contacts
(93%) were with people that the respondent reported meeting daily
or almost daily, with only one reported contact with an individual
that the respondent had never met before. The most common
reported location where contact occurred was the home (85%),
followed by school (5%) and work place (4%) (figure 2).
the population by either randomly selecting individuals or
households and putting their contacts to 0 for all age-categories.
C is the matrix of per capita contact rates without immunization.
Statistical analysis was conducted in R 2.9.0 (The R Foundation
for Statistical Computing).
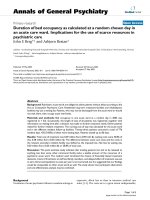
Figure 3. The location, duration and frequency of contacts. The proportion of contacts that were physical or non-physical by duration (panel
A), location (panel B) and frequency of contact (panel C). The duration of contact by frequency of contact (panel D). The figures are based on a WGEE
with weights based on household size and days of the week.
doi:10.1371/journal.pone.0016965.g003
PLoS ONE | www.plosone.org
4
February 2011 | Volume 6 | Issue 2 | e16965
Contact Patterns Vietnam
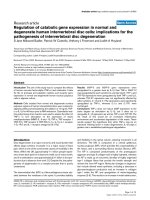
Figure 4. Contact intensity matrices for all contacts (A) and for physical contacts only (B). Yellow indicates high contact rates and blue
low contact rates, relative to the mean contact intensity.
doi:10.1371/journal.pone.0016965.g004
matrix shows that contact intensity for all contacts tends to be
highest in the diagonal, demonstrating an assortative mixing pattern
where the greatest contact is between individuals of a similar age
group. However, a wide area of moderate intensity contact is also
apparent for adults aged 26 to 65 years, indicating rather
homogenous mixing amongst working age adults. Two secondary
areas of moderate intensity contact are also apparent between the
20–65 year age group and children aged 0–5 years. This probably
represents contact between parent and their children and,
grandparents and their grand children. Physical contacts are most
intense amongst children aged 0–5, both within that age group and
with young adults, as shown in the right hand panel of figure 4.
Forty four percent of all reported contacts involved physical
contact. Physical contact was most common in the home setting,
where 91% of all physical contacts occurred. Physical contact was
also more common when the duration of contact was long and
when the subject had contact with that person on an almost daily
basis (figure 3). 91% of physical contacts were with people with
whom the respondent spent more than four hours during the day
and 93% of physical contacts were with people who the
respondent usually contacted daily or almost daily. In total, 85%
of all physical contacts were in the home for more than four hours
with people the respondent meet daily or almost daily.
Age related social mixing patterns
Comparison of immunization strategies
The weighted GEE-model was used to estimate the intensity of
contacts between age groups for all participants (figure 4). The
Assuming that infection is transmitted through the recorded
contact behaviors and that there is full susceptibility to infection,
modeling of the potential impact of individual versus household
targeted immunization strategies revealed no difference in the
predicted effect for a given level of vaccine coverage (figure 5).
Discussion
The successful spread of an infectious disease that is transmitted
from person to person is dependent on many factors, but key amongst
these are the susceptibility of the population, and the frequency and
assortativeness of contacts that effectively transmit infection.
Quantifying these parameters is critical for estimating the impact of
such infections, for designing and targeting preventive interventions,
and for modelling their impact [1]. Whilst much work has been
conducted on defining these parameters for sexually transmitted
infections, less has been done on contact behaviours relevant to the
transmission of respiratory infections; and what has been done has
been conducted exclusively in developed countries [10,11,12,13].
Here we report the first data from a developing country on social
contacts relevant to the spread of respiratory pathogens.
Using the same definition of a contact and comparable
methodology to a large European study, we have identified both
similarities and potentially important differences in our study site
in Vietnam [13]. Similarities with the European data include
significant over dispersion in the distribution of contacts and no
gender differences in reported contact frequency. As observed in
Europe, we too found a peak in contact frequency in school age
children, but in contrast to the European data, we also observed a
second peak in adults aged 40–60 years. Another similarity with
Figure 5. The predicted effect on R0 of immunizing individuals
or households. The figure shows the predicted effect on R0
immunizing a random selection of individuals (solid line) versus a
random selection of households (broken line).
doi:10.1371/journal.pone.0016965.g005
PLoS ONE | www.plosone.org
5
February 2011 | Volume 6 | Issue 2 | e16965
Contact Patterns Vietnam
the European study was that prolonged and frequent contacts, and
contacts occurring at home were much more likely to be physical
in nature. However, there were important differences in the total
number of contacts, and the duration and intimacy of contacts.
Overall we recorded a mean of 7.7 contacts per participant per
day versus 13.4 in the study by Mossong et al. The lower number of
daily contacts we recorded may be a feature of the particular
community studied or may reflect a recall bias introduced by the
retrospective nature of our study design compared to the
prospective design of the European study. Over 80% of contacts
that occurred on a daily basis in the Vietnam study were more
than four hours, compared to only around 45% in the study by
Mossong et al [13] Physical contact was more common in the
European study, with 75% of home contacts being physical
compared to around 45% in our study, and over 60% of daily
contacts being physical compared to around 40% in our study.
The importance of these differences to disease patterns depends on
the relative importance of duration of contact versus intimacy of
contact on the probability of successful transmission.
In general the contact patterns in our study were more
homogenous than that reported elsewhere. We saw smaller
differences between age groups in contact frequency and no
significant differences between household sizes. We saw similar
patterns of age dependent mixing to those reported by Mossong et al,
with pronounced assortative mixing seen as a high intensity diagonal,
signals of parent-child mixing, and a ‘plateau’ of mixing of adults with
one another. We also observed no significant differences in contact
frequency by day of the week, whereas significantly more contacts in
Europe were recorded on weekdays compared to weekends. This is
may be because weekends are not generally observed as a special rest
period in rural Vietnam to the extent they are in Europe. We also saw
fewer contacts in ‘leisure’ settings (1% vs 16%), which may reflect true
differences in the amount of time devoted to leisure, cultural
differences in the conceptual separation between work, family and
leisure activities, or limitations of the survey method in distinguishing
leisure from other activities. Surprisingly, only one contact was
reported with a person that the respondent had never met before.
Whilst the studied community is rural, it is within ten kilometres of a
small town, so cannot be considered remote.
Although we used weights to make inferences about contact
behaviours in the general population of Vietnam, the reliability of
such a generalization is limited by the fact that the study was
conducted in only one setting and at only one time point. It is
possible that contact behaviours may vary significantly between
rural and urban areas and by season. Future studies will be needed
to further define such heterogeneities.
The added value of our data compared to previous published
work is two-fold. We are the first group to report on contact
behaviours relevant to the spread of respiratory infections from a
developing country, and we are the first to report household
structured contact diaries of this nature. These novel features of our
data can provide valuable insights into the spread of directly
transmitted infections in a rural developing country setting and the
potential impact of individual versus household targeted control
strategies. Although we found no difference in the estimated impact
on R0 between individual- and household-targeted immunisation
strategies, the model assumed that all recorded contacts were
equally important in the transmission of infection, whereas it is likely
that the risk of successful transmission is heterogeneous and varies
with different intensity and duration of contacts.
The spread of directly transmitted infections is dependent on at
least four unknown parameters: the susceptibility of the population; the frequency of contacts; the assortativeness of contacts; and
the type of contact that transmits infection. The susceptibility of
the population can in part be measured by serological and other
surveillance data, and this study has gone some way to answering
the second two unknowns. The fourth unknown, the types of
contact that transmit respiratory infections and their relative
importance, is however harder to answer. There has been a
vigorous debate over the relative importance of aerosols versus
large droplets in the transmission of influenza, and even
suggestions that the predominant route may vary between climatic
regions [21,22,23,24]. It is a critical question since models that
assume all social contacts provide an equal opportunity for
infection may result in incorrect conclusions [2,25]. As an adjunct
to physico-mechanical explorations of the transmission of
respiratory infections, a valuable supplementary approach is to
explore associations between the frequency, intensity and duration
of contacts and the measured risk of transmission. This has been
done to some extent by comparing seroepidemiological data with
contact patterns at an aggregated, population level, but might also
be done at an individual level [15]. Multi-country studies that
incorporate biomarkers of infection will help to further define
spatial and temporal heterogeneities in contact behaviours and the
relevance of particular contact profiles to infection risk.
Supporting Information
Text S1 Contact diary.
(DOC)
Acknowledgments
We are grateful to the community of An Hoa Commune for agreeing to
participate in this study and for providing their time. We would like to
thank the village health workers who conducted the interviews. We also
wish to thank the Ministry of Health of Vietnam for their continuing
support of the research collaboration between the Oxford University
Clinical Research Unit and the National Institute for Hygiene and
Epidemiology.
Author Contributions
Conceived and designed the experiments: PH. Performed the experiments:
PQT PH NTTY LQM DDT NML NTH TND AF NTH. Analyzed the
data: PH NH PQT. Contributed reagents/materials/analysis tools: NA
WJE. Wrote the paper: PH NH.
References
6. Becker NG, Dietz K (1995) The effect of household distribution on transmission
and control of highly infectious diseases. Math Biosci 127: 207–219.
7. Berglund B (1967) Respiratory syncytial virus infections in families. A study of
family members of children hospitalized for acute respiratory disease. Acta
Paediatr Scand 56: 395–404.
8. McCaw JM, Forbes K, Nathan PM, Pattison PE, Robins GL, et al. Comparison
of three methods for ascertainment of contact information relevant to respiratory
pathogen transmission in encounter networks. BMC Infect Dis 10: 166.
9. Monto AS, Cavallaro JJ (1971) The Tecumseh study of respiratory illness. II.
Patterns of occurrence of infection with respiratory pathogens, 1965–1969.
Am J Epidemiol 94: 280–289.
1. Grassly NC, Fraser C (2008) Mathematical models of infectious disease
transmission. Nat Rev Microbiol 6: 477–487.
2. Duerr HP, Schwehm M, Leary CC, De Vlas SJ, Eichner M (2007) The impact
of contact structure on infectious disease control: influenza and antiviral agents.
Epidemiol Infect 135: 1124–1132.
3. Ball F, Neal P (2002) A general model for stochastic SIR epidemics with two
levels of mixing. Math Biosci 180: 73–102.
4. Ball F, Neal P (2008) Network epidemic models with two levels of mixing. Math
Biosci 212: 69–87.
5. Pellis L, Ferguson NM, Fraser C (2009) Threshold parameters for a model of
epidemic spread among households and workplaces. J R Soc Interface 6: 979–987.
PLoS ONE | www.plosone.org
6
February 2011 | Volume 6 | Issue 2 | e16965
Contact Patterns Vietnam
10. Edmunds WJ, O’Callaghan CJ, Nokes DJ (1997) Who mixes with whom? A
method to determine the contact patterns of adults that may lead to the spread of
airborne infections. Proc Biol Sci 264: 949–957.
11. Edmunds WJ, Kafatos G, Wallinga J, Mossong JR (2006) Mixing patterns and
the spread of close-contact infectious diseases. Emerg Themes Epidemiol 3: 10.
12. Wallinga J, Teunis P, Kretzschmar M (2006) Using data on social contacts to
estimate age-specific transmission parameters for respiratory-spread infectious
agents. Am J Epidemiol 164: 936–944.
13. Mossong J, Hens N, Jit M, Beutels P, Auranen K, et al. (2008) Social contacts
and mixing patterns relevant to the spread of infectious diseases. PLoS Med 5:
e74.
14. Wallinga J, Edmunds WJ, Kretzschmar M (1999) Perspective: human contact
patterns and the spread of airborne infectious diseases. Trends Microbiol 7:
372–377.
15. Ogunjimi B, Hens N, Goeyvaerts N, Aerts M, Van Damme P, et al. (2009) Using
empirical social contact data to model person to person infectious disease
transmission: an illustration for varicella. Math Biosci 218: 80–87.
16. Goeyvaerts N, Hens N, Aerts M, Beutels P. Model structure analysis to estimate
basic immunological processes and maternal risk for parvovirus B19.
Biostatistics.
17. Jones KE, Patel NG, Levy MA, Storeygard A, Balk D, et al. (2008) Global trends
in emerging infectious diseases. Nature 451: 990–993.
PLoS ONE | www.plosone.org
View publication stats
18. GSO (2010) The 2009 Vietnam Population and Housing Census. Implementation and Preliminary Results. Hanoi: Vietnam General Statistics Office.
19. Diekmann O, Heesterbeek J (2000) Mathematical Methodology of Infectious
Diseases: Model Building, Analysis and Interpretation John Wiley & Sons Ltd.
20. Hens N, Ayele GM, Goeyvaerts N, Aerts M, Mossong J, et al. (2009) Estimating
the impact of school closure on social mixing behaviour and the transmission of
close contact infections in eight European countries. BMC Infect Dis 9: 187.
21. Lowen A, Palese P (2009) Transmission of influenza virus in temperate zones is
predominantly by aerosol, in the tropics by contact: a hypothesis. PLoS Curr.
RRN1002.
22. Tellier R (2009) Aerosol transmission of influenza A virus: a review of new
studies. J R Soc Interface 6 Suppl 6: S783–790.
23. Bouvier NM, Lowen AC, Palese P (2008) Oseltamivir-resistant influenza A
viruses are transmitted efficiently among guinea pigs by direct contact but not by
aerosol. J Virol 82: 10052–10058.
24. Brankston G, Gitterman L, Hirji Z, Lemieux C, Gardam M (2007) Transmission
of influenza A in human beings. Lancet Infect Dis 7: 257–265.
25. Smieszek T (2009) A mechanistic model of infection: why duration and intensity
of contacts should be included in models of disease spread. Theor Biol Med
Model 6: 25.
7
February 2011 | Volume 6 | Issue 2 | e16965