Báo cáo khoa học: Solution parameters modulating DNA binding specificity of the restriction endonuclease EcoRV docx
Bạn đang xem bản rút gọn của tài liệu. Xem và tải ngay bản đầy đủ của tài liệu tại đây (407.39 KB, 15 trang )
Solution parameters modulating DNA binding specificity
of the restriction endonuclease EcoRV
Nina Y. Sidorova, Shakir Muradymov and Donald C. Rau
Laboratory of Physical and Structural Biology, Program of Physical Biology, Eunice Kennedy Shriver National Institute of Child Health and
Human Development, National Institutes of Health, Bethesda, MD, USA
Introduction
Type II restriction endonucleases are paradigms of
specificity for their ability to cleave recognition
sequences while leaving nonspecific DNA intact despite
its vast abundance over the specific site. All restriction
endonucleases require divalent cations for cleavage,
but they can vary in their ability to bind DNA specifi-
cally in the absence of divalent ions. A classical exam-
ple of a protein with extreme binding specificity is the
restriction endonuclease EcoRI that binds to its canon-
ical site, GAATTC, with a constant $ 10
11
m
)1
in
0.1 m salt in the absence of divalent ions. When any of
the 6 bp is changed, binding affinity decreases by a
factor of 10
3
–10
4
[1–3]. Yet another type II restriction
endonuclease, EcoRV, requires divalent cations to
achieve the same level of sequence selectivity as EcoRI.
There are conflicting results in the literature, however,
regarding the ability of EcoRV restriction endonucle-
ase to bind DNA specifically in the absence of divalent
ions, particularly at pH $ 7.5 that is optimal for the
EcoRV enzymatic activity. In their earlier studies, Tay-
lor et al. [4], Thielking et al. [5], Vermote and Halford
[6], Vipond and Halford [7], Alves et al. [8] and
Szczelkun and Connolly [9] employing the gel mobility
shift assay concluded that EcoRV does not show any
DNA sequence binding specificity in the absence of
divalent ions. In contrast, Engler et al. [10] reported a
significant level of specificity for the binding of wild-
type EcoRV to the specific recognition sequence over
Keywords:
DNA–protein specific binding; equilibrium
competition; gel electrophoresis; restriction
endonucleases; water activity
Correspondence
N. Y. Sidorova, 9 Memorial Dr, Bld.
9 ⁄ Rm.1E-108, MSC 0924, Bethesda,
MD 20892-0924, USA
Fax: +301 496 2172
Tel: +301 402 4698
E-mail:
(Received 10 February 2011, revised 26
April 2011, accepted 26 May 2011)
doi:10.1111/j.1742-4658.2011.08198.x
The DNA binding stringency of restriction endonucleases is crucial for
their proper function. The X-ray structures of the specific and non-cognate
complexes of the restriction nuclease EcoRV are considerably different sug-
gesting significant differences in the hydration and binding free energies.
Nonetheless, the majority of studies performed at pH 7.5, optimal for enzy-
matic activity, have found a < 10-fold difference between EcoRV binding
constants to the specific and nonspecific sequences in the absence of diva-
lent ions. We used a recently developed self-cleavage assay to measure
EcoRV–DNA competitive binding and to evaluate the influence of water
activity, pH and salt concentration on the binding stringency of the enzyme
in the absence of divalent ions. We find the enzyme can readily distinguish
specific and nonspecific sequences. The relative specific–nonspecific binding
constant increases strongly with increasing neutral solute concentration and
with decreasing pH. The difference in number of associated waters between
specific and nonspecific DNA–EcoRV complexes is consistent with the dif-
ferences in the crystal structures. Despite the large pH dependence of the
sequence specificity, the osmotic pressure dependence indicates little change
in structure with pH. The large osmotic pressure dependence means that
measurement of protein–DNA specificity in dilute solution cannot be
directly applied to binding in the crowded environment of the cell. In addi-
tion to divalent ions, water activity and pH are key parameters that
strongly modulate binding specificity of EcoRV.
FEBS Journal 278 (2011) 2713–2727 Journal compilation ª 2011 FEBS. No claim to original US government works 2713
nonspecific DNA sequences in the absence of divalent
ions using both the gel mobility shift and filter binding
assays. The ratio of specific and nonspecific binding
constant was estimated at about 155 at pH 7.4. Engler
et al. [10] contended that if the gel running buffer had
a pH > 7 (pH 8–8.3 was used by the other authors),
then the gel retardation assay significantly underesti-
mates the association binding constant. Later, Martin
et al. [11] also using the gel mobility shift assay with a
pH 7 running buffer disputed the results of Engler et al.
[10] and reported that EcoRV binds to its specific seq-
uence only 5-fold better than to a nonspecific site in the
absence of divalent ions at pH 7.5 and $ 10 000-fold
better in the presence of Ca
2+
. Reid et al. [12] measur-
ing fluorescence anisotropy found that the preference
of EcoRV for the specific sequence did not exceed
$ 6.5-fold in the absence of divalent ions at pH 7.5.
Using fluorescence resonance energy transfer and
fluorescence anisotropy, Erskine and Halford [13]
reported no difference between the equilibrium binding
constants of EcoRV to specific and nonspecific
sequences in the absence of divalent ions at pH 7.5.
The X-ray structures of the specific and non-cognate
complexes of EcoRV [14,15] in the absence of divalent
cations are significantly different. The specific complex
has mostly direct DNA–protein contacts at the inter-
face and the DNA is highly bent, while the nonspecific
complex has a large gap at the interface that is pre-
sumably water filled and the DNA is straight. This is
similar to the difference between the specific and non-
specific complexes of BamHI with DNA [16,17]. Based
on X-ray data alone it would be unexpected and coun-
terintuitive that EcoRV–DNA specific and non-cog-
nate complexes that have such different structures
should have similar binding free energies [18]. In our
experience, differences in the interface hydration of the
DNA–protein complexes correlate with differences in
binding free energies [2,19–22]. However, the structures
of the specific and nonspecific EcoRV–DNA complexes
in solution may not be the same as seen by X-ray crys-
tallography due to lattice interactions and packing
energies. Indeed, Hiller et al. [23] report that in solu-
tion DNA bending in the complex with EcoRV is only
observed at pH 7.5 in the presence of divalent metal
ions. This could indicate that the complex with the
specific sequence in the absence of divalent cations
resembles the non-cognate complex structurally. A lack
of sequence specificity at pH 7.5 is then a natural con-
sequence. Spectroscopic differences between the specific
and nonspecific complexes in solution at pH 7.5, how-
ever, have been reported by Thorogood et al. [24] and
by Erskine and Halford [13]. As techniques based on
separation, the gel mobility shift and filter binding
assays have been criticized since the equilibrium distri-
bution of free and protein-bound DNA could be dis-
turbed during the experiment, and that could result in
either under- or over-estimation of binding constants.
In this study, we employ another technique developed
by us previously. Using the observation that neutral
solutes dramatically slow the dissociation of many
DNA–protein specific complexes [19,20,22,25] we
developed a self-cleavage solution assay [20,26]. This
assay uses the cleavage reaction of restriction endonuc-
leases to measure sensitively their DNA binding. This
technique does not have the limitations of the gel
mobility shift or filter binding assays, but provides the
same level of sensitivity. Additionally, contrary to
other techniques, the method only measures enzymati-
cally competent complexes that are capable of DNA
cleavage in the presence of Mg
2+
. Using this assay we
measure the relative specific–nonspecific equilibrium
binding constant through direct binding competition of
the specific site with nonspecific sequences and its
dependence on pH, salt concentration and osmotic
pressure. Relative binding constants are not only
straightforward to measure but are more directly rele-
vant to binding specificity and dependence of specific-
ity on different solution parameters. In agreement with
Engler et al. [10], we observe a strong pH dependence
of the specific–nonspecific association binding constant
ratio, increasing $ 500-fold between pH 8.0 and 5.5.
The sequence specificity of the EcoRV at pH 6.4 is
comparable to the specificity of BamHI at pH 7.0. At
pH 7.6, the ratio of association binding constants for a
specific site 310 bp DNA fragment and a 30 bp non-
specific oligonucleotide, K
nsp-sp
,is$ 60 in the absence
of divalent cations. This is indeed relatively low com-
pared with both EcoRI and BamHI, but is still signifi-
cantly larger than the 1–6.5-fold ratio reported
previously.
We have also measured the osmotic pressure depen-
dence of the specific–nonspecific competitive binding
constant. This gives a measure of the difference
between the two complexes in water associated with
protein that is sequestered from osmolytes either steri-
cally or by a preferential hydration, DN
w,nsp-sp
.We
have found that specific, non-cognate and nonspecific
DNA–protein complexes can be distinguished by dif-
ferences in sequestered water [2,20,25]. Our previous
results with EcoRI and Bam HI showed a difference of
more than 100 water molecules between the specific
and nonspecific complexes [2,20]. We concluded this
water is in the cavity at the protein–DNA interface of
the nonspecific complex, consistent with the insensitiv-
ity to osmolyte nature and with the X-ray structures
for BamHI complexes. The binding specificity of
Parameters modulating EcoRV binding specificity N. Y. Sidorova et al.
2714 FEBS Journal 278 (2011) 2713–2727 Journal compilation ª 2011 FEBS. No claim to original US government works
EcoRV dramatically increases with increasing concen-
trations of neutral osmolytes, particularly triethylene
glycol. The sensitivity to water activity for three of the
four osmolytes used is consistent with the difference
seen in the crystal structures without divalent cations.
Even in the absence of divalent cations protein binds
its specific DNA sequence in a specific-like mode. Con-
trary to both BamHI and EcoRI restriction endonuc-
leases, DN
w,nsp-sp
measured with triethylene glycol is
significantly different from the other three osmolytes
and suggests there is a significant change in the
exposed surface area between specific and non-cognate
DNA–EcoRV complexes in addition to the cavity at
the interface of the non-cognate complex. We see very
little dependence of DN
w,nsp-sp
on pH. Despite the large
change in K
nsp-sp
with pH, the structures of the specific
and nonspecific complexes probably change minimally.
Results
Self-cleavage assay optimization for measuring
EcoRV–DNA specific binding
The basis of the self-cleavage assay is that the distribu-
tion of enzyme-bound and free specific site DNA frag-
ment is ‘trapped’ by adding a large concentration of
osmolyte to greatly slow dissociation of the enzyme
from the recognition site and competitor oligonucleo-
tide also containing the specific recognition site to bind
excess enzyme and to prevent rebinding to the DNA
fragment. Mg
2+
is added to allow the cleavage reac-
tion to proceed. The cleavage reaction is stopped by
adding EDTA. We will refer to the enzyme trapped on
the specific site of the DNA fragment as enzymatically
competent even though the fully active enzyme confor-
mation that can actually cleave DNA may only evolve
with added Mg
2+
. The concentrations of both osmo-
lyte and oligonucleotide are variables for optimization.
Control experiments indicate that final reaction condi-
tions of 20 mm imidazole pH 6.5–6.8, 100 mm NaCl,
10 mm MgCl
2
, 400-fold molar excess of specific
site oligonucleotide over specific site fragment, and 3
osmolal triethylene glycol are sufficient for the efficient
‘trapping’ of the complex. A cleavage mix is added to
the preformed complex to result in these solution
conditions. There is < 2% difference in the fraction of
enzyme-bound fragment if Mg
2+
is added immediately
with the cleavage mix or 60 min after the rest of the
cleavage mix (data not shown). The triethylene glycol
effectively stops dissociation. Nor does it matter if
complexes are incubated for 10 min or 30 min in the
cleavage mix with Mg
2+
before adding EDTA. The
400-fold excess of specific site oligonucleotide is
sufficient to prevent rebinding of enzyme to DNA
fragment (Fig. S1). In all experiments described further
in this work, DNA–protein samples were incubated
with cleavage mix at 20 °C for 20 min.
Kinetics of EcoRV–DNA binding
The time needed to reach equilibrium depends sensi-
tively on association and dissociation rates. Figure 1
shows the kinetics of DNA–protein complex formation
measured by the self-cleavage assay for different exper-
imental conditions of pH and osmotic pressure. Each
time point corresponds to the incubation time of
EcoRV ($ 1.5 nm) with specific site 310 bp DNA frag-
ment ($ 3nm) before self-cleavage mix is added. Vir-
tually all protein was bound at equilibrium for the
experiments shown. The final fraction of bound DNA
at long times f
b,¥
ranges from 0.52 to 0.58. The bind-
ing of EcoRV proceeds with at least two time con-
stants. About 55% of the total protein binds to the
DNA in an enzymatically competent conformation
much faster than the minute time-scale of our experi-
ment. It takes $ 1.5–4 h for the remaining 45% of the
protein to form an enzymatically active complex with
Time (min)
0 50 100 150 200
f
b
/f
b,
∞
0.6
0.8
1.0
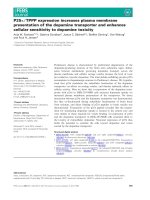
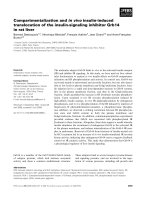
Fig. 1. Kinetics of the EcoRV–DNA complex formation. The kinetics
of DNA–protein complex formation were measured using the self-
cleavage assay at different conditions of pH: pH 6.3 (m); pH 7.6
(j). The binding of the EcoRV proceeds in at least two steps.
About 60% of the protein binds within the first 5 min of the kinetic
experiment. The time dependence of the remaining slow compo-
nent can be well described by the single exponential (fits are
shown for both curves). The fraction of bound (cleaved) DNA was
normalized by the limiting plateau value f
b,¥
for each curve. The
rate of the slow component is significantly pH dependent. The half-
life time of the slow component measured in the presence of 1 os-
molal triethylene glycol increases from $ 19 min at pH 6.3 to
$ 42 min at pH 7.6. EcoRV and DNA were initially incubated in
20 m
M imidazole (pH 6.3 or 7.6), 100 mM NaCl and 1 osmolal
triethylene glycol for the indicated periods of time before assaying.
N. Y. Sidorova et al. Parameters modulating EcoRV binding specificity
FEBS Journal 278 (2011) 2713–2727 Journal compilation ª 2011 FEBS. No claim to original US government works 2715
the DNA specific fragment. This unexpected result was
also reproduced with commercial EcoRV from New
England Biolabs (data not shown).
The time dependence of the slow component kinetics
for complex formation can be well described by a sin-
gle exponential. The rate constant of the slow compo-
nent is significantly pH dependent. The half-life time
of the slow component measured in the presence of 1
osmolal triethylene glycol increases from $ 19 min at
pH 6.3 to $ 42 min at pH 7.6. There was no measur-
able difference in the half-life time of the slow compo-
nent measured at pH 7.6 in the presence of one or 2
osmolal triethylene glycol. Nor do we observe that a
2-fold change in EcoRV concentration at pH 6.8 affects
the kinetics of complex formation (Fig. S2). We also
performed a control experiment using the self-cleavage
assay to measure the rate of EcoRI association to its
specific sequence fragment with the same experimental
conditions and protocol used for EcoRV. EcoRI was
completely bound within 2 min (our fastest time point)
of incubation of protein with DNA (Fig. S3).
The slow kinetics of complex formation at pH 7.6
necessitates an incubation time of at least 4–5 h to
ensure that equilibrium is reached. The specific site
complex is stable for at least 24 h as determined by the
self-cleavage assay. To avoid adjusting incubation
times in the equilibrium competition experiments sepa-
rately for each set of conditions, we chose to incubate
DNA–EcoRV complexes for 18–20 h before adding
cleavage mix.
In contrast to association, the dissociation kinetics
of the EcoRV can be well described by a single expo-
nential (Fig. S4). The rates are sufficiently fast under
all experimental conditions used in this study such that
18–20 h incubation was enough to reach equilibrium
(data not shown).
EcoRV–DNA specific binding measured with the
gel mobility shift and self-cleavage assays
The electrophoretic mobility shift assay (EMSA)
[27,28] is a widely used tool for quantitating DNA–
protein binding. The technique requires that the com-
plex is stable once in the gel and that the distribution
of complex and free DNA remains unchanged in the
electrophoretic well before entering the gel. Engler
et al. [10] has reported that the running buffer pH
should be $ 7.0, rather than the standard 8.3 with
Tris ⁄ acetate ⁄ EDTA (TAE) or Tris ⁄ borate ⁄ EDTA
(TBE), in order to stabilize the EcoRV–DNA complex.
We observed similar problems at pH 8.3 compared
with pH 7.0 and suspect that the dissociation rate at
pH 8.3 is too fast for the EMSA. The diffusion and
electrophoresis of protons is much faster than any
other solution component, and samples are exposed to
quickly changing conditions of pH while in the electro-
phoretic well [26]. We have further modified the stan-
dard EMSA protocol in order to ensure that the
distribution of complex and DNA fragment is stable
by adding triethylene glycol to further slow dissocia-
tion and specific site oligonucleotide to prevent binding
of free protein to the specific site DNA fragment [26],
but no Mg
2+
. Figure 2 shows a comparison of EcoRV
binding measurement using the gel shift and self-cleav-
Gel mobility shift Self-cleavage
Bound DNA
Free DNA
Uncleaved DNA
Cleaved DNA
0.2 0.5 1 1.5 2.1
0.2
0.5 1 1.5 2.1
[EcoRV], nM
[EcoRV], nM
0.01.0 2.0
3.0
Fraction bound DNA (f
b
)
0.0
0.2
0.4
0.6
0.8
A
B
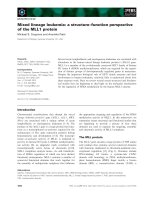
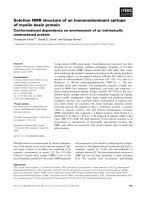
Fig. 2. A direct comparison of EcoRV–DNA binding analyzed by the
gel mobility shift assay and by the self-cleavage assay. (A) A gel
image is shown illustrating a direct comparison of the EcoRV–DNA
binding by the gel mobility shift assay (left) and by the self-cleavage
assay (right). Stop reaction mixture to stabilize the complex ⁄ free
DNA fragment distribution in the electrophoretic well was added to
the gel mobility shift samples (up to 400-fold excess specific site
oligonucleotide and 3 osmolal triethylene glycol in the final sample).
Cleavage mixture (up to 10 m
M MgCl
2
, 400-fold excess molar spe-
cific site oligonucleotide and 3 osmolal triethylene glycol in the final
sample) was used in the self-cleavage assay. (B) The calculated
fraction of total DNA fragment with bound protein as dependent on
the total protein added is shown for the gels in (A). Both the gel
mobility shift (
•) and the self-cleavage assay (D) give practically
identical measures of EcoRV binding. For both techniques,
complexes were incubated at 20 °C overnight in 20 m
M imidazole
(pH 6.8), 100 m
M NaCl and 1 osmolal triethylene glycol before
assaying.
Parameters modulating EcoRV binding specificity N. Y. Sidorova et al.
2716 FEBS Journal 278 (2011) 2713–2727 Journal compilation ª 2011 FEBS. No claim to original US government works
age assays. The gel mobility shift assay is shown on
the left-hand side of Fig. 2A and the self-cleavage
assay on the right. The gel was run with a pH 6.9 run-
ning buffer (imidazole) using our protocol. For both
techniques, the complex was incubated overnight under
conditions of stoichiometric binding before assaying.
Figure 2B shows the analysis of the gels presented in
Fig. 2A. Both titration dependences are linear as
expected for virtually stoichiometric protein binding.
The fractions of DNA bound measured by the self-
cleavage and the gel mobility shift assays are practi-
cally indistinguishable. This result further confirms
that both techniques give reliable and quantitative
results under proper conditions.
The relative specific–nonspecific binding constant
of EcoRV and its osmotic pressure dependence
The relative binding constant, K
nsp-sp
, is the ratio of
the association binding constants K
sp
⁄ K
nsp
for EcoRV
binding to a 310 bp specific site DNA fragment and a
30 bp nonspecific oligonucleotide and was measured
from direct equilibrium competition experiments. Mix-
tures of EcoRV, the 310 bp specific sequence fragment,
and varying concentrations of a nonspecific oligonu-
cleotide c ompetitor were in cu bated at 20 °C for 18–20 h.
The loss of the specific site binding as the concentra-
tion of competing nonspecific oligonucleotide increased
was determined by the self-cleavage assay. Figure 3A
shows a gel image illustrating the competition for
EcoRV binding between the nonspecific oligonucleo-
tide and the specific site DNA fragment for 0.4 and
0.8 osmolal triethylene glycol at pH 6.8 and 100 mm
NaCl. Under these conditions EcoRV binds virtually
stoichiometrically (< 5% free protein) to the 310 bp
DNA fragment in the absence of oligonucleotide, mak-
ing calculation of K
nsp-sp
quite straightforward. Fig-
ure 3B shows the analysis of the gel shown in Fig. 3A.
The relative binding constant K
nsp-sp
can be calculated
from the slopes of the lines using Eqn (1) from Materi-
als and methods. Analogous experiments were per-
formed for three other solutes.
Figure 4 shows the osmotic pressure dependence of
ln(K
nsp-sp
) at pH 6.8 for the four osmolytes examined,
triethylene glycol, betaine glycine, trimethylamine
N-oxide (TMAO) and a-methyl glucoside. The sensitivity
to osmotic pressure indicates a difference in the exclu-
sion of osmolytes from the water associated with spe-
cific and nonspecific complexes. Slopes of the lines can
be translated into a difference in the number of com-
plex associated water molecules that are consequently
included, DN
w,sp-nsp
, using Eqn (3) of Materials and
methods. Since less water is sequestered by the specific
complex as seen in the crystal structures, specific bind-
ing is strongly favored over nonspecific binding by the
presence of neutral solutes. The osmotic dependence of
the difference in binding free energy between specific
and nonspecific binding (in units of kT ) is linear for
all four osmolytes indicating that DN
w,sp-nsp
is constant
for each solute over the range of osmotic pressures
examined. DN
w,nsp-sp
values are dependent on the osmo-
lyte used, however, ranging from 114 ± 4 water mole-
cules with betaine to 224 ± 14 water molecules using
0.4 osm 0.8 osm
Uncleaved DNA
Cleaved DNA
0 0.6 2.1 6.3
17 0
0.6 2.1 6.3 17
[Nonspecific oligonucleotide], μ
M
f
b
[DNA
nsp
]/(1 – f
b
)[DNA
sp
]
0 500 1000 1500 2000
f
b
0.0
0.1
0.2
0.3
0.4
0.5
A
B
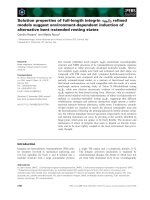
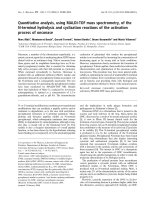
Fig. 3. Equilibrium competition between specific and nonspecific
DNA sequences for the EcoRV binding. Mixtures of EcoRV, the
310 bp DNA fragment with a specific recognition site and nonspe-
cific oligonucleotide competitor were incubated at 20 °C overnight
in the presence of 0.4 or 0.8 osmolal triethylene glycol, 20 m
M imid-
azole (pH 6.8) and 100 m
M NaCl. (A) The loss of specific site binding
as the concentration of nonspecific competitor increased was
determined by the self-cleavage assay. Only DNA fragments with
initially bound enzyme are cleaved. Less cleavage is observed as the
nonspecific oligonucleotide concentration is increased, indicating a
loss of specific binding. (B) The ratio of the association binding
constants for the specific site DNA fragment and the nonspecific oli-
gonucleotide, K
nsp-sp
, is extracted from the loss of specific binding
as the concentration of nonspecific oligonucleotide increases. The
fraction of protein-bound DNA fragment, f
b
, is plotted against the
parameter f
b
[DNA
nsp
] ⁄ (1 ) f
b
)[DNA
sp
] as given by Eqn (1) in Materi-
als and methods for the case of stoichiometrically bound protein.
The slope of the best fitting straight line is )1 ⁄ K
nsp-sp
. For 0.4
osmolal triethylene glycol (
•), K
nsp-sp
= 1411 ± 123; for 0.8 osmolal
triethylene glycol (
), K
nsp-sp
= 8606 ± 290.
N. Y. Sidorova et al. Parameters modulating EcoRV binding specificity
FEBS Journal 278 (2011) 2713–2727 Journal compilation ª 2011 FEBS. No claim to original US government works 2717
triethylene glycol. In contrast, DN
w,nsp-sp
was virtually
insensitive to the osmolyte identity for seven solutes
used in analogous competition experiments for BamHI
[20] and Eco RI [2] restriction endonucleases.
Figure 4 confirms that EcoRV is quite proficient at
distinguishing between specific and nonspecific DNA
sequences in the absence of divalent cofactor at pH
6.8. The average competitive binding constant K
nsp-sp
with no added osmolyte is $ 274. Impressively, in the
presence of only 1 osmolal triethylene glycol this ratio
increases 55-fold, to $ 15 000.
The pH dependence of K
nsp-sp
for EcoRV–DNA
binding
Figure 5 shows the dependence of the specific–nonspe-
cific binding free energy difference on triethylene glycol
osmolal concentration measured at pH 6.3, 6.8 and
7.6. All three curves are linear with slopes translating
into DN
w
,
nsp-sp
equal to 226 ± 5 at pH 7.6, 224 ± 14
at pH 6.8 and 281 ± 15 at pH 6.3. K
nsp-sp
measured
in the absence of triethylene glycol changes from
56 ± 6 at pH 7.6, to 283 ± 36 at pH 6.8 and to
1173 ± 154 at pH 6.3. We do see a strong increase of
the relative binding constant with decreasing pH in
agreement with results obtained earlier by Engler et al.
[10]. Nonetheless, even at pH 7.6, EcoRV is still able
to distinguish between specific and nonspecific
sequences on DNA in the absence of osmolytes. As a
further confirmation of these results, specific site frag-
ment complex was titrated with either specific site oli-
gonucleotide or nonspecific oligonucleotide at pH 7.6
and 100 mm NaCl. This result is additionally illus-
trated in Fig. S5. Less than 9% of the specific frag-
ment–EcoRV complex formed in the absence of
oligonucleotides is still present when 30-fold molar
excess of specific site oligonucleotide over specific frag-
ment is added, but more than 73% is stable at the
same excess of the nonspecific oligonucleotide. In the
presence of 1 osmolal triethylene glycol, K
nsp-sp
at pH
7.6 increases from $ 56 to $ 3000. K
nsp-sp
values at
P
osm
= 0 and DN
w,nsp-sp
values measured at pH 6.3,
6.8 and 7.6 are given in Table 1 for the four osmolytes
used. Control experiments showed that the relative
[Solute], osmolal
0.0 0.5 1.0 1.5 2.0
ln (K
nsp-sp
)
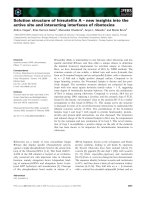
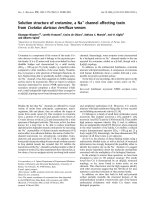
Fig. 4. The dependence of the EcoRV specific–nonspecific binding
free energy difference, ln(K
nsp-sp
), in units of kT, on solute osmolal
concentration is shown for four neutral osmolytes. Mixtures of the
specific site DNA fragment, nonspecific oligonucleotide and EcoRV
were prepared at 100 m
M NaCl, 20 mM imidazole, pH 6.8, and dif-
ferent concentrations of neutral solutes. Mixtures were incubated
at 20 °C overnight. Competitive binding constants for betaine gly-
cine (
•), a-methyl glucoside (D), TMAO (¤) and triethylene glycol
(h) were measured using the self-cleavage assay as described in
Materials and methods. Changes in competitive binding free ener-
gies scale linearly with osmolal concentration or, equivalently, with
water chemical potential for all solutes shown. The difference in
solute-excluded water molecules, DN
w,nsp-sp
, between specific and
nonspecific complexes can be calculated for each solute from linear
fits to the data using Eqn (3) in Materials and methods. The best
fitting lines give DN
w,nsp-sp
equal to 114 ± 4 waters for betaine gly-
cine; 127 ± 2 waters for methyl glucoside; 150 ± 10 waters for
TMAO; 224 ± 14 waters for triethylene glycol. Error bars for most
points are of the order of the size of the symbols.
[Triethylene glycol], osmolal
0.0 0.5 1.0 1.5 2.0
ln (K
nsp-sp
)
4
6
8
10
12
Fig. 5. The dependence of the EcoRV specific–nonspecific binding
free energy difference on triethylene glycol concentration is shown
for different pH values. Mixtures of EcoRV, the 310 bp specific site
DNA fragment and the nonspecific oligonucleotide competitor were
incubated at 20 °C overnight in the presence of different concentra-
tions of triethylene glycol in 100 m
M NaCl and 20 mM imidazole
[pH 6.3 (m), pH 6.8 (h) and pH 7.6 (
•)]. The fraction of DNA bound
to EcoRV was measured using the self-cleavage assay. Changes in
competitive binding free energies scale linearly with triethylene gly-
col osmolal concentration for each pH value shown. The best fitting
lines (Eqn 3 in Materials and methods) give DN
w,nsp-sp
values of
281 ± 15 at pH 6.3, 224 ± 14 at pH 6.8 and 226 ± 5 at pH 7.6.
Parameters modulating EcoRV binding specificity N. Y. Sidorova et al.
2718 FEBS Journal 278 (2011) 2713–2727 Journal compilation ª 2011 FEBS. No claim to original US government works
binding constant for the competition between the spe-
cific DNA fragment and a 30 bp oligonucleotide con-
taining the specific recognition site is nearly 1 for pH
6.3, 6.8 and 7.6 (data not shown).
Figure 6 shows a titration curve for the pH depen-
dence of K
nsp-sp
at P
osm
= 0 for the range of pH val-
ues 5.5–8. K
nsp-sp
is almost 3 · 10
4
at pH 5.5. An
apparent plateau value for K
nsp-sp
at $ 60 is observed
at the higher pH values, but no plateau was observed
in the lower range.
The salt dependence of K
nsp-sp
for EcoRV–DNA
binding
A sensitivity of K
nsp-sp
to pH would suggest that the
dependence of K
nsp-sp
on salt concentration should
also vary with pH. Figure 7 shows the salt depen-
dence of K
nsp-sp
measured for the range of salt con-
centrations 60–140 mm NaCl at pH 6.3 and 7.6. The
linear dependence of log(K
nsp-sp
) on log([NaCl]) can
be translated into a difference in the number of ther-
modynamically bound sodium ions between the non-
specific and specific complexes. At pH 7.6, the
competitive binding constant K
nsp-sp
increases slightly
with increasing salt concentration indicating that the
specific complex binds 1.5 ± 0.1 more sodium ions
Table 1. The ratio between specific and nonspecific EcoRV binding constants measured at conditions of no osmolyte (K
0
nsp-sp
) and the cor-
responding difference in the number of water molecules (DN
w,nsp-sp
) released for the binding of EcoRV to specific and to nonspecific DNA
sequences are shown for four osmolytes at different pH values.
Osmolyte
pH 6.3 pH 6.8 pH 7.6
K
0
nsp-sp
DN
w,nsp-sp
K
0
nsp-sp
DN
w,nsp-sp
K
0
nsp-sp
DN
w,nsp-sp
Betaine 1250 ± 133 117 ± 7 249 ± 22 114 ± 4 56 ± 10 126 ± 9
a-Methyl glucoside – – 281 ± 5 127 ± 2 64 ± 15 142 ± 11
TMAO – – 283 ± 53 150 ± 10 – –
Triethylene glycol 1173 ± 154 281 ± 15 285 ± 50 224 ± 14 56 ± 6 226 ± 5
Values for DN
w,nsp-sp
and K
0
nsp-sp
were determined from linear fits of the data as shown in Figs 4 and 5.
pH
678
ln (K
nsp-sp
)
4
6
8
10
12
Fig. 6. pH dependence of the EcoRV specific–nonspecific free
binding energy difference. The pH dependence of ln(K
nsp-sp
)is
shown for the range 5.5–8.0. Mixtures of EcoRV, the 310 bp spe-
cific site DNA fragment and the nonspecific oligonucleotide com-
petitor were incubated at 20 °C overnight in the absence of
osmolytes in 100 m
M NaCl and either in 20 mM Mes buffer (D)or
in 20 m
M imidazole buffer (•). The competitive binding constant,
K
nsp-sp
, at each pH was measured using the self-cleavage assay.
An apparent plateau value for K
nsp-sp
at $ 60 was observed at
higher pH values, but no plateau was observed in the lower range.
log[NaCl]
–1.3 –1.2 –1.1 –1.0 –0.9
log (K
nsp-sp
)
1
2
3
4
Fig. 7. Salt dependence of the EcoRV specific–nonspecific free
binding energy difference measured at pH 6.3 and 7.6. The salt de-
pendences of log(K
nsp-sp
) measured for the range of salt concentra-
tions 60–140 m
M NaCl at either pH 6.3 (m) or pH 7.6 (j) are
shown. Mixtures of EcoRV, the 310 bp specific site DNA fragment
and the nonspecific oligonucleotide competitor were incubated
overnight at 20 °C in the absence of osmolytes in 20 m
M imidazole
at different NaCl concentrations. The competitive binding constant,
K
nsp-sp
, at each salt concentration was measured using the self-
cleavage assay. The linear dependence of log(K
nsp-sp
) on log([NaCl])
can be translated into a difference in the number of thermodynami-
cally bound sodium ions between the nonspecific and specific com-
plexes. At pH 7.6, the specific complex binds 1.5 ± 0.1 more
sodium ions than the nonspecific complex. At pH 6.3, K
nsp-sp
is
negligibly dependent on salt concentration with the slope translated
into only about )0.35 ± 0.3 sodium ions.
N. Y. Sidorova et al. Parameters modulating EcoRV binding specificity
FEBS Journal 278 (2011) 2713–2727 Journal compilation ª 2011 FEBS. No claim to original US government works 2719
than the nonspecific complex. At pH 6.3, K
nsp-sp
is
negligibly dependent on salt concentration suggesting
that formation of both the specific and nonspecific
DNA–EcoRV complexes releases the same number of
sodium ions.
Discussion
X-ray structures for specific and non-cognate DNA–
EcoRV complexes solved in the absence of metal co-
factors [14,15] are noticeably different, suggesting that
there should be significant differences in hydration and
binding free energies between two complexes as has
been seen for EcoRI and BamHI complexes with DNA
[2,20]. Nonetheless, the majority of biochemical studies
performed over the last 20 years show either very little
difference in binding free energies between specific and
nonspecific DNA–EcoRV complexes in the absence of
divalent cations, or none at all [4,6–9,11–13,23,29].
These investigations were performed at $ pH 7.5, the
optimal pH for enzymatic activity for EcoRV. One
group only [10] reported a significant EcoRV specificity
in the absence of divalent cations: K
nsp-sp
$ 155 at pH
7.4 for the competition of $ 20 bp specific and non-
specific oligonucleotides.
Here we have used a self-cleavage solution assay
developed by us [26] to measure EcoRV binding. This
assay monitors only enzymatically competent com-
plexes. We showed that under proper conditions the
self-cleavage and gel mobility assays give identical
results. Equilibrium measurements require knowledge
of association and dissociation rates. We found that,
under the conditions used here, EcoRV has unusual
kinetics of specific complex formation in the absence
of divalent ions that was not observed for EcoRI.
A significant fraction of the total enzyme, $ 45%,
forms enzymatically competent complexes unusually
slowly (Fig. 1). Rates of complex formation are slow-
est in the pH range ($ pH 7.5) that is most controver-
sial for enzyme specificity. It would be quite easy to
underestimate the specific binding constant if the reac-
tion mixture was not incubated long enough. In the
experiment on complex formation (illustrated in Fig. 1,
filled squares) binding at equilibrium is stoichiometric
(more than 95% of the protein is in DNA-bound
state). The minimal value for the equilibrium dissocia-
tion constant can be estimated as at least
$ 11.3 · 10
9
m
)1
. In the majority of studies, 30 min
incubation was considered sufficient to reach equilib-
rium. If the value for the equilibrium constant was
calculated from the fraction of DNA bound after
30 min (Fig. 1, filled squares) it would be estimated as
only 1.12 · 10
9
m
)1
, at least 10-fold lower.
We do not know the reason for such slow kinetics.
Heterogeneity of the enzyme population could poten-
tially be an artifact of a given preparation, but we
observe slow association kinetics with both EcoRV iso-
lated by us and EcoRV from New England Biolabs.
Additionally, the slowly associating component is fully
capable of cleaving DNA. Only a single component is
apparent in the dissociation also using the self-cleavage
assay. The association kinetics of EcoRI using the
same self-cleavage protocol shows no such slow com-
ponent. The slow component is not a consequence of
the assay. Preliminary data indicate that the fraction
of the slow component depends sensitively on solution
conditions. The 0.45 fraction of slowly associating pro-
tein reflects its presence in our enzyme storage buffer
(see Materials and methods). Other research groups
have reported much faster rates [13,23,30,31], but there
are significant differences between our measurements
and previous studies on the EcoRV association kinetics
that prevent direct comparison with previous data.
The majority of studies were performed in the presence
of divalent cations. We were specifically interested in
the EcoRV binding equilibrium in the absence of diva-
lent ions, so association kinetics were also measured in
the absence of divalent ions. We do not know yet how
divalent cations and temperature affect the equilibrium
between kinetic components. A strong dependence of
the association kinetics rate on divalent ion concentra-
tion was reported before for the restriction endonucle-
ase PvuII [32,33] that shows low binding stringency
in the absence of divalent ions similar to EcoRV [34].
Hiller et al. [23] measured association kinetics of the
EcoRV both in the presence and in the absence of diva-
lent metals and found the on-rate to be even faster in
the absence of divalent co-factors. It is not clear, how-
ever, if the plateau fluorescence anisotropy observed
corresponds to complete enzyme binding. A slowly
associating component could have been missed.
The rate of complex formation we observe for the
EcoRV is not sensitive to protein concentration mea-
sured over a 2-fold change or to the presence of the
strongly excluded osmolyte triethylene glycol, suggest-
ing that protein–protein interactions are not responsi-
ble for the two kinetic components but that two
conformations of the protein are present in solution.
The X-ray structure of the free enzyme [14] shows that
the DNA enveloping arms of the EcoRV are in a
‘closed’ conformation. Erskine et al. [35] and Schulze
et al. [36] suggested that free EcoRV may exist in
‘closed’ and ‘opened’ conformations in solution; the
existence of ‘opened’ and ‘closed’ conformations of
another restriction endonuclease, BsoBI, in the solu-
tion was recently demonstrated [37]. Work is currently
Parameters modulating EcoRV binding specificity N. Y. Sidorova et al.
2720 FEBS Journal 278 (2011) 2713–2727 Journal compilation ª 2011 FEBS. No claim to original US government works
in progress to further characterize the slowly associat-
ing component, the equilibrium distribution between
slowly and fast associating forms of protein, and their
exchange kinetics. The purpose of the kinetics experi-
ment for this study was to determine incubation times
necessary to establish EcoRV equilibrium binding.
We measured the ratio of association binding con-
stants of EcoRV to a 310 bp DNA fragment contain-
ing the specific recognition site, K
sp
, and a 30 bp
nonspecific oligonucleotide, K
nsp
, using the self-cleav-
age assay and varying osmotic pressure, pH and salt.
The strong pH dependence of the relative binding con-
stant is in qualitative agreement with the results of
Engler et al. [10]. A significant pH dependence of bind-
ing specificity was observed also for another type II
restriction endonuclease, MunI [38]. Although both
K
nsp
and K
sp
increase significantly with decreasing pH,
we previously observed no pH dependence of K
nsp-sp
for EcoRI [25]. Only a weak pH dependence for spe-
cific and nonspecific binding of PvuII, a close relative
of EcoRV, was seen both in the absence and presence
of divalent metal ions [34].
At the lower pH values (< 6.5), K
nsp-sp
for EcoRV
is comparable to the competitive binding constants
at pH 7.0 for EcoRI ($ 1–2 · 10
4
) [2,25] and BamHI
($ 2 · 10
3
) [20]. At pH 7.6 that maximizes enzyme
activity, binding specificity is surprisingly low com-
pared with EcoRI and BamHI. Even so it is still sig-
nificantly higher than has been reported elsewhere. If
we assume that EcoRV spans $ 10–15 bp [14], then
the ratio of association binding constants for binding
to the recognition sequence and to a single 10–15 bp
nonspecific site is $ 800–1100, the product of K
nsp-sp
and the number of possible nonspecific sites on the
30 bp nonspecific oligonucleotide. This is then quite
specific. The factor of $ 60 difference (measured at
pH 7.6) between binding to the 310 bp specific site
DNA fragment that has $ 300 nonspecific sites and
to a nonspecific 30 bp oligonucleotide that contains
some 20 possible nonspecific sites would also suggest
that the specific site DNA fragment should have a
significant fraction of nonspecifically bound protein,
$ 30% of the total protein bound to the specific
site. The fraction of nonspecifically bound protein
would be negligible though ($ 1% of the total pro-
tein bound to the specific site) at pH 6.3 where K
nsp-
sp
is $ 1200. Nonetheless, the ratio of equilibrium
constants for binding to the 310 bp specific site
DNA fragment and to a specific site 30 bp oligonu-
cleotide remains the same in the limit of experimen-
tal error at both pH 6.3 and pH 7.6. The
self-cleavage assay protocol does not stabilize Eco RV
nonspecifically bound to the DNA fragment long
enough to find the recognition site and register as
specifically bound.
A pH dependence of K
nsp-sp
would indicate a differ-
ence in DNA–protein charge interactions between the
specific and nonspecific complexes that should conse-
quently be linked to a difference in salt concentration
sensitivity. Figure 7 shows that between pH 7.6 and
6.3 the specific complex binds $ 1.5 more ions than
the nonspecific complex.
The osmotic pressure dependence of K
nsp-sp
reports
on the difference between specific and nonspecific com-
plexes in the number of water molecules associated
with complex that exclude osmolyte, DN
w,nsp-sp
. Osmo-
lytes can be excluded from water associated with
DNA–protein complexes due to either a steric exclu-
sion from cavities or a preferential hydration of
exposed protein and DNA surfaces ([39] and references
cited there). An exclusion of solutes necessarily means
an inclusion of water. As with BamHI [16,17], a major
structural difference is the presence of a gap between
the DNA and EcoRV protein interfaces in the nonspe-
cific complex that is not present in the specific complex
that has mainly direct protein–DNA contacts [14,15].
Once osmolytes are sufficiently large that they are ste-
rically excluded from this cavity, the contribution from
this gap to DN
w,nsp-sp
will not depend on the solute
nature. The size of this cavity for the EcoRV nonspe-
cific complex is comparable to that seen for BamHI
[17]. The expected contribution to DN
w,nsp-sp
from the
difference between the DNA–protein interfaces of the
specific and nonspecific complexes is $ 100–150 water
molecules per complex. The difference in the number
of included water molecules between the specific and
nonspecific complexes due to a preferential hydration
will depend on the natures of the osmolyte and of the
protein and DNA surfaces and on the change in
exposed surface area between the two structures. The
DN
w,nsp-sp
values for betaine glycine, a-methyl gluco-
side and TMAO are reasonably consistent, 115–150
waters, suggesting a dominating contribution from the
cavity for these osmolytes compared with a difference
in exposed surface area. More osmolyte variation is
observed for EcoRV, however, than we previously
reported for EcoRI and BamHI [2,20]. The observed
DN
w,nsp-sp
for triethylene glycol, $ 224 at pH 6.8
(Fig. 6), is quite different from the other solutes and
indicates a significant difference in exposed surface
area between the specific and nonspecific complexes of
EcoRV in addition to the cavity. We have found that
triethylene glycol is particularly effective in stabilizing
specific complexes through exclusion from exposed
surfaces compared with a-methyl glucoside and beta-
ine glycine [20–22,25]. The large osmotic pressure
N. Y. Sidorova et al. Parameters modulating EcoRV binding specificity
FEBS Journal 278 (2011) 2713–2727 Journal compilation ª 2011 FEBS. No claim to original US government works 2721
dependence of K
nsp-sp
observed for EcoRV is compara-
ble with that seen for EcoRI and BamHI that have
much larger sequence specificities in the absence of
divalent cations. Even though Hiller et al. [23] did not
observe a DNA bend in the specific complex without
divalent cations, the protein and DNA still seem to
make the direct, specific complex-like contacts that are
necessary to account for the large difference in seques-
tered water between complexes with specific and non-
specific sequences. The large osmotic pressure
dependence observed for K
nsp-sp
also means that mea-
surement of protein–DNA specificity in dilute solution
cannot be directly applied to binding in the crowded
environment of the cell. Osmotic pressure is a thermo-
dynamic parameter that is as important as salt concen-
tration and pH.
The strong pH dependence of K
nsp-sp
(Fig. 6 and
Table 1) in the absence of divalent ions might suggest
that the structures of the specific or nonspecific EcoRV
complexes are pH dependent. The insensitivity of
DN
w,nsp-sp
for betaine glycine to pH in the range
6.3–7.6, however, would suggest that the cavity at the
protein–DNA of the nonspecific complex and the more
direct association of the recognition DNA and protein
surfaces of the specific complex remain unchanged with
pH to within $ 10 water molecules. The enzyme is bind-
ing DNA in a specific manner with direct DNA–protein
contacts even at pH 7.6. The observation of a full water
complement at pH 7.6 implies that K
nsp-sp
cannot be
small. If there was no difference between EcoRV bind-
ing to nonspecific and specific sequences at pH 7.6, then
only the nonspecific mode of binding would be realized
on the specific sequence and DN
w,nsp-sp
would be zero. If
the specific and nonspecific binding modes of the
EcoRV on the recognition site had the same binding free
energy, then both structures would be equally probable
at the recognition site and D N
w,nsp-sp
would be half that
for the actual difference between specific and nonspecific
complexes, not the full value measured (Fig. 5 and
Table 1). The more substantial increase in DN
w,nsp-sp
for
triethylene glycol from 225 to 284 ($ 25%) as the pH is
lowered from 7.6 to 6.3 suggests a further change in
exposed surface area of either the specific or nonspecific
complex. Major structural changes in either the specific
or the nonspecific complex, however, do not seem to
occur over the pH range examined.
Several experiments shown in Fig. 5 were done
under conditions such that protein binding was not
virtually stoichiometric. We can estimate the equilib-
rium dissociation binding constant of the specific
EcoRV–DNA complex at pH 7.6, 100 mm NaCl and
no osmolyte as $ 2–4 nm. This value is in reasonably
good agreement with the value of $ 3nm reported by
Engler et al. for pH 7.4 and 105 mm NaCl. For each
pH we can also determine the minimal osmolyte con-
centration at which EcoRV specific binding in the
absence of nonspecific competitor oligonucleotide
becomes practically stoichiometric (defined as > 95%
protein binding to DNA). For all three pH values, spe-
cific sequence stoichiometric binding is reached when
K
nsp-sp
$ 1200 implying that K
sp
changes with pH and
that K
nsp
is relatively pH insensitive. This is consistent
with the conclusions of Engler et al. [10]. Since K
nsp
seems relatively insensitive to pH, we conclude that the
specific complex releases some 1.5 additional ions at
pH 6.3 compared with pH 7.6. We cannot find titrat-
able histidine groups that are in close contact with
DNA in the specific complex but not in the nonspecific
complex structure. We therefore agree with several
groups [11,12,18,38] that the negatively charged amino
acids in the active site of the enzyme are responsible
for the pH dependence of K
nsp-sp
and K
sp
. Binding
divalent ions to these sites would neutralize the excess
negative charge at pH 7.6. K
nsp-sp
with added divalent
ion would then more closely approximate K
nsp-sp
at
much lower pH values without divalent cations.
Conclusions
We have re-examined the specificity of EcoRV restric-
tion endonuclease binding using a self-cleavage assay
that only monitors the formation of enzymatically
competent complexes. There are several binding prop-
erties of this enzyme that distinguish it from both
EcoRI and BamHI restriction endonucleases.
The binding specificity of the EcoRV is strongly pH
dependent (again quite contrary to the EcoRI). The
salt dependence of K
nsp-sp
is also pH dependent sug-
gesting that differences in DNA–protein charge–charge
interactions between the specific and nonspecific com-
plex accompany pH changes.
The difference between the binding free energies of
specific and nonspecific complexes strongly depends on
neutral solute concentration. The osmotic pressure
dependence of K
nsp-sp
for three of the four osmolytes
examined is consistent with a dominating contribution
from the cavity at the protein–DNA interface seen in
the X-ray structure of the nonspecific complex. Con-
trary to both EcoRI and BamHI, however, DN
w,nsp-sp
depends on the nature of the osmolyte used to set the
osmotic pressure; triethylene glycol in particular is
highly excluded from the specific complex compared
with the nonspecific one. This solute sensitivity sug-
gests that differences between specific and nonspecific
complexes are not limited by the cavity seen at the
DNA–protein interface in the nonspecific complex.
Parameters modulating EcoRV binding specificity N. Y. Sidorova et al.
2722 FEBS Journal 278 (2011) 2713–2727 Journal compilation ª 2011 FEBS. No claim to original US government works
There is an additional conformational change in sur-
face-exposed area between the two structures. Despite
the large changes in K
nsp-sp
with pH, DN
w,nsp-sp
mea-
sured using betaine glycine has very little pH sensitiv-
ity, suggesting that the structures of the specific and
nonspecific complexes change minimally with pH. The
pH dependence of DN
w,nsp-sp
measured using triethyl-
ene glycol would suggest that there is a slight change
in exposed surface area.
Lastly, EcoRV restriction endonuclease binds DNA
specifically in the absence of divalent cations. Even at
pH 7.6, the binding constant to the single specific site
is about 1000-fold higher than the binding constant to
a single nonspecific site. In addition to divalent metal
ions, water activity and pH are key parameters that
strongly modulate binding specificity of the EcoRV.
Materials and methods
Materials
A 533 bp DNA fragment containing a single EcoRV recog-
nition sequence was isolated from the SphI and HindIII
digestion of pBR322 plasmid using standard techniques. A
310 bp long DNA fragment containing one EcoRV cognate
sequence was then obtained by PCR of the 533 bp frag-
ment using internal primer sequences. The 24 nucleotide
PCR primer oligonucleotides used to generate the 310 bp
fragment were complementary to bp 80–104 and 366–390
of pBR322; the EcoRV site is at bp 185. Cleavage of the
310 bp DNA fragment with the EcoRV produces DNA
fragments 107 bp and 203 bp long. The pBR322 plasmid
and restriction enzymes SphI and HindIII were purchased
from New England Biolabs (Ipswich, MA, USA). The pri-
mer oligonucleotides were purchased from Invitrogen
(Grand Island, NY, USA).
The sequences of the double-stranded 30 bp long EcoRV
specific site and nonspecific oligonucleotides used were 5¢-
CGGGCCTCTTGCGGGATATCGTCCATTCCG-3¢ and
5¢-CGGGCCTCTTGCGG
CTATAGGTCCATTCCG-3¢ res-
pectively. The EcoRV recognition sequence is shown in
bold. The EcoRV nonspecific sequence oligonucleotide has
the same sequence except that the recognition sequence is
replaced with an inverted EcoRV recognition sequence
(underlined). The double-stranded oligonucleotides were
prepared as described previously [20]. The specific sequence
double-stranded oligonucleotide was additionally purified
on a Protein Pak anion exchange column (Waters, Milford,
MA, USA) using AKTA Purifier (GE Healthcare Life
Sciences, Piscataway, NJ, USA). Double-stranded oligo-
nucleotides were then ethanol precipitated and dissolved in
TE buffer (10 mm TrisCl (pH 7.5), 1 mm EDTA). The pur-
ity of the double-stranded oligonucleotides was confirmed
by PAGE. The concentrations of the DNA fragment and
double-stranded oligonucleotides were determined spectro-
photometrically, using an extinction coefficient of 0.013 (cm
lm base pairs)
)1
at 260 nm.
DNA binding and cleavage experiments were performed
with highly purified EcoRV restriction endonuclease
(described below) or with a commercial EcoRV sample pur-
chased from New England Biolabs. Active protein concen-
trations of the EcoRV were determined by direct titration
with the specific site 310 bp DNA fragment under conditions
of stoichiometric binding as described previously [2,20].
Betaine glycine, a-methyl glucoside, triethylene glycol and
TMAO were purchased from Fluka Analytical. All solutes
were used without further purification. Osmolal concentra-
tions of solutes were determined by direct measurement
using a vapor pressure osmometer operating at room
temperature (Wescor, Logan, UT, USA, model 5520XR).
EcoRV purification
EcoRV was purified using a modified procedure of the
method developed by Luke et al. [40]. Escherichia coli strain
CSH50 (pMetB) as well as the plasmid mix pBSKSRVD ⁄
pMetB were kind gifts of A. Prota and F. Winkler (Paul
Scherrer Institut, Switzerland). Plasmid pMetB (constructed
to overproduce EcoRV methylase) is described in [29].
pBSKSRVD plasmid is a modification [41] of the original
plasmid constructed for EcoRV nuclease overproduction
[42]. The cell disruption step was performed using CelLytic
protocol ⁄ reagents from Sigma Chemical (Bellefonte, PA,
USA). Column chromatography was performed using an
AKTA Purifier system (GE Healthcare Life Sciences). The
protein was initially bound to a phosphocellulose column in
20 mm K
2
HPO
4
(pH 7.0), 1 mm EDTA, 10 mm dithiothrei-
tol, 10% glycerol and 0.2 m NaCl. EcoRV was eluted at
$ 0.4 m NaCl using a salt gradient. The protein was further
purified using a HiTrap Blue Sepharose column (GE Health-
care Life Sciences). The enzyme was eluted with a linear gra-
dient of 0.2–0.8 m NaCl also in 20 mm K
2
HPO
4
(pH 7.0),
1mm EDTA, 10 mm dithiothreitol and 10% glycerol and
came off the column at 0.675 m NaCl. Purity of the EcoRV
endonuclease was confirmed by SDS ⁄ PAGE. The purified
protein was aliquoted and stored at )80 °C. Enzyme stock
solutions routinely used in the experiments were adjusted to
10 mm K
2
HPO
4
(pH 7.0), 0.5 mm EDTA, 5 mm dithiothrei-
tol, 338 mm NaCl, 55% glycerol and 200 lgÆmL
)1
acetylated
BSA and were stored at )20 °C. We determined active
protein concentrations by titration to the specific DNA
fragment under conditions of stoichiometric binding as
described previously [20]. There is no measurable decrease in
protein activity after 18 months storage at )20 °C.
Self-cleavage assay
To measure the fraction of DNA with specifically bound
EcoRV by the self-cleavage assay, described in detail in
N. Y. Sidorova et al. Parameters modulating EcoRV binding specificity
FEBS Journal 278 (2011) 2713–2727 Journal compilation ª 2011 FEBS. No claim to original US government works 2723
[20,26], 30 lL of a cleavage mixture containing imidazole
buffer, triethylene glycol, MgCl
2
and specific site
oligonucleotide was added to pre-equilibrated 30 lL sam-
ples of EcoRV–DNA complexes. The composition of the
cleavage mixture was adjusted to ensure a final pH of
6.5–6.8 and final concentrations of 10 mm MgCl
2
,
100 mm NaCl and 400-fold molar excess of specific site
oligonucleotide competitor over the specific site fragment.
Enough triethylene glycol was added to the cleavage mix-
ture to ensure a final total osmotic pressure of 3 osmolal.
Samples were then incubated for 20 min at 20 °C; the
cleavage reaction was stopped by adding EDTA to a
final concentration of 20 mm. DNA digestion products
were purified using GenElute PCR Clean-up kit (Sigma
Chemical).
Equilibrium binding experiments
Binding reaction mixtures contained 20 m m imidazole (for
the pH range 6.3–8.0) or 20 mm Mes buffer (for the pH
range 5.7–6.7), 60–140 mm NaCl, 2 mm dithiothreitol,
50 lgÆmL
)1
acetylated BSA and 0.1 mm EDTA. The total
reaction volume was 30 lL. Specific–nonspecific equilibrium
competition experiments were performed as described previ-
ously [2,20]. Briefly, mixtures of EcoRV ($ 1.5 nm), the
specific site fragment ($ 3nm) and the nonspecific oligonu-
cleotide competitor (between 0 and $ 50 lm in oligonucleo-
tide) were incubated at 20 °C overnight to ensure
equilibrium. The loss of specific site binding as the concen-
tration of nonspecific competitor DNA increased was deter-
mined by the self-cleavage assay.
Association and dissociation kinetics
Solution conditions for the EcoRV kinetic experiments were
20 mm imidazole (pH 6.3, 6.8 and 7.6), 100 mm NaCl,
2mm dithiothreitol, 50 lgÆmL
)1
BSA and 0.1 mm EDTA.
To measure complex formation kinetics EcoRV ($ 1.5 n m)
was incubated with the 310 bp specific site DNA fragment
($ 3nm). At timed intervals 30 lL aliquots were with-
drawn from the DNA–protein pool and fractions of specifi-
cally bound EcoRV assayed using the self-cleavage
technique.
Dissociation kinetics were measured using a standard
approach. EcoRV ($ 1.5 nm) was initially incubated at
20 °C overnight with the 310 bp specific site DNA fragment
($ 3nm). EcoRV specific sequence oligonucleotide was
then added to a final 400–4000 fold excess molar concentra-
tion over DNA fragment. The fraction of specifically bound
EcoRV was determined at timed intervals using the self-
cleavage assay. In this case, the cleavage mixture contained
only Mg
2+
and triethylene glycol. Specific site oligonucleo-
tide was omitted from the cleavage mixture since significant
excess of the oligonucleotide was already present in the
reaction mixture.
Gel electrophoresis
Ficoll was added to the DNA digestion products from the
self-cleavage assay to a final concentration of 3% and sam-
ples were then loaded on a 9% polyacrylamide gel; the run-
ning buffer was TAE (22.5 mm Tris, 11.25 mm acetic acid,
0.5 mm EDTA, pH 8.3). Samples were run at 350 V for
2.5–3 h.
We have modified the standard protocol for gel mobility
shift experiments in order to prevent perturbation of the
equilibrium between free DNA and complex in the electro-
phoretic well. A stop reaction mixture (30 lL) was added
to each 30 lL sample to ‘trap’ the equilibrium fraction of
specifically bound DNA [26]. The composition of the stop
reaction mixture was such to ensure that the final mix con-
tained $ 400-fold molar excess of the specific site oligonu-
cleotide over the specific site fragment and enough
triethylene glycol to ensure a final osmotic pressure of 3
osmolal. Samples were then loaded on 9% polyacrylamide
gel; the running buffer was 20 mm imidazole (pH 6.9).
Samples were electrophoresed at 350 V for 3.5–4 h. Electro-
phoretic bands containing free DNA and DNA–protein
complex (in the case of the gel mobility shift assay) or unc-
leaved and cleaved DNA fragments (self-cleavage assay)
were stained with the fluorescent dye SYBR Green I
(Molecular Probes, Eugene, OR, USA). The gels were
imaged with a FLA-3000 Fluorescent Image Analyzer (Fuji
Film, Stamford, CT, USA). The FLA-3000 was interfaced
to a Pentium PC. Band intensities were quantified using the
Fuji Film software multigauge for windows.
Equilibrium competition analysis
As was developed previously [2,20], the ratio of specific (sp)
and nonspecific (nsp) association binding constants
(K
sp
⁄ K
nsp
) can be determined from the loss of specific com-
plex as the concentration of a nonspecific oligonucleotide
competitor is increased. If f
b
and f
b
0
are the fractions of
protein-bound specific site fragment with and without
added oligonucleotide competitor, respectively, then under
conditions of virtually stoichiometric protein binding
(< 5% free protein) and for much weaker nonspecific than
specific binding (K
nsp
« K
sp
), the concentration of nonspe-
cific complex can be easily calculated as equal to
(f
b
0
) f
b
)[DNA
sp
]
total
. Specific sequence binding is given
then by
f
b
¼ f
0
b
À
K
nsp
K
sp
f
b
1 À f
b
½DNA
nsp
total
½DNA
sp
total
ð1Þ
where [DNA
sp
]
total
is the molar concentration of specific
sequence fragment and [DNA
nsp
]
total
is the molar concen-
tration of nonspecific oligonucleotide. Competitive binding
constants K
sp
⁄ K
nsp
were straightforwardly calculated from
the linear dependence of fraction bound DNA, f
b
,on
Parameters modulating EcoRV binding specificity N. Y. Sidorova et al.
2724 FEBS Journal 278 (2011) 2713–2727 Journal compilation ª 2011 FEBS. No claim to original US government works
f
b
[DNA
nsp
]
total
⁄ (1 ) f
b
)[DNA
sp
]
total
, measured at constant
specific sequence DNA and protein concentrations. We also
performed equilibrium competition experiments under non-
stoichiometric binding conditions. In this case, the concen-
tration of nonspecific complex, [DNA
nsp
]
bound
, cannot be
calculated directly from the loss of specific binding. The
concentrations of free protein and of the nonspecific com-
plex should be calculated using the specific association con-
stant K
sp
that can be determined from binding in the
absence of competitor (described in detail in [20]). The rela-
tive specific–nonspecific binding constant can then be
straightforwardly calculated:
K
nspÀsp
¼
K
sp
K
nsp
¼
f
b
½DNA
nsp
total
ð1 À f
b
Þ½DNA
nsp
bound
ð2Þ
All values of K
nsp-sp
given here are the average of three to
four experiments.
The difference in the numbers of solute molecules exclud-
ing water molecules between specifically and nonspecifically
bound protein can be calculated from the dependence of
K
sp
⁄ K
nsp
on the solute osmolal concentration [2] by
d lnðK
nspÀsp
Þ
d ½osmolal
¼
d lnðK
sp
=K
nsp
Þ
d ½osmolal
¼À
DN
w;nspÀsp
55:6
ð3Þ
where DN
w,nsp-sp
= N
w,sp
) N
w,nsp
, the difference in the
numbers of water molecules associated with specific and
nonspecific complexes that exclude solute.
Acknowledgements
We greatly appreciate the generous gift of Escherichia
coli strain CSH50 (pMetB) and plasmid mix
pBSKSRVD ⁄ pMetB from Dr Andrea Prota and Dr
Fritz Winkler (Paul Scherrer Institut, Switzerland). We
are deeply grateful to Dr Galina Obmolova (Centocor)
and Dr Andrea Prota for their valuable advice regard-
ing EcoRV purification. This work was supported by
the Intramural Research Program of the NICHD,
National Institutes of Health.
References
1 Lesser DR, Kurpiewski MR & Jen-Jacobson L (1990)
The energetic basis of specificity in the EcoRI endonu-
clease–DNA interaction. Science 250, 776–786.
2 Sidorova NY & Rau DC (1996) Differences in water
release for the binding of EcoRI to specific and nonspe-
cific DNA sequences. Proc Natl Acad Sci USA 93,
12272–12277.
3 Thielking V, Alves J, Fliess A, Maass G & Pingoud A
(1990) Accuracy of the EcoRI restriction endonuclease:
binding and cleavage studies with oligodeoxynucleotide
substrates containing degenerate recognition sequences.
Biochemistry 29, 4682–4691.
4 Taylor JD, Badcoe IG, Clarke AR & Halford SE
(1991) EcoRV restriction endonuclease binds all DNA
sequences with equal affinity. Biochemistry 30, 8743–
8753.
5 Thielking V, Selent U, Kohler E, Landgraf A, Wolfes
H, Alves J & Pingoud A (1992) Mg2+ confers DNA
binding specificity to the EcoRV restriction endonucle-
ase. Biochemistry 31, 3727–3732.
6 Vermote CL & Halford SE (1992) EcoRV restriction
endonuclease: communication between catalytic metal
ions and DNA recognition. Biochemistry 31, 6082–6089.
7 Vipond IB & Halford SE (1995) Specific DNA recogni-
tion by EcoRV restriction endonuclease induced by
calcium ions. Biochemistry 34 , 1113–1119.
8 Alves J, Selent U & Wolfes H (1995) Accuracy of the
EcoRV restriction endonuclease: binding and cleavage
studies with oligodeoxynucleotide substrates containing
degenerate recognition sequences. Biochemistry 34,
11191–11197.
9 Szczelkun MD & Connolly BA (1995) Sequence-specific
binding of DNA by the EcoRV restriction and modifi-
cation enzymes with nucleic acid and cofactor ana-
logues. Biochemistry 34, 10724–10733.
10 Engler LE, Welch KK & Jen-Jacobson L (1997) Specific
binding by EcoRV endonuclease to its DNA recognition
site GATATC. J Mol Biol 269, 82–101.
11 Martin AM, Horton NC, Lusetti S, Reich NO & Pero-
na JJ (1999) Divalent metal dependence of site-specific
DNA binding by EcoRV endonuclease. Biochemistry
38, 8430–8439.
12 Reid SL, Parry D, Liu HH & Connolly BA (2001)
Binding and recognition of GATATC target sequences
by the EcoRV restriction endonuclease: a study using
fluorescent oligonucleotides and fluorescence polariza-
tion. Biochemistry 40, 2484–2494.
13 Erskine SG & Halford SE (1998) Reactions of the eco
RV restriction endonuclease with fluorescent oligode-
oxynucleotides: identical equilibrium constants for bind-
ing to specific and non-specific DNA.
J Mol Biol 275,
759–772.
14 Winkler FK, Banner DW, Oefner C, Tsernoglou D,
Brown RS, Heathman SP, Bryan RK, Martin PD,
Petratos K & Wilson KS (1993) The crystal structure of
EcoRV endonuclease and of its complexes with cognate
and non-cognate DNA fragments. EMBO J 12,
1781–1795.
15 Horton NC & Perona JJ (1998) Role of protein-induced
bending in the specificity of DNA recognition: crystal
structure of EcoRV endonuclease complexed with
d(AAAGAT) + d(ATCTT). J Mol Biol 277, 779–787.
16 Newman M, Strzelecka T, Dorner LF, Schildkraut I &
Aggarwal AK (1995) Structure of Bam HI endonuclease
N. Y. Sidorova et al. Parameters modulating EcoRV binding specificity
FEBS Journal 278 (2011) 2713–2727 Journal compilation ª 2011 FEBS. No claim to original US government works 2725
bound to DNA: partial folding and unfolding on DNA
binding. Science 269, 656–663.
17 Viadiu H & Aggarwal AK (2000) Structure of BamHI
bound to nonspecific DNA: a model for DNA sliding.
Mol Cell 5, 889–895.
18 Winkler FK & Prota AE (2003) Structure and function
of EcoRV endonuclease. In Restriction Endonucleases
(Pingoud A ed), pp 179–214. Springer, Berlin.
19 Sidorova NY & Rau DC (2004) Differences between
EcoRI nonspecific and ‘star’ sequence complexes
revealed by osmotic stress. Biophys J 87, 2564–2576.
20 Sidorova NY, Muradymov S & Rau DC (2006) Differ-
ences in hydration coupled to specific and nonspecific
competitive binding and to specific DNA Binding of the
restriction endonuclease BamHI. J Biol Chem 281,
35656–35666.
21 Garner MM & Rau DC (1995) Water release associated
with specific binding of gal repressor. EMBO J 14,
1257–1263.
22 Rau DC (2006) Sequestered water and binding energy
are coupled in complexes of lambda Cro repressor with
non-consensus binding sequences. J Mol Biol 361,
352–361.
23 Hiller DA, Fogg JM, Martin AM, Beechem JM, Reich
NO & Perona JJ (2003) Simultaneous DNA binding
and bending by EcoRV endonuclease observed by real-
time fluorescence. Biochemistry 42, 14375–14385.
24 Thorogood H, Waters TR, Parker AW, Wharton CW
& Connolly BA (1996) Resonance Raman spectroscopy
of 4-thiothymidine and oligodeoxynucleotides contain-
ing this base both free in solution and bound to the
restriction endonuclease EcoRV. Biochemistry 35,
8723–8733.
25 Sidorova NY & Rau DC (2001) Linkage of EcoRI dis-
sociation from its specific DNA recognition site to
water activity, salt concentration, and pH: separating
their roles in specific and non-specific binding. J Mol
Biol 310, 801–816.
26 Sidorova NY, Muradymov S & Rau DC (2005) Trap-
ping DNA–protein binding reactions with neutral osm-
olytes for the analysis by gel mobility shift and self-
cleavage assays. Nucleic Acids Res 33, 5145–5155.
27 Fried M & Crothers DM (1981) Equilibria and kinetics
of lac repressor–operator interactions by polyacrylamide
gel electrophoresis. Nucleic Acids Res 9, 6505–6525.
28 Garner MM & Revzin A (1981) A gel electrophoresis
method for quantifying the binding of proteins to spe-
cific DNA regions: application to components of the
Escherichia coli lactose operon regulatory system.
Nucleic Acids Res 9, 3047–3060.
29 Vermote CL, Vipond IB & Halford SE (1992) EcoRV
restriction endonuclease: communication between DNA
recognition and catalysis. Biochemistry 31, 6089–6097.
30 Sam MD & Perona JJ (1999) Mn2+-dependent cataly-
sis by restriction enzymes: pre-steady-state analysis of
EcoRV endonuclease reveals burst kinetics and the ori-
gins of reduced activity. J Am Chem Soc 121, 1444–
1447.
31 Hancock SP, Hiller DA, Perona JJ & Jen-Jacobson L
(2011) The energetic contribution of induced electro-
static asymmetry to DNA bending by a site-specific pro-
tein. J Mol Biol
406, 285–312.
32 Xie F, Qureshi SH, Papadakos GA & Dupureur CM
(2008) One- and two-metal ion catalysis: global single-
turnover kinetic analysis of the PvuII endonuclease
mechanism. Biochemistry 47, 12540–12550.
33 Conlan LH & Dupureur CM (2002) Multiple metal
ions drive DNA association by PvuII endonuclease.
Biochemistry 41, 14848–14855.
34 Conlan LH & Dupureur CM (2002) Dissecting the
metal ion dependence of DNA binding by PvuII endo-
nuclease. Biochemistry 41, 1335–1342.
35 Erskine SG, Baldwin GS & Halford SE (1997) Rapid-
reaction analysis of plasmid DNA cleavage by the EcoRV
restriction endonuclease. Biochemistry 36, 7567–7576.
36 Schulze C, Jeltsch A, Franke I, Urbanke C & Pingoud
A (1998) Crosslinking the EcoRV restriction endonucle-
ase across the DNA-binding site reveals transient inter-
mediates and conformational changes of the enzyme
during DNA binding and catalytic turnover. EMBO J
17, 6757–6766.
37 Dikic J (2009) The Conformational Dynamics of BsoBI,
Analyzed by Fluorescence Spectroscopy Down to the Sin-
gle Molecule Level. Justus-Liebig-University, Giessen.
38 Haq I, O’Brien R, Lagunavicius A, Siksnys V & Lad-
bury JE (2001) Specific DNA recognition by the type II
restriction endonuclease MunI: the effect of pH.
Biochemistry 40, 14960–14967.
39 Parsegian VA, Rand RP & Rau DC (2000) Osmotic
stress, crowding, preferential hydration, and binding:
a comparison of perspectives. Proc Natl Acad Sci USA
97, 3987–3992.
40 Luke PA, McCallum SA & Halford SE (1987) The
EcoR V restriction endonuclease. Gene Amplif Anal 5,
185–207.
41 Vipond IB & Halford SE (1996) Random mutagenesis
targeted to the active site of the EcoRV restriction
endonuclease. Biochemistry 35, 1701–1711.
42 Bougueleret L, Tenchini ML, Botterman J & Zabeau M
(1985) Overproduction of the EcoR V endonuclease and
methylase. Nucleic Acids Res 13, 3823–3839.
Supporting information
The following supplementary material is available:
Fig. S1. Control experiment for the self-cleavage assay
demonstrating that a sufficient excess of specific
sequence oligonucleotide precludes DNA fragment re-
binding and cleavage by the EcoRV.
Parameters modulating EcoRV binding specificity N. Y. Sidorova et al.
2726 FEBS Journal 278 (2011) 2713–2727 Journal compilation ª 2011 FEBS. No claim to original US government works
Fig. S2. (A) No measurable difference in kinetics was
observed at pH 7.6 in the presence of 1 osmolal (•)or
2 osmolal (D) triethylene glycol. (B) Twofold change in
the EcoRV concentration does not affect the kinetics
of complex formation.
Fig. S3. Comparative kinetics of EcoRV–DNA and
EcoRI–DNA complex formation.
Fig. S4. Dissociation kinetics of the specific DNA–
EcoRV complex can be fit with a single exponential.
Fig. S5. Specific sequence oligonucleotide is a much
more effective competitor for the EcoRV binding than
the nonspecific oligonucleotide at pH 7.6.
This supplementary material can be found in the
online version of this article.
Please note: As a service to our authors and readers,
this journal provides supporting information supplied
by the authors. Such materials are peer-reviewed and
may be reorganized for online delivery, but are not
copy-edited or typeset. Technical support issues arising
from supporting information (other than missing files)
should be addressed to the authors.
N. Y. Sidorova et al. Parameters modulating EcoRV binding specificity
FEBS Journal 278 (2011) 2713–2727 Journal compilation ª 2011 FEBS. No claim to original US government works 2727