The Diesel Exhaust in Miners Study: A Nested Case–Control Study of Lung Cancer and Diesel Exhaust pptx
Bạn đang xem bản rút gọn của tài liệu. Xem và tải ngay bản đầy đủ của tài liệu tại đây (547.68 KB, 14 trang )
jnci.oxfordjournals.org JNCI
|
Article 1
DOI: 10.1093/jnci/djs034 Published by Oxford University Press 2012.
The question of whether diesel exhaust causes lung cancer in
humans has been investigated in many studies since the 1980s. In
1989, the International Agency for Research on Cancer (IARC)
classified diesel exhaust as a “probable” carcinogen (IARC
classification: Group 2A) based on “sufficient” experimental evi-
dence and “limited” evidence of carcinogenicity in humans (1).
Two meta-analyses (2,3) of epidemiological studies have estimated
the summary relative risk for lung cancer for those ever occupa-
tionally exposed to diesel exhaust as 1.33 (95% confidence interval
[CI] = 1.24 to 1.44) (2) and 1.47 (95% CI = 1.29 to 1.67) (3), based
on more than 35 studies. A pooled analysis (4) of 13 304 case sub-
jects and 16 282 control subjects from 11 lung cancer case–control
studies in Europe and Canada yielded an odds ratio (OR) of 1.31
(95% CI = 1.19 to 1.43) for subjects in the highest vs lowest quartile
of cumulative diesel exposure based on a job exposure matrix (4).
Although these meta-analyses (2,3) and the pooled analysis (4)
suggest a modest but consistent effect, the excesses are in a range
that could be explained by confounding (5), particularly from
ARTICLE
The Diesel Exhaust in Miners Study: A Nested Case–Control
Study of Lung Cancer and Diesel Exhaust
Debra T. Silverman, Claudine M. Samanic, Jay H. Lubin, Aaron E. Blair, Patricia A. Stewart, Roel Vermeulen, Joseph B. Coble,
Nathaniel Rothman, Patricia L. Schleiff, William D. Travis, Regina G. Ziegler, Sholom Wacholder, Michael D. Attfield
Manuscript received February 16, 2011; revised June 3, 2011; accepted October 21, 2011.
Correspondence to: Debra T. Silverman, ScD, Occupational and Environmental Epidemiology Branch, Division of Cancer Epidemiology and Genetics,
National Cancer Institute, Rm 8108, 6120 Executive Blvd, Bethesda, MD 20816 (e-mail: ).
Background Most studies of the association between diesel exhaust exposure and lung cancer suggest a modest, but con-
sistent, increased risk. However, to our knowledge, no study to date has had quantitative data on historical
diesel exposure coupled with adequate sample size to evaluate the exposure–response relationship between
diesel exhaust and lung cancer. Our purpose was to evaluate the relationship between quantitative estimates of
exposure to diesel exhaust and lung cancer mortality after adjustment for smoking and other potential
confounders.
Methods We conducted a nested case–control study in a cohort of 12 315 workers in eight non-metal mining facilities,
which included 198 lung cancer deaths and 562 incidence density–sampled control subjects. For each case
subject, we selected up to four control subjects, individually matched on mining facility, sex, race/ethnicity, and
birth year (within 5 years), from all workers who were alive before the day the case subject died. We estimated
diesel exhaust exposure, represented by respirable elemental carbon (REC), by job and year, for each subject,
based on an extensive retrospective exposure assessment at each mining facility. We conducted both categor-
ical and continuous regression analyses adjusted for cigarette smoking and other potential confounding vari-
ables (eg, history of employment in high-risk occupations for lung cancer and a history of respiratory disease)
to estimate odds ratios (ORs) and 95% confidence intervals (CIs). Analyses were both unlagged and lagged to
exclude recent exposure such as that occurring in the 15 years directly before the date of death (case subjects)/
reference date (control subjects). All statistical tests were two-sided.
Results We observed statistically significant increasing trends in lung cancer risk with increasing cumulative REC and
average REC intensity. Cumulative REC, lagged 15 years, yielded a statistically significant positive gradient in
lung cancer risk overall (P
trend
= .001); among heavily exposed workers (ie, above the median of the top quartile
[REC ≥ 1005 µg/m
3
-y]), risk was approximately three times greater (OR = 3.20, 95% CI = 1.33 to 7.69) than
that among workers in the lowest quartile of exposure. Among never smokers, odd ratios were 1.0, 1.47 (95%
CI = 0.29 to 7.50), and 7.30 (95% CI = 1.46 to 36.57) for workers with 15-year lagged cumulative REC tertiles of
less than 8, 8 to less than 304, and 304 µg/m
3
-y or more, respectively. We also observed an interaction between
smoking and 15-year lagged cumulative REC (P
interaction
= .086) such that the effect of each of these exposures was
attenuated in the presence of high levels of the other.
Conclusion Our findings provide further evidence that diesel exhaust exposure may cause lung cancer in humans and may
represent a potential public health burden.
J Natl Cancer Inst 2012;104:1–14
JNCI djs034 HA
JOURNAL NAME Art. No. CE Code
5
10
15
20
25
30
35
40
45
50
2 Article
|
JNCI Vol. 104, Issue 11
|
June 6, 2012
smoking. Alternatively, these excesses may be underestimates of
risk due to inadequate latent period for the development of lung
cancer in some studies or misclassification of exposure because
most epidemiological studies inferred diesel exhaust exposure from
job title in the absence of any additional information on level of
diesel exposure. In-depth studies of truck drivers (6,7) and railroad
workers (8), two occupational groups with light to moderate expo-
sure to diesel exhaust, have found nearly a doubling of lung cancer
risk among long-term workers. Retrospective exposure assess-
ments in these studies, however, were hampered by limited histor-
ical industrial hygiene measurements. In fact, few studies have
based estimates of lung cancer risk on quantitative estimates of
exposure to diesel exhaust (8–11). Only one study of German
potash miners reported results based on quantitative estimates of
historical exposures that included industrial hygiene measure-
ments but was based on only 61 lung cancer deaths (11). To our
knowledge, no study to date has had quantitative data on historical
diesel exposure coupled with adequate sample size to evaluate the
exposure–response relationship for diesel exhaust and lung cancer
with adjustment for potential confounding from cigarette smoking
and other risk factors for lung cancer.
We conducted a cohort mortality study among workers
employed at eight underground non-metal mining facilities (12)
and a companion case–control study of lung cancer nested in this
cohort to evaluate the risk of lung cancer from exposure to diesel
exhaust (The Diesel Exhaust in Miners Study [DEMS]). The
purpose of the case–control study reported in this article was to
further evaluate the exposure–response relationship between diesel
exhaust and lung cancer mortality after adjustment for cigarette
smoking and other potential confounding factors that were
unavailable in the cohort study.
Materials and Methods
Cohort Design and Follow Up
Eight non-metal mining facilities (three potash, three trona,
one limestone, and one salt [halite]) were selected from all US
non-metal mining facilities with at least 50 employees who were
considered to have had high air levels of diesel exhaust under-
ground but low levels of potential occupational confounders (ie,
radon, silica, asbestos) (12). Eligible subjects included all workers
who were ever employed in a blue-collar job for at least 1 year after
introduction of diesel equipment into the mining facility (year
of introduction: 1947–1967 across the eight facilities) until the end
of follow-up on December 31, 1997. The cohort consisted of
12 315 workers with a total of 278 041 person-years of follow-up.
More detailed information on the cohort can be found in the
accompanying article on the cohort study (12).
Case Subject Definition and Identification
Vital status of each cohort member was ascertained through
December 31, 1997, by linkage with the National Death Index
Plus (NDI Plus) ( and Social
Security Administration mortality files. Cause of death informa-
tion was obtained from NDI Plus or from death certificates (for
deaths occurring before the introduction of NDI Plus). A total of
217 deaths were identified with lung cancer (International
Classification of Diseases-O code 162) specified as either the under-
lying or contributing cause on the death certificate. We attempted
to retrieve pathology reports and diagnostic slides for all case
subjects, which proved to be challenging because 85% of the
case subjects had died more than 10 years before we contacted
the hospital. After repeated attempts, we successfully obtained
pathology reports or slides for 70 of the 170 case subjects for
whom we obtained consent to access medical records. When the
pathology report or diagnostic slides were available, the diagnosis
of lung cancer was confirmed through review by an expert pathol-
ogist (W. D. Travis), which resulted in the exclusion of one case
subject as “unlikely” to have had lung cancer. Of the 217 eligible
case subjects identified, we interviewed 213 (98.1%) of their next
of kin.
Control Subject Selection for the Nested Case–Control
Study
Based on incidence density sampling, we selected up to four con-
trol subjects for each lung cancer case subject by random sampling
from all members of the study cohort who were alive before the
day the case subject died. With this design, all cohort members
were eligible to serve as control subjects for more than one case
subject, and case subjects before death were eligible to serve as
control subjects for other case subjects who died earlier (23 control
subjects went on to become case subjects at a later point in time).
CONT EXT S AN D CA VEA T S
Prior knowledge
Most previous studies have found a modest association between
the risk of lung cancer and exposure to diesel exhaust (DE). However,
these studies typically have inferred DE exposure from job title in the
absence of quantitative data on historical DE exposures.
Study design
A nested case–control study of lung cancer and DE in a cohort of
12 315 workers in eight non-metal mining facilities included 198
lung cancer deaths and 562 control subjects. The case–control
study evaluated the exposure–response relationship between DE
and lung cancer mortality after adjustment for cigarette smoking
and other potential confounding factors that were unavailable in
the cohort study.
Contribution
The results showed a strong and consistent relationship between
quantitative exposure to DE and increased risk of dying from lung
cancer. Among heavily exposed workers, the risk of dying from
lung cancer was approximately three times greater than that
among workers in the lowest quartile of exposure.
Implication
Exposure to DE may cause lung cancer in mine workers.
Limitations
Data on smoking and other potential confounders were derived
mainly from next-of-kin interviews. Retrospective assessment of
DE exposure may result in some misclassification, leading to
imprecision in exposure estimates.
From the Editors
55
60
65
70
75
80
85
90
95
100
105
110
115
120
125
130
135
140
145
150
155
160
jnci.oxfordjournals.org JNCI
|
Article 3
Control subjects were individually matched to each case subject on
mining facility, sex, race/ethnicity (ie, white, African American,
American Indian, Hispanic), and birth year (within 5 years). In the
analysis, estimates of diesel exposure and potential confounders
(eg, cigarette smoking, employment in other high-risk occupations
for lung cancer, and history of nonmalignant respiratory disease)
for each control subject were truncated at the date of death of the
matched case subject. We identified 650 eligible control subjects
and interviewed 611 (94.0%) of them or their next of kin (if the
control subject was deceased or too ill for interview). Of the next
of kin who were interviewed, 55% were adult children, 31% were
spouses or former spouses, 6% were siblings, and 8% were other
relatives (with the exception of two friends/co-workers).
The Interview
Living control subjects (n = 222) and next of kin of lung cancer
case subjects (n = 198) and ill or deceased control subjects (n = 340)
were interviewed using a computer-assisted telephone interview
(as explained below, an additional 15 case subjects and 49 control
subjects were excluded from analysis). The interview was designed
to collect information about the subject’s demographics, smoking
history (both active and passive), lifetime occupational history,
medical history, family medical history, and usual adult diet. We
obtained information on all jobs held for 12 months or longer
since the age of 16. For each job held at a study mining facility, we
collected information on the use of respiratory protective equip-
ment (eg, respirators and masks) and the mining facility location
where each subject spent most of his or her time (surface or under-
ground) to supplement information obtained from the subject’s
company employment record. We also collected information
about all jobs held before and after employment at the study mining
facilities, including whether the subjects operated or worked near
diesel engines.
We compared data obtained from next of kin of deceased con-
trol subjects to those obtained from direct interviews with living
control subjects for several key variables (eg, cigarette smoking,
history of employment in a high-risk occupation for lung cancer,
and history of nonmalignant respiratory disease). In general, data
obtained from next of kin were similar to those obtained from
directly interviewed control subjects. For cigarette smoking, the
percentages of direct vs next-of-kin interviews by smoking cate-
gory were as follows: never smoker, 27% vs 28%; occasional
smoker, 3% vs 2%; former smoker of less than one pack per day,
17% vs 17%; former smoker of one to less than two packs per day,
31% vs 24%; former smoker of two or more packs per day, 11%
vs 6%; current smoker of less than one pack per day, 1% vs
3%; current smoker of one to less than two packs per day, 9% vs
14%; and current smoker of two or more packs per day, 1% vs 6%,
respectively. Living control subjects and next of kin of dead
control subjects reported similar proportions of “ever smokers”
(73% and 72%, respectively). As expected, deceased control sub-
jects had a slightly higher proportion of current smokers of one or
more packs per day than living control subjects (20% and 10%,
respectively). This observation is consistent with the reported
cause of death; 80% of control subjects who were current smokers
of one or more packs per day died of a smoking-related cause
compared with 60% of control subjects who never smoked.
This study was approved by the Institutional Review Boards
of the National Cancer Institute, the National Institute for
Occupational Safety and Health (NIOSH), and Westat, Inc. All
interviewees provided verbal informed consent before the inter-
view, and next of kin of case subjects provided written consent to
obtain medical records and pathology materials.
Diesel Exhaust Exposure Assessment
The eight facilities in the study had both underground (ore extrac-
tion) and surface (ore processing) operations. Underground
workers were exposed to diesel exhaust primarily from ore extrac-
tion, haulage, and personnel transport vehicles. Surface workers
generally had little to no contact with diesel equipment, although
some had low levels of diesel exposure from the operation of heavy
equipment or diesel trucks or because they worked near diesel
equipment.
Respirable elemental carbon (REC), a component of diesel
exhaust, is considered the best index of diesel exhaust in under-
ground mining (13). The methods we used to develop quantitative
estimates of historical exposure to REC at each mining facility
have been described in detail (14–18). Briefly, the exposure asses-
sors (P. A. Stewart, R. Vermeulen, J. B. Coble) developed location-
and job title–specific estimates, by year, back to the year of the
introduction of diesel equipment in each facility, blinded to mortality
outcomes. The estimates were based on measurements from 1998
to 2001 DEMS industrial hygiene surveys at each working mining
facility, past Mine Safety and Health Administration enforcement
surveys, other measurement data, and information from company
records and interviews with long-term workers. The same REC
estimates were used to develop quantitative estimates of average
intensity and cumulative REC exposure for subjects in both this
and the cohort study (12).
A small percentage of subjects in the nested case–control study
worked at more than one study facility (ie, 5.9% worked at two
facilities and 0.7% worked at three). For these workers, their
exposure metrics were based on diesel exposure at all relevant
study facilities. Control subjects working in more than one facility
were matched to case subjects on the facility where the control
subject worked the longest. In facility-specific analyses, workers at
multiple facilities were assigned to the facility where they worked
the longest.
Statistical Analysis
The effect of diesel exhaust exposure on risk of dying of lung can-
cer was quantified by the odds ratio. Odds ratios and 95% confi-
dence intervals were estimated by conditional logistic regression.
Quartile and tertile cut points for exposure metrics were chosen to
achieve approximately equal numbers of case subjects in each cat-
egory. In all tables, statistical models included a term for exposure
(ie, quartiles of average REC intensity [µg/m
3
], cumulative REC
exposure [µg/m
3
-y], or duration of exposure [years]). Final models
also included terms for potential confounding factors. These
included a variable that combined cigarette smoking status and
smoking intensity with location worked because initial analyses
indicated that the risk of lung cancer from cigarette smoking
was different for surface and underground workers (ie, smoking
status [never, former, current], by smoking intensity [unknown or
165
170
175
180
185
190
195
200
205
210
215
220
225
230
235
240
245
250
255
260
265
270
4 Article
|
JNCI Vol. 104, Issue 11
|
June 6, 2012
occasional smoker, <1, 1 to <2, ≥2 packs per day], by location [sur-
face only, ever underground]). Former smoker was defined as a
case subject who had stopped smoking more than 2 years before
their date of death and a control subject who had stopped smoking
more than 2 years before the matched case subject’s date of death.
We included intensity smoked rather than duration smoked or
pack-years in our final models; however, results were similar when
either of these metrics was used to control for smoking (data not
shown). The addition of a variable representing the interaction of
location worked and smoking to models statistically significantly
improved analogous models that included smoking without loca-
tion (range of P values for the likelihood ratio test = .011–.064 for
average REC intensity and cumulative REC, unlagged and
lagged). The final models also included two other potential con-
founders: employment in a high-risk occupation for lung cancer
for at least 10 years (ie, miner outside the study mining facilities,
truck driver, welder, machinery mechanic, painter) and history of
nonmalignant respiratory disease diagnosed at least 5 years before
death/reference date (ie, primarily pneumoconiosis, emphysema,
chronic obstructive pulmonary disease, silicosis, tuberculosis but
excluding asthma, pneumonia, and bronchitis because the latter
three diseases were not associated with lung cancer in our study).
Other potential confounders [ie, duration of cigar smoking;
frequency of pipe smoking; environmental tobacco smoke; family
history of lung cancer in a first-degree relative; education; body
mass index based on usual adult weight and height; leisure time
physical activity; diet; estimated cumulative exposure to radon,
asbestos, silica, polycyclic aromatic hydrocarbons (PAHs) from
non-diesel sources, and respirable dust in the study facility based
on air measurement and other data (14)] were evaluated but not
included in the final models because they had little or no impact
on odds ratios (ie, inclusion of these factors in the final models
changed point estimates for diesel exposure by ≤10%). Exposure
levels to other possible confounding exposures in these facilities,
such as arsenic, nickel, and cadmium, were not estimated because
of very low levels and generally non-detectable measurement
results (14).
To test for trend, a Wald test was performed, treating the
median value for each level of the categorical exposure variable
among the control subjects as continuous in the model. To test for
interaction between two risk factors, we added a cross-product
term to the logistic model and conducted a likelihood ratio test
between the model with and without the cross-product term. All
statistical tests were two-sided.
We explored quantitative patterns in odds ratios for both contin-
uous average REC intensity and continuous cumulative REC expo-
sure, denoted by d, by fitting various standard models for occupational
epidemiological data, including a log-linear model, OR(d) = exp(b d);
a power model, OR(d) = d
b
; a linear model, OR(d) = 1 + b d; and a
linear-exponential model, OR(d) = 1 + b d exp(g d). All models
were adjusted for the same set of potential confounding factors as
described above. We fitted models over the full range of exposure
and, for comparative purposes, over a restricted range of lower
exposure levels. We compared deviances (a measure of model
fit) with the null model that omitted REC exposure, in which
larger changes in deviance denoted greater improvements in fit
(Supplementary Table 1, available online).
For average REC intensity and cumulative REC exposure, we
evaluated lag intervals by excluding exposure occurring 0, 3, . . . ,
25 years (by 2-year intervals) before the death/reference date and
compared changes in model deviance to a model that omitted REC
exposure. The optimal lag interval (ie, the largest improvement in
model fit) occurred for a lag between 13–17 years for average REC
intensity and 15 years for cumulative REC exposure (Supplementary
Figure 1, available online). For consistency, we used a 15-year lag
for both exposure metrics in the final analyses.
Of the 213 lung cancer case subjects and 611 control subjects
interviewed for study, subjects were excluded for the following
reasons: one case subject was identified as “unlikely” to have had
lung cancer based on review of pathology material; 10 case subjects
did not have any eligible control subjects (because of race/ethnicity
for nine nonwhite or Hispanic case subjects and age for one case
subject who was 88 years old); 39 control subjects were incorrectly
matched on race/ethnicity based on more accurate information
obtained during interview; four case subjects and five control sub-
jects were found ineligible for inclusion in the cohort based on a
final review of company work histories by NIOSH (12); and five
control subjects were not suitable matches to any case subject
because the original matched case subject was found to be ineli-
gible for study. The final analytic dataset included 198 case sub-
jects and 562 control subjects (666 control subjects for analytical
purposes because some cohort members served as control subjects
for more than one case subject). This analytical dataset was
predominantly male, with only two female case subjects and eight
female control subjects.
Results
Odds ratios for potential confounders (except cigarette smoking)
and lung cancer risk are shown in Table 1. A statistically significant
increased risk of lung cancer was observed for workers employed
at least 10 years in occupations at high-risk for lung cancer (OR =
1.75, 95% CI = 1.06 to 2.91) (Table 1) and those with a history of
nonmalignant respiratory disease for at least 5 years before death/
reference date (OR = 2.15, 95% CI = 1.21 to 3.82) (Table 1). The
elevated risk among those with nonmalignant respiratory disease
less than 5 years before death may have been reflective of the early
stages of lung cancer. Statistically nonsignificant increased risks
were observed for workers who had a family history of lung cancer,
smoked cigars for 10 or more years, lived with two or more
smokers, exercised less than once per day, and had a vocational
school education. Statistically nonsignificant decreased risks were
observed among workers who were overweight or obese and who
smoked at least 10 pipefuls of tobacco per week (Table 1).
Several non-diesel exposures present at very low levels (ie,
levels not typically associated with risk in epidemiological studies)
at the study mining facilities were not statistically significantly
related to lung cancer risk in our study (Table 1). Levels of
radon underground at the study mines were low (ie, arithmetic
mean ≤0.02 Working Levels). The odds ratio for workers in the
top quartile of cumulative radon exposure was 1.32 (95% CI = 0.76
to 2.29), and workers in quartiles 2 or 3 had little or no increased
risk (Table 1). No consistent trend in risk with increasing cumu-
lative radon exposure was apparent (P
trend
= .220). Little or no
275
280
285
290
295
300
305
310
315
320
325
330
335
340
345
350
355
360
365
370
375
380
jnci.oxfordjournals.org JNCI
|
Article 5
Table 1. Odds ratios (ORs) and 95% confidence intervals (CIs) by potential risk factors for lung cancer*
Potential risk factor Case subjects Control subjects OR (95% CI)
Employment in other high-risk occupations, †‡
No 100 365 1.0 (referent)
0 to <5y 24 90 0.90 (0.52 to 1.55)
5 to <10y 6 53 0.49 (0.19 to 1.21)
≥10y 39 68 1.75 (1.06 to 2.91)
Unknown 29 90 1.14 (0.67 to 1.92)
History of respiratory disease†§
No 86 473 1.0 (referent)
<5 y before death/reference date 26 16 5.97 (2.93 to 12.19)
≥5 y before death/reference date 28 58 2.15 (1.21 to 3.82)
Unknown 58 119 2.94 (1.87 to 4.63)
Family history of lung cancer†
No 136 532 1.0 (referent)
Yes 35 78 1.58 (0.97 to 2.57)
Unknown 27 56 1.65 (0.96 to 2.83)
Cigar smoking duration, y†
Nonsmoker of cigars 176 564 1.0 (referent)
<10 8 42 0.81 (0.36 to 1.86)
10 to <20 5 16 1.46 (0.49 to 4.39)
≥20 3 14 1.67 (0.42 to 6.73)
Unknown 6 30 0.64 (0.24 to 1.67)
Pipe smoking, no. of pipefuls per week)║
Nonsmoker of pipes 153 487 1.0 (referent)
<10 11 39 0.89 (0.41 to 1.95)
10 to <20 6 24 0.66 (0.25 to 1.77)
≥20 5 35 0.50 (0.18 to 1.38)
Unknown 23 81 0.90 (0.52 to 1.57)
Number of smokers living in participant’s childhood/adult home†
0 smokers 28 164 1.0 (referent)
1 smoker 75 201 1.99 (1.20 to 3.30)
≥2 smokers 70 230 1.43 (0.84 to 2.44)
Unknown 25 71 1.30 (0.67 to 2.52)
Body mass index (kg/m
2
)†
<18.5 (underweight) 0 6
18.5 to <25.0 (normal weight = referent) 105 285 1.0 (referent)
25.0 to <30.0 (overweight) 71 268 0.75 (0.51 to 1.11)
≥30.0 (obese) 14 59 0.73 (0.36 to 1.45)
Unknown 8 48 0.52 (0.23 to 1.19)
Physical activity†
Exercise ≥1/d 23 110 1.0 (referent)
Exercise <1/d 162 515 1.46 (0.87 to 2.45)
Unknown 13 41 1.65 (0.70 to 3.89)
Education†
Any college 22 88 1.0 (referent)
Vocational school 14 35 1.49 (0.63 to 3.52)
High school/GED 48 176 0.94 (0.51 to 1.72)
Less than high school 100 325 1.09 (0.61 to 1.98)
Unknown 14 42 1.40 (0.62 to 3.18)
Radon, quartiles (Working Level Months)¶#**
No exposure 74 254 1.0 (referent)
>0 to <0.6 31 117 0.73 (0.43 to 1.25)
0.6 to <1.9 31 123 0.86 (0.51 to 1.45)
1.9 to <3.0 31 80 1.08 (0.63 to 1.84)
≥3.0 31 92 1.32 (0.76 to 2.29)
Asbestos, quartiles†¶††
No exposure 122 402 1.0 (referent)
>0 to <1.1 19 40 1.12 (0.59 to 2.10)
1.1 to <5.9 19 92 0.73 (0.41 to 1.29)
5.9 to <13.7 19 73 0.81 (0.44 to 1.48)
≥13.7 19 59 1.08 (0.59 to 2.01)
(Table continues)
6 Article
|
JNCI Vol. 104, Issue 11
|
June 6, 2012
increased risk was observed for possible exposure to asbestos, silica,
and PAHs from non-diesel sources, which was consistent with
the low measured mean air levels of these potential confounding
variables (Table 1) (14). Workers in the top quartile of cumulative
respirable dust exposure had an elevated risk (OR = 1.31, 95%
CI = 0.70 to 2.46), but workers in quartiles 2 or 3 had no increased
risk (Table 1). Factors with statistically nonsignificant increased or
decreased risks had little or no confounding effect on estimates of
risk from diesel exposure (ie, changed point estimates by ≤10%)
and were not included in the final models.
Table 2 shows the effect of cigarette smoking overall and
cross-classified by location of employment (ie, surface only and
ever underground). Overall, for both surface-only and ever under-
ground workers combined, the risk of lung cancer was statistically
significantly associated with smoking status (never, former, cur-
rent smoker) and smoking intensity (former smoker of ≥2 packs
per day vs never smoker: OR = 5.40, 95% CI = 2.23 to 13.06;
current smoker of ≥2 packs per day vs never smoker: OR = 12.41,
95% CI = 5.57 to 27.66) (Table 2). We also observed an interac-
tion between cigarette smoking and location of employment, after
adjustment for cumulative REC, lagged 15 years (P
interaction
= .082).
The lung cancer risks associated with moderate (1 to <2 packs per
day) and heavy smoking (≥2 packs per day) were higher among
workers who only worked at the surface than among those who
ever worked underground for both current and former smokers.
For example, the odds ratio for current smokers of one to less than
two packs per day who worked only at the surface was 13.34 (95%
CI = 4.50 to 39.53) compared with an OR of 4.51 (95% CI = 1.50
to 13.58) for those who ever worked underground (Table 2).
Because the effect of smoking appeared to be diminished among
underground workers compared with that among surface workers,
we included the cross classification of location of employment,
smoking status, and smoking intensity in all models used to esti-
mate lung cancer risk by diesel exposure (Tables 1, 3, and 7;
Figure 1), unless noted otherwise. It is also noteworthy that
among never smokers, underground and surface-only workers had
similar risks after adjustment for 15-year lagged cumulative REC
(OR = 0.90; 95% CI = 0.26 to 3.09) (Table 2), suggesting that
the risk experienced by surface-only workers was mainly due to
smoking.
Potential risk factor Case subjects Control subjects OR (95% CI)
Silica, quartiles†¶††
No exposure 48 169 1.0 (referent)
>0 to <4.6 37 111 0.68 (0.25 to 1.90)
4.6 to <12.6 37 155 0.56 (0.19 to 1.61)
12.6 to <20.5 38 86 1.07 (0.37 to 3.14)
≥20.5 38 145 0.78 (0.26 to 2.32)
PAHs from non-diesel sources, quartiles†¶‡‡
No exposure 120 398 1.0 (referent)
>0 to <1.2 19 49 1.03 (0.55 to 1.91)
1.2 to <5.1 20 74 0.94 (0.53 to 1.68)
5.1 to <12.3 19 81 0.87 (0.48 to 1.57)
≥12.3 20 64 1.06 (0.59 to 1.92)
Cumulative respirable dust, quartiles, mg/m
3
-y*¶§§
0 to <5.66 49 142 1.0 (referent)
5.66 to <14.08 50 184 0.91 (0.52 to 1.57)
14.08 to <29.54 49 194 0.86 (0.49 to 1.52)
≥29.54 50 146 1.31 (0.70 to 2.46)
* P values based on two-sided Wald test for linear trend; PAH = polycyclic hydrocarbon; WL = Working Level; WLM = Working Level Months .
† Adjusted for smoking status/mine location combination (surface work only/never smoker, surface work only/unknown/occasional smoker, surface work only/
former smoker/<1 pack per day, surface work only/former smoker/1 to <2 packs per day, surface work only/former smoker/≥2 packs per day, surface work only/
current smoker/<1 packs per day, surface work only/current smoker/1 to <2 packs per day, surface work only/current smoker/≥2 packs per day, ever underground
work/never smoker, ever underground work/unknown/occasional smoker, ever underground work/former smoker/<1 pack per day, ever underground work/former
smoker/1 to <2 packs per day, ever underground work/former smoker/≥ 2 packs per day, ever underground work/current smoker/<1 pack per day, ever under-
ground work/current smoker/1 to <2 packs per day, ever underground work/current smoker/≥2 packs per day).
‡ Other high-risk occupations for lung cancer (ie, miner who worked outside the study mines, truck driver, welder, machinery mechanic, painter).
§ History of respiratory disease excluding asthma, pneumonia, and bronchitis.
║ Adjusted for cigarette smoking and education.
¶ Pertains only to exposures at study mines.
# Quartiles of cumulative radon exposure derived from estimated levels in WL multiplied by months at each job, summed across jobs. Thus, exposure to radon is
expressed in units of WLM. One WL = 130 000 MeV alpha energy per liter of air, and one WLM is equivalent to 1 WL exposure for 170 hours.
** Adjusted for smoking status: unknown, never smoker, occasional smoker, former smoker/<1 pack per day, former smoker/1 to <2 packs per day, former
smoker/≥2 packs per day, current smoker/<1 pack per day, current smoker/1 to <2 packs per day, current smoker/≥2 packs per day.
†† Quartiles of cumulative exposure derived from intensity scores (0–3) multiplied by years at each job, summed across jobs.
‡‡ Quartiles of cumulative exposure derived from the presence or absence of non-diesel PAHs based on job title tasks (0,1) multiplied by years at each job, summed
across jobs.
§§ Respirable dust in milligrams per cubic meter multiplied by years of exposure.
Table 1 (Continued).
385
390
395
400
405
410
415
420
jnci.oxfordjournals.org JNCI
|
Article 7
Trends in risk with increasing levels of diesel exposure are
either statistically significant or of borderline significance (P
trend
≤ .08)
for all metrics (both unlagged and lagged) (Table 3). The strongest
gradient in risk was seen for 15-year lagged cumulative REC
(P
trend
= .001). The odds ratio for workers in the top quartile of
15-year lagged cumulative REC exposure (ie, ≥536 µg/m
3
-y) was
2.83 (95% CI = 1.28 to 6.26) compared with workers in the lowest
quartile. When the top exposure quartile was split at the median
(ie, 1005 µg/m
3
-y), the risk continued to rise (P
trend
over all five
exposure levels = .002); odds ratios were 2.53 (95% CI = 1.06 to
6.04) and 3.20 (95% CI = 1.33 to 7.69) for workers in the top
quartile with cumulative REC exposures below and above the
median of the quartile, respectively.
We observed a statistically significant gradient in risk with
increasing number of years exposed to diesel exhaust among all
workers (P
trend
= .043), although an elevated odds ratio occurred
only in the highest duration category. The odds ratio for workers
exposed to diesel exhaust for 15 or more years was 2.09 (95% CI =
0.89 to 4.90) compared with surface workers with negligible or
bystander exposure (Table 3).
We also examined risk among all subjects who ever worked
underground (Table 4) and among those who worked only at
the surface (Table 5). Among underground workers, we observed
statistically significant trends in risk with increasing average REC
intensity, unlagged (P
trend
= .01) and lagged 15 years (P
trend
= .001),
and with increasing cumulative REC, lagged 15 years (P
trend
= .004)
(Table 4). Among surface workers, in contrast, no consistent posi-
tive gradient in risk with increasing diesel exposure was apparent
(Table 5), probably due to the small number of subjects (53 case
subjects and 100 control subjects) and the low levels of diesel expo-
sure experienced by surface workers. Because of the increased
precision gained by estimating odds ratios based on all subjects, our
primary estimates of risk are based on surface and underground
workers combined (Table 3).
We stratified the combined results (Table 3) on whether the
subject had self-reported diesel exhaust exposure from a job out-
side the study mining facility (eg, ever employed as a long-haul
truck driver) (data not shown). No systematic differences in risk
were apparent among subjects with or without occupational diesel
exposure outside the study facility (P
interaction
between cumulative
REC, lagged 15 years, and outside occupational diesel exhaust
exposure = .222).
Use of protective equipment did not appear to modify the
observed associations between diesel exhaust exposure and lung
cancer. However, most information on protective equipment use
was obtained from next-of-kin interviews, resulting in a large
number of workers with unknown data (59 case subjects and 129
control subjects). Subjects who reported having used protective
equipment appeared to experience risks similar to the estimates
for all workers combined (Table 3). For example, among workers
who used protective equipment, odds ratios for 15-year lagged
cumulative REC exposures of less than 3 µg/m
3
-y, 3 to less than
72 µg/m
3
-y, 72 to less than 536 µg/m
3
-y, and 536 µg/m
3
-y or
more were 1.0 (referent), 0.31 (95% CI = 0.04 to 2.23; 16 case
subjects and 42 control subjects), 1.76 (95% CI = 0.11 to 27.91; 10
case subjects and 23 control subjects), and 3.66 (95% CI = 0.26 to
52.09; 20 case subjects and 31 control subjects), respectively.
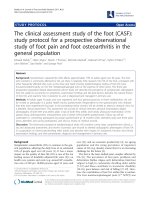
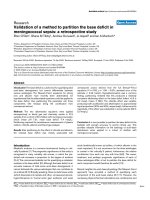
Figure 1 shows category-specific odd ratios (square symbol),
with confidence intervals omitted for clarity, and fitted odds ratios
for 15-year lagged average REC intensity and cumulative REC
using various continuous models. To provide additional points for
graphing the exposure–response curve based on categorical data
(Figure 1), we expanded the number of cut points (cut points for
average REC intensity, lagged 15 years: <2, 2 to <4, 4 to <8, 8 to
<16, 16 to <32, 32 to <64, 64 to <128, 128 to <256, and ≥256 µg/m
3
;
cut points for cumulative REC, lagged 15 years, were similarly
defined but multiplied by a factor of 10 to account for duration of
exposure: <20, 20 to <40, 40 to <80, 80 to <160, 160 to <320, 320
Table 2. Odds ratios (ORs) and 95% confidence intervals (CIs) for smoking status/smoking intensity by location of employment*
Smoking status/smoking
intensity (packs per day)
OR (95% CI), No. of case subjects/No. of control subjects
Surface only†,
average REC intensity
(0–8 µg/m
3
REC)
Ever underground†,
average REC intensity
(1–423 µg/m
3
REC) All subjects‡
Never smoker 1.0 (referent), 5/87 0.90 (0.26 to 3.09), 9/91 1.0 (referent), 14/178
Former, <1 1.36 (0.24 to 7.59), 2/31 2.51(0.78 to 8.11), 17/62 2.87 (1.30 to 6.33), 19/93
Former, 1 to <2 6.66 (2.07 to 21.50), 14/40 1.97 (0.61 to 6.37), 16/68 3.56 (1.72 to 7.40), 30/108
Former, ≥2 16.30 (3.55 to 74.82), 6/7 2.70 (0.72 to 10.12), 9/29 5.40 (2.23 to 13.06), 15/36
Current, <1 5.22 (1.16 to 23.39), 4/15 5.71 (1.63 to 20.01), 12/21 5.91 (2.47 to 14.10), 16/36
Current, 1 to <2 13.34 (4.50 to 39.53), 26/41 4.51 (1.50 to 13.58), 32/78 7.36 (3.71 to 14.57), 58/119
Current, ≥2 26.60 (7.14 to 99.08), 12/9 7.13 (2.12 to 23.99), 17/27 12.41 (5.57 to 27.66), 29/36
Unknown§ 2.86 (0.71 to 11.64), 5/24 2.65 (0.76 to 9.24), 12/36 3.10 (1.33 to 7.26), 17/60
* REC = respirable elemental carbon.
† ORs relative to never smokers who worked only surface jobs, adjusted for cumulative REC, lagged 15 years (quartiles: 0 to <3 µg/m
3
-y; 3 to <72 µg/m
3
-y, 72 to
<536 µg/m
3
-y, ≥536 µg/m
3
-y), history of respiratory disease 5 or more years before date of death/reference date, and history of a high-risk job for lung cancer for
at least 10 years. P value for interaction between smoking status and location of employment based on likelihood ratio test = .082.
‡ ORs for intensity smoked relative to never smokers, adjusted for cumulative REC, lagged 15 years (quartiles: 0 to <3 µg/m
3
-y; 3 to <72 µg/m
3
-y, 72 to <536 µg/
m
3
-y, ≥536 µg/m
3
-y), location of employment (surface only, ever underground), history of respiratory disease 5 or more years before date of death/reference date,
and history of a high-risk job for lung cancer for at least 10 years.
§ Unknown includes subjects with unknown smoking status, and subjects considered occasional smokers, who smoked at least 100 cigarettes during their life-
times, but never smoked regularly (≥1 cigarette per day for at least 6 months).
425
430
435
440
445
450
455
460
465
470
475
480
485
490
8 Article
|
JNCI Vol. 104, Issue 11
|
June 6, 2012
to <640, 640 to <1280, 1280 to <2560, and ≥2560 µg/m
3
-y;
Supplementary Table 2, available online). Odds ratios increased
with 15-year lagged average REC intensity and leveled off above
20–80 µg/m
3
(Figure 1, A for the full range and Figure l, B for
average REC intensity under 128 µg/m
3
). For the full range, the
odds ratio pattern was best explained by a one-parameter power
model (deviance = 5.3, P = .022), whereas for the restricted range,
the power and linear models were comparable (deviance = 2.8,
P = .092 and deviance = 3.2, P = .075, respectively). A similar
increasing pattern of odds ratios was observed for cumulative REC
exposure, lagged 15 years (Figure 1, C for the full range and Figure
l, D for cumulative REC under 1280 µg/m
3
-y), with a leveling off
of risk for exposures above 1,000 µg/m
3
-y and perhaps a decline in
risk among the most heavily exposed workers. The two-parameter
linear-exponential model (dotted line) was the best fitting model
for the full range (relative to the null model, deviance = 12.2,
P = .002) (Figure l, C); for the restricted range, the best models
were the one-parameter linear model (dashed-dotted line)
(deviance = 15.6, P < .001) and the two-parameter linear-exponential
model (dotted line) (deviance = 16.0, P < .001) (Figure 1, D)
(Supplementary Table 1, available online). We carried out similar
model comparisons using the unlagged exposure metrics
(Supplementary Table 3, available online). However, our evalua-
tion of optimal lag intervals (Supplementary Figure 1, available
online) suggested that the unlagged approach led to exposure mis-
classification because recent exposures may not have had sufficient
time to contribute to lung cancer risk and thus resulted in gener-
ally poorer fit of the various models.
The combined effect of diesel exposure and intensity of ciga-
rette smoking is shown in Table 6. Among the 14 case subjects and
178 control subjects who never smoked, odds ratios by tertile of
cumulative REC, lagged 15 years, were: 1.0 (referent), OR = 1.47
(95% CI = 0.29 to 7.50), and OR = 7.30 (95% CI = 1.46 to 36.57).
Risk also increased with increasing level of diesel exposure among
smokers of less than one and one to less than two packs per day. In
contrast, risk decreased with increasing levels of diesel exposure
among smokers of at least two packs per day. Similarly, risk asso-
ciated with smoking intensity was modified by diesel exposure.
Among workers in the lowest tertile of cumulative REC, lagged 15
years, smokers of at least two packs per day had a risk 27 times that
of nonsmokers, whereas among those in the highest tertile of
cumulative REC, heavy smokers had about 2.5-fold the risk of
nonsmokers. The P
interaction
between level of diesel exposure and
cigarette smoking was .086.
Table 3. Odds ratios (ORs) and 95% confidence intervals (CIs) for average and cumulative REC and total duration REC exposure*
Exposure metric Case subjects Control subjects OR (95% CI) P
trend
Average REC intensity, quartiles, unlagged, µg/m
3
.025
0 to <1 49† 166 1.0 (referent)
1 to <32 50 207 1.03 (0.50 to 2.09)
32 to <98 49 145 1.88 (0.76 to 4.66)
≥98 50 148 2.40 (0.89 to 6.47)
Quartiles, lagged 15 y, µg/m
3
.062
0 to <1 47† 190 1.0 (referent)
1 to <6 52 187 1.11 (0.59 to 2.07)
6 to <57 49 141 1.90 (0.90 to 3.99)
≥57 50 148 2.28 (1.07 to 4.87)
Cumulative REC, quartiles, unlagged, µg/m
3
-y
.083
0 to <19 49 151 1.0 (referent)
19 to <246 50 214 0.87 (0.48 to 1.59)
246 to <964 49 147 1.50 (0.67 to 3.36)
≥964 50 154 1.75 (0.77 to 3.97)
Quartiles, lagged 15 y, µg/m
3
-y
.001
0 to <3 49 158 1.0 (referent)
3 to <72 50 228 0.74 (0.40 to 1.38)
72 to <536 49 157 1.54 (0.74 to 3.20)
≥536 50 123 2.83 (1.28 to 6.26)
Duration of REC exposure, y
.043
Unexposed‡
48 165 1.0 (referent)
0 to <5 51 169 1.16 (0.53 to 2.55)
5 to <10 20 95 0.88 (0.38 to 2.03)
10 to <15 31 107 0.93 (0.39 to 2.21)
≥15 48 130 2.09 (0.89 to 4.90)
* P values based on two-sided Wald test for linear trend; adjusted for smoking status/mine location combination (surface work only/never smoker, surface work
only/unknown/occasional smoker, surface work only/former smoker/<1 pack per day, surface work only/former smoker/1 to <2 packs per day, surface work only/
former smoker/≥2 packs per day, surface work only /current smoker/<1 pack per day, surface work only/current smoker/1 to <2 packs per day, surface work only/
current smoker/≥2 packs per day, ever underground work/never smoker, ever underground work/unknown/occasional smoker, ever underground work/former
smoker/<1 pack per day, ever underground work/former smoker/1 to <2 packs per day, ever underground work/former smoker/≥2 packs per day, ever under-
ground work/current smoker/<1 pack per day, ever underground work/current smoker/1 to <2 packs per day, ever underground work/current smoker/≥2 packs
per day); history of respiratory disease 5 or more years before date of death/reference date; and history of a high-risk job for lung cancer for at least 10 years.
REC = respirable elemental carbon.
† The number of case subjects in the referent group for the 15-year lagged average REC analysis is 2 fewer than that in the unlagged analysis because rounded cut
points are presented. The unrounded cut points are <0.86 and <1.37 µg/m
3
, respectively.
‡ Unexposed includes all subjects who worked surface jobs with either negligible or bystander exposure to REC, regardless of duration.
495
500
505
510
515
520
525
530
535
jnci.oxfordjournals.org JNCI
|
Article 9
We evaluated lung cancer risk by quantitative level of diesel
exposure for each type of mining facility (Table 7). Too few
workers were employed in the one salt and the one limestone
mining facility to estimate risk for these types separately. For
workers in both potash and trona mining facilities, risk tended to
increase with increasing levels of average REC intensity and cumu-
lative REC exposure. Trends were more consistent among potash
miners, perhaps reflecting more stability in odds ratios resulting
from twice as many case subjects in the potash as in the trona
facilities (Table 7).
Discussion
This case–control study nested within a cohort of miners showed
a strong and consistent relation between quantitative exposure to
diesel exhaust and increased risk of dying of lung cancer. To our
knowledge, this is the first report of a statistically significant
exposure–response relationship for diesel exposure and lung
cancer based on quantitative estimates of historical diesel exposure
with adjustment for smoking and other potential confounders. We
observed increasing trends in risk with increasing exposure to die-
sel exhaust for both average REC intensity and cumulative REC
exposure, unlagged and lagged 15 years, with the strongest gra-
dient in risk with cumulative REC, lagged 15 years. We further
observed a gradient of increasing risk within the top quartile of
15-year lagged cumulative REC exposure for workers below and
above the median of the quartile. The associations between diesel
exposure and lung cancer were apparent for workers employed in
either the potash or trona facilities (too few workers were
employed in the one salt and one limestone mine to estimate risk
separately). The consistency of findings for both potash and trona
facilities is noteworthy because smoking was prohibited in the
trona facilities but not in potash or the other facilities in the study.
Reports by next of kin or study subjects of workers’ use of protec-
tive equipment within the study mining facilities and workers’
additional occupational exposure to diesel exhaust outside the
study facilities had little or no impact on our findings.
These positive findings are consistent with those of the cohort
analysis of underground workers in the same study population
(12). However, estimates of risk for underground workers in the
case–control analysis were somewhat higher than those based on
the cohort analysis. For example, the odds ratios by quartile of the
15-year lagged cumulative REC exposure in the case–control
analysis were 1.0, 2.11, 3.48, and 5.90 (for cohort cut points, <108,
108 to <445, 445 to <946, and ≥946 µg/m
3
-y, respectively), com-
pared with hazard ratios of 1.0, 1.50, 2.17, and 2.21 from the
cohort analysis (12). The lower point estimates from the cohort
analysis may be partly due to negative confounding from cigarette
smoking because current smoking was inversely related to diesel
exposure in underground workers (36% and 21% current smokers
in lowest vs highest cumulative REC tertile, respectively). Odds
ratios for underground workers in the case–control analysis using
the same cohort cut points dropped to 1.0, 1.94, 2.42, and 3.75,
respectively, when smoking was removed from the model.
The continuous models suggest a steep slope at the low end of
the exposure–response curve followed by a leveling, or perhaps
even a decline, in risk among the most heavily exposed workers.
A plateauing of exposure–response curves has been reported in
studies of other occupational exposures and cancer risk (19).
Possible biological explanations for a plateauing effect include
saturation of metabolic activation and enhanced detoxification or
greater DNA repair efficiency at higher exposure levels.
Figure 1. Odds ratios (ORs) (solid squares) for
lung cancer by expanded categories of
average respirable elemental carbon (REC)
intensity and cumulative REC (Supplementary
Table 2, available online). A) Average REC
intensity, full range; B) Average REC intensity,
less than 128 µg/m
3
; C) Cumulative REC expo-
sure, full range; D) Cumulative REC exposure,
less than 1280 µg/m
3
-y. ORs located at the
mean exposure within category. Models for
OR by continuous exposure (d) include a
power model, OR(d) = d
b
(solid line); a linear
model, OR(d) = 1 + b d (dashed line for the full
range and dashed-dotted line for the restricted
range); and a linear-exponential model, OR(d) =
1 + b d exp(g d) (dotted line). Exposure vari-
ables were based on a 15-year lag. Confidence
intervals were omitted for clarity. The log-linear
model was excluded because it did not fit the
data well.
0 1000 2000 3000 4000 5000
0
1
2
3
4
5
A
0 80 160 240 320
0
1
2
3
4
5
OR
C
B
0 200 400 600 800 1000
-1
0
1
2
3
4
5
6
Cumulative REC, µg/m
3
-yr
0 40 80 120
0
1
2
3
4
5
OR
D
Average REC intensity, µg/m
3
Power
Linear (full range)
Linear-exponential
Linear (restricted)
540
545
550
555
560
565
570
575
580
585
590
595
10 Article
|
JNCI Vol. 104, Issue 11
|
June 6, 2012
Alternatively, nondifferential misclassification of diesel exposure
may be greater at higher exposures, obscuring further increases
in risk.
We observed an increased lung cancer risk associated with
diesel exposure as was seen among German potash miners (11), as
well as among other diesel-exposed occupational groups including
truck drivers (6,7), railroad workers (8,20), dockworkers (9), and
bus garage workers (10). The German potash miners study (11)
found elevated risk with increasing estimated cumulative total
carbon exposure (another surrogate for diesel exposure), although
the trend was not statistically significant. Relative risks were 1.0,
1.13, 2.47, 1.50, and 2.28 for exposure quintiles (ie, <1.29, 2.04,
2.73, 3.90, >3.90 mg/m
3
-y, respectively) (11). Some differences
between the German study (11) and this study are that this study
is considerably larger (US miners: 198 lung cancer deaths out of a
total of 278 041 person-years; German miners: 61 lung cancer
deaths out of 152 557 person-years), and the US miners had a
longer latent period for the development of lung cancer than the
German miners because diesel technology was introduced earlier
in the US study mines (1947–1967) than in the German mines
(1969). Finally, in this study, an intensive effort was undertaken to
characterize diesel exposure levels over time by incorporating
changes in size of the diesel equipment, numbers of equipment,
and air flow rates exhausted from the mines based on information
collected from the facilities. Our information indicated that these
factors varied considerably over time (14). In the German study,
the investigators relied on reports from local engineers and indus-
trial hygienists that working conditions were constant over past
years. However, in contrast to this study, no past industrial
hygiene measurements were available to confirm this assumption.
We observed an attenuation of the effect of cigarette smoking
among study subjects who were exposed to high levels of diesel
exhaust as estimated by REC (Table 6). This finding mirrors a
recent observation from a study in Xuanwei, China (21), where
lung cancer rates are high because of unvented indoor burning of
coal for heating and cooking in homes (22). The effect of tobacco
on lung cancer risk in that study was weak in the presence of heavy
indoor exposures from smoky coal but became stronger with
installation of venting, which greatly diminished smoky coal air
concentrations (21,22). Little is known about the effect of the
interaction between cigarette smoking and diesel exhaust exposure
on lung cancer risk. If our observation of attenuation of the
smoking effect in the presence of high levels of diesel exhaust is
confirmed, several possible mechanistic explanations are apparent.
First, at high levels of diesel exhaust exposure, PAHs, nitro-PAHs,
and related compounds could compete with the metabolic activa-
tion of PAHs in tobacco smoke, leading to enzyme saturation. For
example, PAHs in complex mixtures have been shown to have less
than additive genotoxic effects at higher exposure levels (23).
Second, constituents of diesel exhaust may suppress enzymes that
Table 4. Odds ratios (ORs) and 95% confidence intervals (CIs) for average and cumulative REC and total duration REC exposure for
subjects who ever worked underground jobs*
Exposure metric Case subjects† Control subjects† OR (95% CI) P
trend
Average REC intensity, quartiles, unlagged, µg/m
3
0 to <39 29 89 1.0 (referent) .010
39 to <71 29 57 1.91 (0.91 to 4.01)
71 to <147 29 66 2.38 (1.04 to 5.44)
≥147 29 52 3.69 (1.40 to 9.70)
Quartiles, lagged 15 y, µg/m
3
0 to <8 29 81 1.0 (referent) .001
8 to <49 29 73 1.04 (0.45 to 2.43)
49 to <104 29 58 2.19 (0.87 to 5.53)
≥104 29 52 5.43 (1.92 to 15.31)
Cumulative REC, quartiles, unlagged, µg/m
3
-y
0 to <298 29 81 1.0 (referent) .123
298 to <675 29 63 1.45 (0.68 to 3.11)
675 to <1465 29 57 1.81 (0.84 to 3.89)
≥1465 29 63 1.93 (0.90 to 4.15)
Quartiles, lagged 15 y, µg/m
3
-y
0 to <81 29 92 1.0 (referent) .004
81 to <325 29 52 2.46 (1.01 to 6.01)
325 to <878 29 69 2.41 (1.00 to 5.82)
≥878 29 51 5.10 (1.88 to 13.87)
Duration of REC exposure, y
<5 37 92 1.0 (referent) .062
5 to <10 14 39 1.18 (0.52 to 2.68)
10 to <15 25 60 0.84 (0.39 to 1.82)
≥15 40 73 2.08 (1.01 to 4.27)
* P values based on two-sided Wald test for linear trend. Adjusted for smoking status (never smoker, unknown/occasional smoker, former smoker/<1 pack per day,
former smoker/1 to <2 packs per day, former smoker/≥2 packs per day, current smoker/<1 pack per day, current smoker/1 to <2 packs per day, current smoker/
≥2 packs per day); history of respiratory disease 5 or more years before date of death/reference date; and history of a high-risk job for lung cancer for at least 10
years. REC = respirable elemental carbon.
† Eight case subjects and 148 control subjects were excluded because they no longer belonged to a complete matched set after analysis was restricted to
underground workers.
600
605
610
615
620
625
630
635
640
645
jnci.oxfordjournals.org JNCI
|
Article 11
activate or induce enzymes that detoxify carcinogens in tobacco
smoke. For example, diesel exhaust particles have been shown to
reduce activity of CYP2B1, which plays a role in the activation of
certain tobacco-specific nitrosamines (24). Also, diesel particulate
matter has been shown to reduce the initiation of skin tumors in
Sencar mice treated with the potent PAH dibenzo[a,l]pyrene, pos-
sibly through inhibition of enzymes that carry out its metabolic
activation (25).
We also observed a weakening of the diesel exhaust effect among
heavy smokers (ie, smokers of at least two packs per day), which is
necessarily implied by the observation of a weakening of the effect
of smoking at least two packs per day among workers heavily
exposed to diesel exhaust. It has previously been reported that coal
dust burden in the lungs of coal miners is reduced among smokers,
which may be attributable to increased coal dust clearance (26), and
it is possible that diesel exhaust particulate deposition may be
reduced in the lungs of smokers by a similar process. Although little
experimental evidence is available to date to support and explain
effect modification of diesel exposure by smoking, it is theoretically
possible by one or more of the mechanisms described above.
Table 5. Odds ratios (ORs) and 95% confidence intervals (CIs) for average and cumulative REC and total duration REC exposure for
subjects who worked only surface jobs*
Exposure metric Case subjects† Control subjects† OR (95% CI) P
trend
Average REC intensity, quartiles, unlagged, µg/m
3
0 to <0.86 13 24 1.0 (referent) .983
0.86 to <0.95 13 21 1.29 (0.18 to 9.33)
0.95 to <1.9 13 19 7.24 (0.23 to 228.53)
≥1.9 14 36 3.28 (0.09 to 123.50)
Quartiles, lagged 15 y, µg/m
3
0 to <0.6 13 38 1.0 (referent) .659
0.6 to <0.9 13 17 4.38 (0.56 to 34.24)
0.9 to <1.4 13 12 5.67 (0.77 to 42.06)
≥1.4 14 33 1.31 (0.14 to 12.01)
Cumulative REC, quartiles, unlagged, µg/m
3
-y
0 to <6.5 13 17 1.0 (referent) .294
6.5 to <12.5 13 27 0.78 (0.18 to 3.43)
12.5 to <22.5 13 23 0.60 (0.14 to 2.53)
≥22.5 14 33 0.40 (0.07 to 2.40)
Quartiles, lagged 15 y, µg/m
3
-y
0 to <0.7 13 29 1.0 (referent) .117
0.7 to <4.4 13 9 3.98 (0.69 to 23.02)
4.4 to <14.3 13 32 0.76 (0.12 to 4.98)
≥14.3 14 30 0.42 (0.05 to 3.59)
Duration REC exposure, y
Unexposed‡ 34 61 1.0 (referent) .152
0 to <5 10 17 1.44 (0.26 to 8.17)
5 to <10 5 12 0.74 (0.10 to 5.21)
10 to <15 3 3 0.55 (0.05 to 6.17)
≥15 1 7 0.22 (0.01 to 3.67)
* P values based on two-sided Wald test for linear trend. Adjusted for smoking status (never smoker, unknown/occasional smoker, former smoker/<1 pack
per day, former smoker/1 to <2 packs per day, former smoker/≥2 packs per day, current smoker/<1 pack per day, current smoker/1 to <2 packs per day, current
smoker/≥2 packs per day); history of respiratory disease 5 or more years before date of death/reference date; and history of a high-risk job for lung cancer for at
least 10 years. REC = respirable elemental carbon.
† Twenty-one case subjects and 154 control subjects were excluded because they no longer belonged to a complete matched set after analysis was restricted to
surface workers.
‡ Unexposed includes subjects who worked surface jobs with either negligible or bystander exposure to REC.
Table 6. Odds ratios (ORs) and 95% confidence intervals (CIs) for cumulative REC lagged 15 years crossed with smoking intensity*
Smoking intensity
(packs per day)
Cumulative REC lagged 15 years
OR (95% CI), No. of case subjects/No. of control subjects
Tertile 1, 0 to < 8 µg/m
3
-y Tertile 2, 8 to < 304 µg/m
3
-y Tertile 3, ≥304 µg/m
3
-y
Never smoker 1.0 (referent), 3/59 1.47 (0.29 to 7.50), 4/74 7.30 (1.46 to 36.57), 7/45
<1 6.25 (1.42 to 27.60), 10/41 7.42 (1.62 to 34.00), 10/49 16.35 (3.45 to 77.63), 15/39
1 to <2 10.16 (2.55 to 40.53), 29/78 11.58 (2.87 to 46.71), 32/86 20.42 (4.52 to 92.36), 27/63
≥2 26.79 (6.15 to 116.63), 19/22 22.17 (4.84 to 101.65), 15/22 17.38 (3.48 to 86.73), 10/28
Unknown† 4.13 (0.74 to 23.22), 4/25 3.79 (0.64 to 22.41), 4/23 27.85 (5.03 to 154.31), 9/12
* Adjusted for history of respiratory disease 5 or more years before date of death/reference date, history of a high-risk job for lung cancer for at least 10 years, and
mine location (surface-only vs any underground work). P value for interaction between smoking intensity and cumulative REC lagged 15 years = .086. REC =
respirable elemental carbon.
† Unknown includes subjects with unknown smoking status, and subjects considered occasional smokers, who smoked at least 100 cigarettes during their life-
times, but never smoked regularly (≥1 cigarette per day for at least 6 months).
650
655
660
665
12 Article
|
JNCI Vol. 104, Issue 11
|
June 6, 2012
If the observed interaction between smoking and diesel exhaust
represents a real effect, then the generalizability of our estimates
of risk for diesel exposure to other populations depends not only
on the level of exposure to diesel exhaust but also on the
distribution of smoking status and intensity in the population. For
example, estimates of lung cancer risk in a population of never
smokers with diesel exposures similar to those of the miners in this
study would be 1.0, 1.47, and 7.30 for individuals with cumula-
tive REC, lagged 15 years, of less than 8 µg/m
3
-y, 8 to less than
304 µg/m
3
-y, and 304 µg/m
3
-y or more, respectively. In contrast,
the overall study population, which included 29% never smokers,
had lower odds ratios of 1.0, 1.12, and 2.40 for the same tertiles of
cumulative REC exposure, lagged 15 years, respectively (data not
shown). In fact, the proportion of never smokers in this study
population is substantially lower than the 51% reported for the US
population of men aged 18 years or older (27), suggesting that
diesel-related estimates of lung cancer risk in the US population
may be higher than the overall risk estimates reported here
because the proportion of never smokers in the US population is
higher than in this study cohort.
Our study has several major strengths including its relatively
large size, which provided adequate statistical power to detect a
statistically significant exposure–response relationship, adequate
latent period for the development of lung cancer, detailed exposure
assessment that enabled us to evaluate risk based on quantitative
historical exposure to REC, subjects with a wide range of diesel
exposure and with underground workers experiencing exposure
levels considerably higher than that of other occupationally
exposed groups in previous studies, a high interview participation
rate for both case subjects and control subjects, and the ability to
control for confounding from smoking and other lung cancer risk
factors. Two main limitations are also apparent. First, the data on
smoking and other potential confounders were derived mainly
from next-of-kin interviews. Although a comparison of confounder
data derived directly from living and from next of kin for deceased
control subjects revealed comparability of responses, we cannot
completely rule out the possibility of residual confounding.
Second, as in most epidemiological studies of cancer that rely on
retrospective exposure assessment, estimates of diesel exposure in
this study undoubtedly had some imprecision despite considerable
effort to minimize misclassification. This imprecision is likely to
result in nondifferential misclassification of exposure, which would
tend to bias the estimates of risk toward the null (28). Thus, the
true estimates of lung cancer risk associated with diesel exhaust
may, in fact, be higher than those reported here.
In sum, our results provide further evidence supporting a causal
effect of diesel exhaust exposure on lung cancer mortality in
humans. We observed a statistically significant exposure–response
relationship after we adjusted for possible confounding from
smoking and other established and hypothesized lung cancer risk
factors. The exposure–response curve showed a steep increase in
risk with increasing exposure at low-to-moderate levels followed
by a plateauing or perhaps a decline in risk among heavily exposed
subjects.
Table 7. Odds ratios (ORs) and 95% confidence intervals (CIs) for average and cumulative REC lagged 15 years, by mining facility type*
Exposure by mine type Case subjects Control subjects OR (95% CI) P
trend
Potash
Average REC intensity, lagged 15 years, quartiles, µg/m
3
0 to <1 25 95 1.0 (referent) .058
1 to <6 20 51 1.16 (0.49 to 2.76)
6 to <57 30 105 2.05 (0.70 to 6.01)
≥57 27 85 3.01 (0.98-9.25)
Cumulative REC, lagged 15 years, quartiles, µg/m
3
-y
0 to <3 19 60 1.0 (referent) .006
3 to <72 30 103 1.64 (0.67 to 3.98)
72 to <536 25 105 2.50 (0.86 to 7.24)
≥536 28 68 5.53 (1.68 to 18.21)
Trona
Average REC intensity, lagged 15 years, quartiles, µg/m
3
0 to <1 17 70 1.0 (referent) .105
1 to <6 18 64 2.32 (0.52 to 10.40)
6 to <57 2 6 1.71 (0.12 to 23.66)
≥57 14 34 5.95 (0.92 to 38.37)
Cumulative REC, lagged 15 years, quartiles, µg/m
3
-y
0 to <3 24 72 1.0 (referent) .062
3 to <72 11 64 0.23 (0.06 to 0.91)
72 to <536 7 17 0.95 (0.16 to 5.72)
≥536 9 21 2.38 (0.44 to 13.00)
* P values based on two-sided Wald test for linear trend. Adjusted for smoking status/mine location combination (surface work only/never smoker, surface work
only/unknown/occasional smoker, surface work only/former smoker/<1 pack per day, surface work only/former smoker/1 to <2 packs per day, surface work only/
former smoker/≥2 packs per day, surface work only/current smoker/<1 pack per day, surface work only/current smoker/1 to <2 packs per day, surface work only/
current smoker/≥2 packs per day, ever underground work/never smoker, ever underground work/unknown/occasional smoker, ever underground work/former
smoker/<1 pack per day, ever underground work/former smoker/1 to <2 packs per day, ever underground work/former smoker/≥2 packs per day, ever under-
ground work/current smoker/<1 pack per day, ever underground work/current smoker/1 to <2 packs per day, ever underground work/current smoker/≥2 packs
per day); history of respiratory disease 5 or more years before date of death/reference date; and history of a high-risk job for lung cancer for at least 10 years.
REC = respirable elemental carbon.
670
675
680
685
690
695
700
705
710
715
720
jnci.oxfordjournals.org JNCI
|
Article 13
Our findings are important not only for miners but also for the
1.4 million American workers and the 3 million European workers
exposed to diesel exhaust (29), and for urban populations world-
wide. Some of the higher average elemental carbon levels reported
in cities include Los Angeles (4.0 µg/m
3
) (30), the Bronx (a borough
in New York City) (6.6 µg/m
3
) (31), nine urban sites in China
(8.3 µg/m
3
) (32), Mexico City (5.8 µg/m
3
) (33), and Estarreja,
Portugal (11.8 µg/m
3
) (34). Environmental exposure to average ele-
mental carbon levels in the 2-6 µg/m
3
range over a lifetime as would
be experienced in highly polluted cities approximates cumulative
exposures experienced by underground miners with low exposures
in our study. Because such workers had at least a 50% increased
lung cancer risk, our results suggest that the high air concentrations
of elemental carbon reported in some urban areas may confer
increased risk of lung cancer. Thus, if the diesel exhaust/lung cancer
relation is causal, the public health burden of the carcinogenicity of
inhaled diesel exhaust in workers and in populations of urban areas
with high levels of diesel exposure may be substantial.
References
1. IARC monographs on the evaluation of carcinogenic risks to humans.
Diesel and gasoline engine exhausts and some nitroarenes. International
Agency for Research on Cancer. IARC Monogr Eval Carcinog Risks Hum.
1989;46:1–458.
2. Bhatia R, Lopipero P, Smith AH. Diesel exhaust exposure and lung
cancer. Epidemiology. 1998;9(1):84–91.
3. Lipsett M, Campleman S. Occupational exposure to diesel exhaust and
lung cancer: a meta-analysis. Am J Public Health. 1999;89(7):1009–1017.
4. Olsson AC, Gustavsson P, Kromhout H, et al. Exposure to diesel motor
exhaust and lung cancer risk in a pooled analysis from case-control studies
in Europe and Canada. Am J Respir Crit Care Med. 2011;183(7):941–948.
5. Silverman DT. Is diesel exhaust a human lung carcinogen? Epidemiology.
1998;9(1):4–6.
6. Steenland NK, Silverman DT, Hornung RW. Case-control study of lung
cancer and truck driving in the Teamsters Union. Am J Public Health.
1990;80(6):670–674.
7. Garshick E, Laden F, Hart JE, et al. Lung cancer and vehicle exhaust
in trucking industry workers. Environ Health Perspect. 2008;116(10):
1327–1332.
8. Laden F, Hart JE, Eschenroeder A, et al. Historical estimation of diesel
exhaust exposure in a cohort study of U.S. railroad workers and lung
cancer. Cancer Causes Control. 2006;17(7):911–919.
9. Emmelin A, Nystrom L, Wall S. Diesel exhaust exposure and smoking: a
case-referent study of lung cancer among Swedish dock workers.
Epidemiology. 1993;4(3):237–244.
10. Gustavsson P, Plato N, Lidstrom EB, et al. Lung cancer and exposure to
diesel exhaust among bus garage workers. Scand J Work Environ Health.
1990;16(5):348–354.
11. Neumeyer-Gromen A, Razum O, Kersten N, et al. Diesel motor emis-
sions and lung cancer mortality—results of the second follow-up of a
cohort study in potash miners. Int J Cancer. 2009;124(8):1900–1906.
12. Attfield M, Schleiff P, Stewart P, et al. Effects of diesel exhaust among
non-metal miners: a cohort mortality study with emphasis on lung cancer.
J Natl Cancer Inst. 2012;104(6): doi:10.1093/jnci/djs035.
13. Bunn WB III, Valberg PA, Slavin TJ, et al. What is new in diesel. Int Arch
Occup Environ Health. 2002;75(suppl):S122–S132.
14. Stewart P, Coble JB, Vermeulen R, et al. The Diesel Exhaust in Miners
Study: I. Overview of the exposure assessment process. Ann Occup Hyg.
2010;54(7):728–746.
15. Stewart P, Vermeulen R, Coble JB, et al. The Diesel Exhaust in Miners
Study: V. Evaluation of the exposure assessment methods. Ann Occup Hyg.
2011.
16. Vermeulen R, Coble JB, Yereb D, et al. The Diesel Exhaust in Miners
Study: III. Interrelations between respirable elemental carbon and gaseous
and particulate components of diesel exhaust derived from area sampling
in underground non-metal mining facilities. Ann Occup Hyg. 2010;
54(7):762–773.
17. Vermeulen R, Coble JB, Lubin J, et al. The Diesel Exhaust in Miners
Study: IV. Estimating historical exposures to diesel exhaust in under-
ground non-metal mining facilities. Ann Occup Hyg. 2010;54(7):774–788.
18. Coble JB, Stewart P, Vermeulen R, et al. The Diesel Exhaust in Miners
Study: II. Exposure monitoring surveys and development of exposure
groups. Ann Occup Hyg. 2010;54(7):747–761.
19. Stayner L, Steenland K, Dosemeci M, et al. Attenuation of exposure-
response curves in occupational cohort studies at high exposure levels.
Scand J Work Environ Health. 2003;29(4):317–324.
20. Garshick E, Laden F, Hart JE, et al. Lung cancer in railroad workers
exposed to diesel exhaust. Environ Health Perspect. 2004;112(15):1539–1543.
21. Lee KM, Chapman RS, Shen M, et al. Differential effects of smoking on
lung cancer mortality before and after household stove improvement in
Xuanwei, China. Br J Cancer. 2010;103(5):727–729.
22. Lan Q, Chapman RS, Schreinemachers DM, et al. Household stove
improvement and risk of lung cancer in Xuanwei, China. J Natl Cancer
Inst. 2002;94(11):826–835.
23. White PA. The genotoxicity of priority polycyclic aromatic hydrocarbons
in complex mixtures. Mutat Res. 2002;515(1–2):85–98.
24. Rengasamy A, Barger MW, Kane E, et al. Diesel exhaust particle-induced
alterations of pulmonary phase I and phase II enzymes of rats. J Toxicol
Environ Health A. 2003;66(2):153–167.
25. Courter LA, Luch A, Musafia-Jeknic T, et al. The influence of diesel
exhaust on polycyclic aromatic hydrocarbon-induced DNA damage, gene
expression, and tumor initiation in Sencar mice in vivo. Cancer Lett.
2008;265(1):135–147.
26. Kuempel ED, O’Flaherty EJ, Stayner LT, et al. Relationships between
lung dust burden, pathology and lifetime exposure in an autopsy study of
U.S. Coal Miners. Ann Occup Hyg. 1997;41(inhaled particles VIII):384–389.
27. CDC/NCHS. National Health Interview Survey, January-September 2009,
Sample Adult Core Component. Data based on household interviews of a
sample of the civilian noninstituionalized population. 2010:56.
28. Stewart PA, Coble JB, Vermeulen R, et al. Reply to Borak, et al., 2010 on
the Diesel Exhaust in Miners Study. Ann Occup Hyg. 2011;55(3):343–346.
29. Lewtas J, Silverman DT. Diesel exhaust. In: Identification of Research Needs to
Resolve the Carcinogenicity of High-Priority IARC Carcinogens. 42nd ed. Lyon,
France: International Agency for Research on Cancer; 2010:53–62.
30. O’Kelly JC. South Coast Air Quality Management District Monitoring
and Analysis Mira Loma PM10 Monitoring Sampling. Sampling
Conducted By Sumner Wilson, Senior Air Quality Instrument Specialist
Sample A. January 3, 2001.
31. Lena TS, Ochieng V, Carter M, et al. Elemental carbon and PM(2.5)
levels in an urban community heavily impacted by truck traffic. Environ
Health Perspect. 2002;110(10):1009–1015.
32. Ye D, Zhao Q, Jiang C, et al. Characteristics of elemental carbon and
organic carbon in PM10 during spring and autumn in Chongqing, China.
China Particuol. 2007;5(4):255–260.
33. Yu XY, Cary RA, Laulainen NS. Primary and secondary organic carbon
downwind of Mexico City. Atmos Chem Phys. 2009;9(18):6793–6814.
34. Brunciak PA, Dachs J, Franz TP, et al. Polychlorinated biphenyls and
particulate organic/elemental carbon in the atmospheres of Chesapeake
Bay, USA. Atmos Environ. 2001;35(32):5663–5677.
Funding
The research was funded by the Intramural Research Program of the
National Institutes of Health, National Cancer Institute, Division of Cancer
Epidemiology and Genetics and the National Institute for Occupational Safety
and Health, Division of Respiratory Disease Studies.
Notes
We thank the management and employees of the facilities and representatives
of the labor unions who participated in this study. Without their help and the
extra efforts they made to provide us with historical reports, this evaluation
would not have been possible. We also thank Robert Hoover and Shelia Zahm
of the National Cancer Institute for their insightful comments; Nathan Appel
725
730
735
740
14 Article
|
JNCI Vol. 104, Issue 11
|
June 6, 2012
of IMS, Inc for computer support; Robert Saal and Helen Jewell of Westat, Inc
for support in study and data management; and Rebecca Stanevich and Daniel
Yereb formerly of the National Institute for Occupational Safety and Health
and Mustafa Dosemeci, formerly of the National Cancer Institute, for their
work on the DEMS surveys.
The findings and conclusions in this report have not been formally dissem-
inated by the National Institute for Occupational Safety and Health and should
not be construed to represent any agency determination or policy. The authors
declare no potential conflict of interest.
Affiliations of authors: Occupational and Environmental Epidemiology
Branch, Division of Cancer Epidemiology and Genetics, National Cancer
Institute, Bethesda, MD (DTS, CMS, AEB, NR); Division of Cancer
Epidemiology and Genetics, National Cancer Institute, Bethesda, MD,
USA (JHL, RGZ, SW); Formerly of Division of Cancer Epidemiology and
Genetics, National Cancer Institute, Bethesda, MD (PAS); Stewart
Exposure Assessments, LLC, Arlington, VA (PAS); Formerly of Division of
Cancer Epidemiology and Genetics, National Cancer Institute, Bethesda,
MD (RV); Institute for Risk Assessment Sciences, Utrecht University,
3584 CK Utrecht, the Netherlands (RV); 1412 Harmony Lane, Annapolis,
MD (JBC); Surveillance Branch, Division of Respiratory Disease Studies,
National Institute for Occupational Safety and Health, Morgantown, WV
(PLS); ERS Inc, Morgantown, WV (MDA, formerly with National Institute
for Occupational Safety and Health, Morgantown, WV); Department
of Pathology, Memorial Sloan Kettering Cancer Center, New York, NY
(WDT).
745
750
755