Volatile biomarkers of pulmonary tuberculosis in the breath potx
Bạn đang xem bản rút gọn của tài liệu. Xem và tải ngay bản đầy đủ của tài liệu tại đây (367.73 KB, 9 trang )
Tuberculosis (2007) 87,44– 52
Tuberculosis
Volatile biomarkers of pulmonary tuberculosis in
the breath
Michael Phillips
a,b,
Ã
, Renee N. Cataneo
a
, Rany Condos
c
,
Gerald A. Ring Erickson
d
, Joel Greenberg
a,{
, Vincent La Bombardi
e
,
Muhammad I. Munawar
a
, Olaf Tietje
f
a
Menssana Research Inc., Fort Lee, NJ 07024, USA
b
Department of Medicine, New York Medical College, Valhalla, NY, USA
c
Division of Pulmonary and Critical Care Medicine, Bellevue Chest Service, NYU School of Medicine,
New York, NY, USA
d
Infometrix, Inc, Woodinville, WA, USA
e
Saint Vincent’s Medical Center, New York, NY, USA
f
SystAim GmbH, Pfingstweidstr. 31a, CH 8005 Zu¨rich, Switzerland
Received 14 December 2005; received in revised form 8 March 2006; accepted 10 March 2006
KEYWORDS
Volatile organic
compounds;
Breath;
Pulmonary tubercu-
losis;
Diagnosis
Summary Pulmonary tuberculosis may alter volatile organic compounds (VOCs) in
breath because Mycobacteria and oxidative stress resulting from Mycobacterial
infection both generate distinctive VOCs. The objective of this study was to
determine if breath VOCs contain biomarkers of active pulmonary tuberculosis. Head
space VOCs from cultured Mycobacterium tuberculosis were captured on sorbent
traps and assayed by gas chromatography/mass spectroscopy (GC/MS). One hundred
and thirty different VOCs were consistently detected. The most abundant
were naphthalene, 1-methyl-, 3-heptanone, methylcyclododecane, heptane,
2,2,4,6,6-pentamethyl-, benzene, 1-methyl-4-(1-methylethyl)-, and cyclohexane,
1,4-dimethyl
Breath VOCs were assayed by GC/MS in 42 patients hospitalized for suspicion of
pulmonary tuberculosis and in 59 healthy controls. Sputum cultures were positive for
Mycobacteria in 23/42 and negative in19/42 patients. Breath markers of oxidative
stress were increased in all hospitalized patients ðpo0:04Þ. Pattern recognition
analysis and fuzzy logic analysis of breath VOCs independently distinguished healthy
controls from hospitalized patients with 100% sensitivity and 100% specificity. Fuzzy
logic analysis identified patients with positive sputum cultures with 100% sensitivity
and 100% specificity (95.7% sensitivity and 78.9% specificity on leave-one-out cross-
validation); breath VOC markers were similar to those observed in vitro, including
ARTICLE IN P RESS
/>1472-9792/$ - see front matter & 2006 Elsevier Ltd. All rights reserved.
doi:10.1016/j.tube.2006.03.004
Ã
Corresponding author. Menssana Research, Inc., 1 Horizon Road, Suite 1415, Fort Lee, NJ 07024, USA. Tel./fax: 201 886 7004.
E-mail address: (M. Phillips).
{
Deceased.
naphthalene, 1-methyl- and cyclohexane, 1,4-dimethyl Pattern recognition
analysis identified patients with positive sputum cultures with 82.6% sensitivity
(19/23) and 100% specificity (18/18), employing 12 principal components from 134
breath VOCs.
We conclude that volatile biomarkers in breath were sensitive and specific for
pulmonary tuberculosis: the breath test distinguished between ‘‘sick versus well’’
i.e. between normal controls and patients hospitalized for suspicion of pulmonary
tuberculosis, and between infected versus non-infected patients i.e. between those
whose sputum cultures were positive or negative for Mycobacteria.
& 2006 Elsevier Ltd. All rights reserved.
Introduction
The current global epidemic of pulmonary tuber-
culosis has highlighted the need for new screening
tests that are rapid and accurate. The social burden
of pulmonary tubercu losis has increased because
many patients are also infected with human
immunodeficiency virus (HIV), and the rates of
multidrug-resistant tuberculosis are increasing.
1
However, screening technology has not changed
greatly during the past several decades. Many high-
burden countries depend upon sputum smears and
chest radiographs, supplemented by cultures when
resources permit. This approach is highly specific
for active pulmon ary tuberculosis, but its value in
primary screening is limited by low sensitivity and
high cost.
We tested the hypothesis that volatile organic
compounds (VOCs) in the breath might provide new
biomarkers of active pulmonary tuberculosis. The
rationale of this hypothesis is based on two
observations: first, Mycobacteria produce distinc-
tive patterns of VOCs in vitro, and second, patients
with active pulmonary tuberculosis suffer from
increased oxidative stress which also generates
distinctive patterns of VOCs. Several species of
Mycobacteria produce VOC metabolites that act as
chemical ‘‘fingerprints’’: M. avium, M tuberculosis,
M. gordonae, M. gastri, M. kansasii, M. szulgai, and
M. flavescens can be identified by their distinctive
patterns of volatile metabolites, including C14–C26
fatty acids and their methy lated and hydroxylated
derivatives.
2–4
Also, patients with active pulmonary
tuberculosis suffer from increased oxidative stress:
serum markers of oxidative stress, including lipid
peroxidation products, conjugated dienes, malon-
dialdehyde, and allantoin are generally increased
in patients with active pulmonary tuberculosis, and
decrease following a course of antituberculous
therapy.
5–7
Oxidative stress also liberates distinc-
tive VOCs into the breath, particularly C4 – C20
alkanes and methylated alkanes comprising the
breath methylated alkane contour (BMAC).
8
We
have previously reported altered patterns of breath
markers of oxidative stress in different diseases,
including heart transplant rejection,
9,10
lung can-
cer,
11,12
breast cancer,
13
ischemic heart disease,
14
preeclampsia of pregnancy,
15
and diabetes melli-
tus.
16
We analyzed VOCs derived from Mycobacteria
cultures, as well as VOC markers of oxidative stress
in the breath of patients undergoing evaluation for
Mycobacterial infection. Two different mathemati-
cal techniques, pattern recognition analysis and
fuzzy logic, were employed to address two ques-
tions: First, could breath VOCs distinguish between
healthy controls and all hospitalized patients
undergoing evaluation for Mycobacterial infection
(culture positive as well as culture negative)?
Second, could breath VOCs distinguish between
hospitalized patients whose sputum cultures for
Mycobacteria were positive or negative?
Methods
Breath collection and assay
The method has been described.
17
Subjects
breathed in and out through the disposable mouth-
piece of a portable breath collection apparatus for
2.0 min, and the VOCs in 1.0 l alveolar breath and
1.0 l room air were captured onto separate sorbent
traps. VOCs captured on the sorbent traps were
analyzed in the laboratory by automated thermal
desorption, gas chromatography and mass spectro-
scopy (ATD/GC/MS).
Identification of VOCs produced by M.
tuberculosis in vitro
Reference samples of M. tuberculosis were cul-
tured in vitro (by VLB) utilizing VersaTREK Myco
bottles (Trek Diagnostic Systems, Clevela nd, OH) at
Saint Vincent’s Medical Center, New York, NY. The
ARTICLE IN PRESS
Breath biomarkers of tuberculosis 45
Myco bottles containing 1.0 ml of Growth Supple-
ment were inoculated with 0.5 ml of a 1.0 McFar-
land suspension in sterile saline prepared from
isolates grown on Lowenstein Jensen medium. Myco
bottles containing growth supplement and inocu-
lated with 0.5 ml of sterile saline served as the
control. VOCs in 1.0 ml aspirated head space were
captured by injection onto a sorbent trap similar to
those employed for breath collections. Samples
incubated an additional 2 days after the Myco
bottle yielded a positive si gnal, were found to yield
optimal results. Head space samples were collected
from different isolates: Fresh clinical isolates of M.
tuberculosis ðn ¼ 12Þ and M. tuberculosis H37RV,
the pan-sensitive control strain of used for suscept-
ibility tests ðn ¼ 8Þ were assayed. Matching control
samples were drawn from uninoculated Myco
bottles incubated under the same conditions as
the test bottles. VOCs in the sorbent traps were
analyzed by ATD/GC/MS employing the same
method described for analysis of breath samples.
18
The abundance of a VOC was determined as
abundance in the test sample minus abundance in
the uninoculated sterile control. VOCs were ranked
by multiple t-tests comparing mean abundance in
all samples to sterile incubation containers.
Human subjects: pulmonary tuberculosis
Technically usable breath VOC samples were o b-
tained from 42 patients adm itted to a n isolation ward
on the in-patient Chest Service of Bellevue Hospital
to rule out suspected pulmonary tuberculosis. Criter-
ia for admission were chronic constitutional symp-
toms (cough, n ight sweats, fever, and weight loss for
more than 1 week) and/or an abnormal chest X-ray
(infiltrates, nodules, cavities, or pleural effus i ons). A
PPD test was performed in eligible patients on
admission and read at 48 h. Sputum was induced
daily for 3 days and sent fo r s t aining f or acid fast
bacilli and culture for Mycobacteria.
Human subjects: healthy controls
Breath samples were obtained in a similar fashion
from members of the general population in Staten
Island, NY with no history of tuberculosis or other
chronic disease.
8
An age-matched subgroup ðn ¼
59Þ was selected to serve as a control group for the
patients admitted for screening for pulmonary
tuberculosis. The institutional review boards of all
participating institutions approved the research.
Masking procedures
Clinicians and patho logists at Bellevue Hospital
collected and cultured sputum samples with no
knowledge of the breath test results. Breath
samples were collected (by MIM) and analyzed in
the laboratory (by RNC and JG) without knowledge
of the sputum smears or culture results.
Identification of breath VOC markers of
oxidative stress
The BMAC w as constructed for each subject using
alveolar gradients of C4-C20 n-alkanes and mono-
methylated alkanes.
8
The oxidative age, an age-
corrected value for the abundance of these VOCs
16
was compared in hospitalized patients and age-
matched healthy controls with a t-test.
Analysis of data
Two forms of multivariate analysis—fuzzy logic and
pattern recognition analysis—were employed in
order to correlate the patients’ breath VOCs with
their clinical status.
Fuzzy logic (Interrelation Miner, SystAim, Zu¨rich,
Switzerland) creates a membership score T
pos
for
membership in the group with disease present and
a second score T
neg
for membership in the group
with disease not present. Fuzzy logic was employed
to address two questions: (1) Can breath VOCs
distinguish between patients with a high suspicion
of pulmonary tuberculosis (and hence hospitalized)
from healthy controls? (2) Can breath VOCs
distinguish between hospitalized patients with a
positive sputum culture for Mycobacteria from
hospitalized patients with a negative sputum
culture? Values for T
neg
and for T
pos
were obtained
in two sets of data:
T
neg
T
pos
Can breath
VOCs be used
to distinguish
hospitalized
patients from
healthy
controls?
Typicality of a
healthy
control
Typicality of a
patient with
high suspicion
of pulmonary
TB (and hence
hospitalized)
Can breath
VOCs be used
to distinguish
hospitalized
sputum culture
positive
patients from
hospitalized
sputum culture
negative
patients?
Typicality of a
hospitalized
patient who is
sputum culture
negative
Typicality of a
hospitalized
patient who is
sputum culture
positive
ARTICLE IN PRESS
M. Phillips et al.46
In both cases, a similar analysis procedure was
applied: In the training set, fuzzy functions were
constructed for the candidate breath VOCs in order
to create a typicality matrix for the two groups
being compared in the table. In the prediction set,
these typicality matrices were employed to predict
the outcome by generating two numerical values
from the breath VOCs: T
neg
, the typicality for
disease not present and T
pos
, the typicality for
disease present. Employing a leave-one-out meth-
od, this procedure was iterated n times, employing
nÀ1 subjects in the training set and one subject in
the prediction set. The resulting values of T
pos
–T
neg
were employed as predictors of the diagnosis
disease present or disease not present, and the
accuracy of prediction was displayed in a receiver
operating characteristic (ROC) curve.
Pattern recognition analysis of breath VOCs
(Pirouette, Version 3.11, Infometrix, Inc. Bothell,
WA 98011) was employed for multivariate explora-
tory data analysis, category classification, and
continuous dependent variable modeling. Explora-
tory data analysis methods include hierarchical
cluster analysis (HCA) and principal component
(PC) analysis, category classification methods in-
clude K-nearest neighbor (KNN) and soft indepen-
dent modeling of class analogy (SIMCA), and
continuous dependent variable methods include PC
regression and partial least squares path modeling.
Subjects were assigned to three diagnostic groups:
class 1 (age-matched healthy controls), class 2
(sputum culture negative for M. tuberculosis), and
class 3 (sputum culture positive for M. tuberculo-
sis). Exploratory evaluations using PC factor analysis
(PCA) and HCA were performed to investigate data
structure and similarities between subjects and
between variables. Data were autoscaled for all
procedures in order to put each variable on the
common footing of zero mean and unit variance
over the sample set. Following exploratory analysis
and creation of subsets excluding potential outliers,
classification modeling procedures KNN and PC
proximity modeling (SIMCA) were tested to assess
classification accuracy into diagnostic models.
The goals of exploratory analysis include asses-
sing the relationships amongst the variables and the
dimensionality of the problem. Exploratory analysis
also helps assess the relationships amongst the test
subjects to see if mathematically derived clusters
reflect the diagnostic class assignments. Explora-
tory data analysis can reveal potential outlier
subjects so that they may be reviewed to deter-
mine which measured values are unusual. Outliers
may also be excluded fr om derivation of models to
predict class assignments. Exploratory PC analysis
and factor analysis methods help assess the under-
lying dimensionality of the alveolar gradient data
using orthogonal (mathematically independent)
components that contain significant portions of
the data variance. The calculated PCs are ordered
by largest to least variance, allowing retention of a
few PCs containing the majority of data variance
and discarding the bulk of remaining components
that contain small amounts of variance that may be
measurement noise. Dimensionality assessment is
also a guide for sufficiency of sample size for each
category of subjects. Since breath alveolar gradi-
ents for over 130 VOCs were measured for each test
subject, the number of variables far exceeded the
number of cases in each diagnostic category. A
general rule is to require at least three times as
many class members as variables or dimensions.
The number of subjects in the diagnostic groups
suggested limiting models to fewer than 12 PCs.
Results
In vitro studies
One hundred and thirty different VOCs were
consistently detected in M. tuberculosis cultures
in vitro, predominantly derivatives of benzene,
naphthalene, and alkanes. The 10 most abundant
VOCs are shown in Table 1.
Human studies
Patient characteristics are shown in Table 2.
Clinical course of hospitalized patients
All patients had three induced sputum for AFB. A
total of 23/42 patients h ad sputum that was culture
positive for M. tuberculosis. These patients were
referred to the Bellevue Chest clinic/DOT clinic and
followed. Of these patients, 16 had s putum that was
smear positive with appropriate clinical setting. Four
patients had bronchoscopy to c onfirm the diagn osis.
All four had post-bronchoscopy sputum smears that
were positive. Three patients ha d empiric therapy
initiated and later confirmed by positive culture.
In the culture negative group, the most common
diagnosis was bronchiectasis, followed by bronchi-
tis. Three patients had sputum cultures positive for
M avium intracellulare and were co-infected with
HIV. Two patients were begun on TB treatment
while awaiting culture results. In both cases, TB
therapy was discontinued when cultures were
negative at 2 months and an alternative diagnosis
of bronchiectasis was assigned to these patients. Of
the culture negative groups, 10 patients have had
ARTICLE IN PRESS
Breath biomarkers of tuberculosis 47
long-term follow-up through the Bellevue Health
Care system without evidence of tuberculosis, and
nine were lost to follow up.
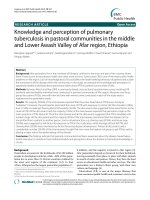
Breath VOC markers of oxidative stress
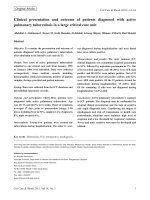
Mean BMACs in normal controls, sputum culture
negative patients and sputum culture positive
patients are shown in Fig. 1. The intensity of
oxidative stress as shown by oxidative age was
significantly increased in all hospitalized patients
undergoing evaluation for Mycobacterial infection
compared to normal controls (Fig. 2), but there was
no significant difference between patients whose
sputum was culture positive or culture negative for
M. tuberculosis.
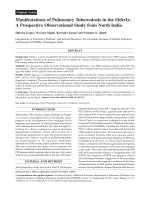
Pattern recognition analysis of breath VOCs
Figure 3 displays a scatter plot of test subjects
showing their PC scores for factor 1 versus factor 2
in the 134 VOC measurement space. Exploratory PC
ARTICLE IN PRESS
Table 1 VOC markers of M. tuberculosis observed in culture and in breath.
Culture (in vitro) Breath (fuzzy logic) Breath (pattern recognition)
Naphthalene, 1-methyl- Cyclohexane, 1,3-dimethyl-,
trans-
Factor 1
3-Heptanone Benzene, 1,4-dichloro- Benzene, ethyl-
Methylcyclododecane Cyclohexane, 1,4-dimethyl- Benzene, methyl-
Heptane, 2,2,4,6,6-pentamethyl- 1-Octanol, 2-butyl- Benzene, propyl-
Benzene, 1-methyl-4-
(1-methylethyl)-
2-Butanone Heptane, 3-methyl-
Cyclohexane, 1,4-dimethyl- Naphthalene, 1-methyl- Propane, 2-methoxy-2-me
3,5-dimethylamphetamine Camphene Factor 2
Butanal, 3-methyl- Decane, 4-methyl- 1-Octene
2-Hexene Heptane, 3-ethyl-2-methyl- Cyclohexane
Trans-anti-1-methyl-
decahydronaphthalene
Octane, 2,6-dimethyl- Heptanal
Benzene, 1,2,3,4-tetramethyl- Heptane, 2,4-dimethyl-
Bicyclo_3_1_1_hept-2-ene, 3,6,6-
trimethyl-
Heptane, 4-methyl-
Cyclohexane, 1-ethyl-4-methyl-,
trans-
Nonanal
l-_beta_-Pinene Pentane, 2-methyl-
Styrene
Tridecane
The ‘‘culture’’ column lists the 10 most abundant VOCs observed in cultures of Mycobacteria in vitro, ranked by their increased
abundance compared to sterile control vials. The ‘‘breath’’ columns lists the VOCs in breath identified by fuzzy logic analysis
and by pattern recognition analysis as the best discriminators between patients whose sputum cultures were positive or
negative for Mycobacteria. Breath VOCs identified by fuzzy logic are ranked by lambda value, and comprise the VOCs employed
as markers of Mycobacterial infection in Fig. 4. Breath VOCs identified by pattern recognition analysis are listed as components
of Factor 1 or Factor 2, and comprise the VOCs employed as markers of Mycobacterial infection in Fig. 3. Naphthalene, 1-
methyl- and cyclohexane, 1,4-dimethyl- were observed both in Mycobacterial culture and in the fuzzy logic breath
discriminators of infection. There were structural similarities among VOCs in all three groups, particularly derivatives of
heptane and benzene.
Table 2 Patient characteristics.
No. in group PPD status Mean age
Pos Neg ND Year (SD)
Hospitalized patients
Sputum culture
Positive for Mycobacteria 23 10 2 11 39.5 (14.2)
Negative for Mycobacteria 19 8 4 7 47.2 (8.9)
Healthy controls 59 59 41.1 (16.1)
PPD status is indicated as positive (pos), negative (neg) or not done (ND). There were no significant differences between ages of
subjects in the three groups (one-way ANOVA, NS).
M. Phillips et al.48
plots and cluster dendograms indicated two cases
(one normal, one culture-positive) that were
potential outliers. Evaluation of the alveolar
gradient values for these cases confirmed highly
unusual numbers and they were excluded from
model development. The PC plot of Fig. 3 is for the
reduced subset which has the two outliers ex-
cluded. In the full data set, these two outliers are
main determinants of the first two PCs due to the
large variance in their alveolar gradients.
Several KNN and SIMCA models exhibited either
high specificity or high sensitivity. The best single
model used SIMCA classification based on 10–12 PCs
for each class model. Correct classification of
class 3 culture positive subjects was
19
out of 23,
sensitivity ¼ 82.6%. No class 1 controls or class 2
negative culture subjects were incorrectly classi-
fied as class 3 positive for specificity ¼ 100%
(Table 3).
Fuzzy logic analysis of breath VOCs
The major breath VOCs that were used to distin-
guish hospitalized patients from hea lthy controls
are shown in Table 4. The major breath VOCs that
identified hospitalized patients with positive spu-
tum cultures are listed in Table 1. ROC curves
with sensitivity and specificity values are shown in
Fig. 4. When applied to distinguish hospitalized
patients from healthy controls (left panel) the
cross-validation with the leave-one-out procedure
ARTICLE IN PRESS
1
3
5
7
9
11
13
15
17
19
S1
S3
S5
S7
S9
-2
-1.5
-1
-0.5
0
0.5
1
mean alveolar gradient
carbon chain length
TB: normals
1
3
5
7
9
11
13
15
17
19
S1
S3
S5
S7
S9
-2
-1.5
-1
-0.5
0
0.5
1
TB: negative culture
1
3
5
7
9
11
13
15
17
19
S1
S3
S5
S7
S9
-2
-1.5
-1
-0.5
0
0.5
1
methylation site
TB: positive culture
Figure 1 Effect of Mycobacterial infection on breath markers of oxidative stress: the breath methylated alkane contour
(BMAC) is a display of oxidative stress markers in breath comprising C4–C20 alkanes and their monomethylated
derivatives. Mean BMACs (from left to right) are shown in normal controls, sputum culture negative patients and sputum
culture positive patients. The mean alveolar gradient (concentration in breath minus concentration in room air) is
shown on the vertical axis. The horizontal axes identify the specific VOC (e.g. the combination of carbon chain
length ¼ 7 and methylation site ¼ 3 corresponds to 3-methylheptane). The peaks are predominantly negative in the
normal controls, and predominantly positive in both culture positive patients and culture negative patients.
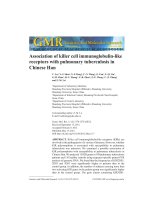
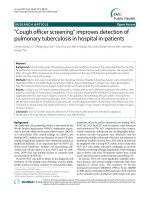
Figure 2 Oxidative age in healthy controls and hospita-
lized patients: oxidative age is the intensity of oxidative
stress expressed in standard deviations from the mean
observed in normal humans of the same age. The value of
oxidative age was determined in all subjects as (O–E)/S
where: VUC ¼ volume under curve of BMAC,
O ¼ observed VUC of BMAC in the study subject,
E ¼ expected BMAC of VUC in a normal subject of the
same age,
13
and S ¼ standard deviation of O–E in all
normal subjects. Oxidative age was significantly in-
creased in all hospitalized patients (TB pos+negs)
regardless of whether their sputum was culture positive
or culture negative for M. tuberculosis. However,
oxidative age was not significantly different in culture
positive and culture negative patients.
Breath biomarkers of tuberculosis 49
was 100% sensitive (42/42), and 100% specifi c (52/
52). When applied to distinguish hospitalized
patients with positive and negative sputum cultures
the cross-validation with the leave-one-out proce-
dure was 95.7% sensitive (22/23), and 78.9%
specific (15/19).
Discussion
There were two main conclusions from this study:
First, a set of breath VOCs accurately distinguished
between normal controls and hospitalized patients
undergoing screening for Mycobacterial infection.
Second, another set of breath VOCs distinguished
between hospitalized patients whose sputum cul-
tures were positive or negative for Myco bacterial
infection. Two different mathematical techni-
ques—fuzzy logic analysis and pattern recognition
analysis—independently generated similar conclu-
sions.
These findings appear to have resulted from two
different pathophysiologic processes. Breath mar-
kers of oxidative stress distinguished between
normal controls and hospitalized patients, but not
between hospitalized patients whose sputum cul-
tures were positive or negative for Myco bacterial
infection (Figs. 1 and 2). Oxidative stress markers
apparently distinguished the ‘‘sick’’ from the
‘‘well’’, because all of the hospitalized patients
had an abnormal chest X-ray and complained of
cough, night sweats, fever, and weight loss.
However, the best discriminators between hospita-
lized patients with positive or negative sputum
cultures comprised a group of breath VOCs that
were structurally similar to the most abundant
VOCs observed in cultures of Mycobacteria (Table 1,
Figs. 3 and 4).
Fuzzy logic and pattern recognition analysis are
powerful problem-solving methodologies that are
employed widely in industry and increasingly in
clinical medicine. Fuzzy logic has been employed to
identify tuberculous pleural effusions based upon
the immunoreactive concentrations of interleukins
in blood,
20
and also for the detection of lung
cancer by combining the contributions of multiple
ARTICLE IN PRESS
Table 3 Classification with pattern recognition analysis.
Actual Predicted
Normal
controls
Sputum
culture
negative
Sputum
culture
positive
No match Sensitivity Specificity
Normal controls 58 0 0 0 58/58 ¼ 100%
Sputum culture
negative
4 14 0 0 18/18 ¼ 100%
Sputum culture
positive
4019019/
23 ¼ 82.6%
The following table shows classification results for SIMCA employing 130 of 134 VOC variables, 2 outliers not included. The
rationale for exclusion of outliers is described in the Results section. Outlier cases were excluded in model development and
classification analysis, based on PCA and HCA results. There were 12 principal components in the model for control subjects, ten
principal components in the model for negative culture subjects and 12 principal components in the model for positive culture
subjects.
Figure 3 Pattern recognition analysis of breath VOCs:
scatter plot of test subjects per their principal compo-
nent scores for factor 1 versus factor 2, containing
20.94% of the original variance in the 134 VOC measure-
ment space. Principal components (factors) are orthogo-
nal (independent) dimensions calculated from the
measured variables, ranked by decreasing amounts of
variance contained in each factor. Factor 1 contains
14.48% and factor 2 contains 6.46% of the variance,
respectively. The scatter plot shows separation between
the majority of normal (control) test subjects (diagnostic
class 1) and those with symptoms (diagnostic classes 2
and 3). SIMCA classification models for each class used
from six to twelve principal components to describe the
location and dispersion of subjects for the three
diagnostic groups.
M. Phillips et al.50
different tumor markers in serum.
21
Pattern re-
cognition software has been employed for the rapid
identification of Mycobacteria based upon their
mycolic acid patterns detected by high-pe rfor-
mance liquid chromatography.
22
It is not yet known if the results of the breath
test are affected by concomitant infection with
HIV. This pilot study was insufficiently powered to
resolve that concern, and larger future studies will
be required to provide a definitive answer.
We conclude that breath testing, combined with
multivariate analysis of data employing fuzzy logic
or pattern recognition analysis, could potentially
provide a new method for rapid, accurate, and non-
invasive identification of patients at high risk of
active pulmonary tuberculosis, and to distinguish
between those with positive or negative sputum
cultures. However, since these findings were
derived from a comparatively small pilot study,
confirmation will require additional studies in
larger numbers of patients.
Acknowledgements
This research was supported by SBIR award 1R43
AI52504-01 from the National Institute of Allergy
and Infectious Diseases of the National Institutes of
Health. Michael Phillips is President and CEO of
Menssana Research, Inc.
ARTICLE IN PRESS
Figure 4 Fuzzy logic analysis of breath VOCs: these ROC curves display the sensitivity and specificity of the breath test
in two groups. Left panel: hospitalized patients undergoing evaluation for Mycobacterial infection (42) versus age-
matched healthy controls (59). Right panel: hospitalized patients with a positive sputum culture for Mycobacteria (23)
versus hospitalized patients with a negative sputum culture (19). In both cases (left panel and right panel), a leave-one-
out procedure was employed, where n–1 subjects were employed in the training set to construct the typicality
matrices, and the outcome was predicted in one subject. The process was iterated n times, in order to predict the
outcome in every subject. AUC ¼ area under curve.
Table 4 Major breath VOC markers in hospitalized patients versus healthy controls.
VOCs Goodman/Kruskal l
1,3-Isobenzofurandione 0.905
Pentane, 2,3-dimethyl- 0.881
Acetaldehyde 0.857
Benzenemethanol, _alpha_,_alpha_-dimethyl- 0.81
Cyclohexane 0.643
1,1
0
-Biphenyl, 2,2
0
-diethyl- 0.595
1H-Indene, 2,3-dihydro-1,1,3-trimethyl-3-phenyl- 0.571
Fuzzy logic identified these VOCs that distinguished ‘‘sick’’ from ‘‘well’’ subjects.
VOCs are shown ranked by Goodman/Kruskal l because higher values indicate an increased likelihood that the VOC was
distinctive in a hospitalized patient.
Breath biomarkers of tuberculosis 51
References
1. Schluger NW. The diagnosis of tuberculosis: what’s old,
what’s new. Semin Respir Infect 2003;18:241–8.
2. Tisdall PA, Roberts GD, Anhalt JP. Identification of clinical
isolates of Mycobacteria with gas-liquid chromatography
alone. J Clin Microbiol 1979;10:506–14.
3. Zhang Y, Zhuang Y, Liu Z, Ruan J. Identification of twenty-
eight species Mycobacteria with their cellular fatty acids
by capillary gas chromatography. Wei Sheng Wu Xue Bao
1991;31:187–97.
4. Parez JJ, Fauville-Dufaux M, Dossogne JL, de Hoffmann E,
Pouthier F. Faster identification of Mycobacteria using gas
liquid and thin layer chromatography. Eur J Clin Microbiol
Infect Dis 1994;13:717–25.
5. Kwiatkowska S, Piasecka G, Zieba M, Piotrowski W, Nowak D.
Increased serum concentrations of conjugated diens and
malondialdehyde in patients with pulmonary tuberculosis.
Respir Med 1999;93:272–6.
6. Walubo A, Smith PJ, Folb PI. Oxidative stress during anti-
tuberculous therapy in young and elderly patients. Biomed
Environ Sci 1995;8:106–13.
7. Plit ML, Theron AJ, Fickl H, van Rensburg CE, Pendel S,
Anderson R. Influence of antimicrobial chemotherapy and
smoking status on the plasma concentrations of vitamin C,
vitamin E, beta-carotene, acute phase reactants, iron and
lipid peroxides in patients with pulmonary tuberculosis. Int J
Tuberc Lung Dis 1998;2:590–6.
8. Phillips M, Cataneo RN, Greenberg J, Gunawardena R, Naidu
A, Rahbari-Oskoui F. Effect of age on the breath methylated
alkane contour, a display of apparent new markers of
oxidative stress. J Lab Clin Med 2000;136:243–9.
9. Phillips M, Boehmer J, Cataneo R, et al. Heart Allograft
Rejection: Detection with Breath Alkanes in Low Levels (the
HARDBALL study). J Am Col Cardiol 2002;1:12–3.
10. Phillips M, Boehmer J, Cataneo R, et al. Heart allograft
rejection: detection with breath Alkanes in low levels (the
HARDBALL study). J Heart Lung Transplant 2004;23:701–8.
11. Phillips M, Gleeson K, Hughes JM, et al. Volatile organic
compounds in breath as markers of lung cancer: a cross-
sectional study. Lancet 1999;353:1930–3.
12. Phillips M, Cataneo R, Cummin A, et al. Detection of lung
cancer with volatile markers in the breath.
Chest
2003;123:2115–23.
13. Phillips M, Cataneo R, Ditkoff B, et al. Volatile
markers of breast cancer in the breath. Breast J 2003;9:
184–91.
14. Phillips M, Cataneo R, Greenberg J, Grodman R, Salazar M.
Breath markers of oxidative stress in patients with unstable
angina. Heart Dis 2003;5:95–9.
15. Moretti M, Phillips M, Abouzeid A, Cataneo R, Greenberg J.
Increased breath markers of oxidative stress in normal
pregnancy and in preeclampsia. Am J Obstet Gynecol
2004;190:1184–90.
16. Phillips M, Cataneo R, Cheema T, Greenberg J. Increased
breath biomarkers of oxidative stress in diabetes mellitus.
Clin Chim Acta 2004;344:189–94.
17. Phillips M. Method for the collection and assay of volatile
organic compounds in breath. Anal Biochem 1997;247:
272–8.
18. Phillips M, Herrera J, Krishnan S, Zain M, Greenberg J,
Cataneo RN. Variation in volatile organic compounds in the
breath of normal humans. J Chromatogr B Biomed Sci Appl
1999;729:75–88.
19. Kneepkens CM, Ferreira C, Lepage G, Roy CC. The hydro-
carbon breath test in the study of lipid peroxida-
tion: principles and practice. Clin Invest Med 1992;15:
163–86.
20. Chomej PBK, Bitterlich N, Hui DS, Chan KS, Gosse H, Schauer
J, et al. Differential diagnosis of pleural effusions by fuzzy-
logic-based analysis of cytokines. Respir Med 2004;98:
308–17.
21. Schneider JPG, Bitterlich N, Neu K, Velcovsky HG, Morr H,
Katz NEE. Fuzzy logic-based tumor marker profiles including
a new marker tumor M2-PK improved sensitivity to the
detection of progression in lung cancer patients. Anticancer
Res 2003;23:899–906.
22. Glickman S, Kilburn J, Butler W, Ramos L. Rapid identifica-
tion of mycolic acid patterns of Mycobacteria by high-
performance liquid chromatography using pattern recogni-
tion software and a Mycobacterium library. J Clin Microbiol
1994;32:740–5.
ARTICLE IN PRESS
M. Phillips et al.52