Radiological Findings of Extensively Drug-Resistant Pulmonary Tuberculosis in Non-AIDS Adults: Comparisons with Findings of Multidrug-Resistant and Drug-Sensitive Tuberculosis docx
Bạn đang xem bản rút gọn của tài liệu. Xem và tải ngay bản đầy đủ của tài liệu tại đây (459.69 KB, 10 trang )
Korean J Radiol 10(3), June 2009
207
Radiological Findings of Extensively
Drug-Resistant Pulmonary Tuberculosis
in Non-AIDS Adults: Comparisons with
Findings of Multidrug-Resistant and
Drug-Sensitive Tuberculosis
Objective: This study was designed to describe the radiological findings of
extensively drug-resistant (XDR) pulmonary tuberculosis (TB) and to compare
the observed findings with findings of drug-sensitive (DS) and non-XDR mul-
tidrug-resistant (MDR) TB in non-AIDS patients.
Materials and Methods: From September 1994 to December 2007, 53 MDR
TB patients (M:F = 32:21; mean age, 38 years) and 15 XDR TB non-AIDS
patients (M:F = 8:7; mean age, 36 years) were enrolled in the study. All of the
MDR TB patients had received no treatment or less than one month of anti-TB
treatment. In addition, all XDR TB patients received either no anti-TB treatment or
only first-line anti-TB drugs. In addition, 141 consecutive DS TB patients (M:F =
79:62; mean age, 51 years) were also enrolled in the study for comparison. Chest
radiograph, CT and demographic findings were reviewed and were compared
among the three patient groups.
Results: For patients with XDR TB, the most frequent radiographic abnormali-
ties were nodules (15 of 15 patients, 100%), reticulo-nodular densities (11 of 15,
73%), consolidation (9 of 15, 60%) and cavities (7 of 15, 47%) that were located
mainly in the upper and middle lung zones. As seen on radiographs, significant
differences were found for the frequency of nodules and ground-glass opacity
lesions (all p < 0.001) (more frequent in DS TB patients than in MDR and XDR TB
patients). For the use of CT, significant differences (more frequent in MDR and
XDR TB patients) were found for the frequency of multiple cavities, nodules and
bronchial dilatation (p = 0.001 or p < 0.001). Patients with MDR TB and XDR TB
were younger as compared to patients with DS TB (p < 0.001). Imaging findings
were not different between patients with MDR TB and XDR TB.
Conclusion: By observation of multiple cavities, nodules and bronchial dilata-
tion as depicted on CT in young patients with acid-fast bacilli (AFB) positive spu-
tum, the presence of MDR TB or XDR TB rather than DS TB can be suggested.
There is no significant difference in imaging findings between patients with XDR
TB and MDR TB.
xtensively drug-resistant (XDR) tuberculosis (TB) is an emerging life-
threatening infection and is caused by a strain of Mycobacterium tubercu-
losis that is resistant to any type of fluoroquinolone and at least one of
the three following injectable drugs: amikacin, capreomycin or kanamycin in addition
to isoniazid and rifampin. Multidrug-resistant (MDR) TB is defined as a strain resistant
to at least isoniazid and rifampin (1). According to a previous report (2), XDR TB that
Jihoon Cha, MD
1
Ho Yun Lee, MD
1
Kyung Soo Lee, MD
1
Won-Jung Koh, MD
2
O Jung Kwon, MD
2
Chin A Yi, MD
1
Tae Sung Kim, MD
1
Myung Jin Chung, MD
1
Index terms:
Computed tomography (CT),
high-resolution
Lung, infection
Tuberculosis, pulmonary
Thorax, radiography
DOI:10.3348/kjr.2009.10.3.207
Korean J Radiol 2009;10:207-216
Received October 29, 2008; accepted
after revision February 4, 2009.
1
Department of Radiology and Center for
Imaging Science;
2
Division of Pulmonary
and Critical Care Medicine, Department of
Internal Medicine, Samsung Medical
Center, Sungkyunkwan University School
of Medicine, Seoul 135-710, Korea
This study was presented as a scientific
poster at the 2008 RSNA scientific
assembly (Paper number: LL-CH-D03).
The SRC/ERC Program of MOST/KOSEF
(R11-2002-103) supported this study.
Address reprint requests to:
Kyung Soo Lee, MD, Department of
Radiology and Center for Imaging
Science, Samsung Medical Center,
Sungkyunkwan University School of
Medicine, 50 Ilwon-dong, Gangnam-gu,
Seoul 135-710, Korea.
Tel. (822) 3410-2511
Fax. (822) 3410-2559
e-mail:
E
has been transmitted to HIV-infected patients is associated
with high mortality; in this study, all (44 patients) patients
who underwent HIV testing had positive results and 52
(98%) of 53 patients died. The median survival was 16
days from the time of diagnosis in the 42 patients with
confirmed dates of death (2).
Extensive drug-resistant TB can also occur in non-AIDS
patients. Four to 19% of MDR TB isolates are in fact XDR
strains (3, 4). Non-AIDS XDR TB patients are more
difficult to treat as compared to patients with non-XDR
MDR TB (5-11). In South Korea, approximately 5-20% of
MDR TB patients have been confirmed as having XDR TB
in both the public and private sectors (3, 5, 7, 10, 12, 13).
As compared with patients with drug-sensitive (DS)
pulmonary TB, non-AIDS patients with MDR TB are
younger and the patients have a more frequent history of
previous TB treatment and show multiple cavitary lung
lesions as seen on CT (14). Although clinical features of
XDR TB have been reported (5-11, 13), to the best of our
knowledge, the imaging findings of XDR TB have not been
reported. Thus, the purpose of this study was to describe
the radiological findings of XDR pulmonary TB and to
compare the observed findings with findings of DS TB and
non-XDR MDR TB in non-AIDS patients.
MATERIALS AND METHODS
Our Institutional Review Board approved this study.
Patient informed consent was waived for this retrospective
study.
Patients
From September 1994 to December 2007, 65 non-AIDS
patients with MDR TB (disease that developed in patients
with no history of anti-tuberculous chemotherapy or a
history of < one month of therapy) were enrolled in the
study. Among the 65 patients, a chest radiograph was
available for 53 patients and CT scans were available for
42 patients. Seventeen non-AIDS patients with XDR TB
(disease that developed in patients with no history of anti-
tuberculous chemotherapy (n = 7) or developed in patients
who had a treatment history only with the use of first-line
drugs (n = 10)) were enrolled in the study. Among the 17
patients, a chest radiograph was available for 15 patients
and CT scans were available for seven patients. Imaging
studies were obtained within 60 days of the expectoration
of the sputum from which MDR TB or XDR TB organisms
were isolated. For comparative purposes, we also enrolled
141 consecutive non-AIDS DS TB (defined as disease with
no resistance to any drug) patients from June 2003 to June
2004, for whom anti-tuberculous chemotherapy was never
given and in whom both chest radiographic and CT studies
were performed within 60 days of TB diagnosis. The
sample size of this control group (DS TB patients) was
based on power analysis (see Appendix) (15, 16).
Intervals between DS TB isolation and the initial chest
radiographic or CT examination ranged from -52 days to
26 days (median, -1 day; inter-quartile range, -3~0 days)
and from -36 days to 49 days (median, 0 days; inter-
quartile range, -2~1 days), respectively. Intervals between
MDR TB isolation and the initial chest radiographic or CT
examination ranged from -58 days to 6 days (median, 0
days; inter-quartile range, -2~0 days) and from -32 days
to 47 days (median, 0 days; inter-quartile range, -1~6.8
days), respectively. Intervals between XDR TB isolation
and the initial chest radiographic or CT examination
ranged from -4 days to 35 days (median, 0 days; inter-
quartile range, 0~7.5 days) and from -1 day to 35 days
(median, 8 days; inter-quartile range, 0~14 days), respec-
tively. Intervals between TB isolation and a chest
radiograph were significantly longer in XDR TB patients
than DS TB patients and MDR TB patients (p = 0.001 for a
chest radiograph and p = 0.024 for CT).
Imaging Technique
Posterior-anterior chest radiographs were obtained with
the use of a digital radiography system (Revolution XQi
ADS_28.4, GE Medical Systems, Milwaukee, WI) with a
focal spot size of 1.25 mm, distance from source to
detector of 180 cm, 120 kVp and 200-250 mA.
Helical CT scans were obtained by the use of the follow-
ing equipment. A single-detector scanner was used for 33
patients (HiSpeed Advantage, GE Medical Systems), a
four-detector row scanner was used for 40 patients
(LightSpeed QX/I, GE Medical Systems), an eight-detector
row scanner was used for 59 patients (LightSpeed Ultra,
GE Medical Systems), a 16-detector row scanner was used
for 30 patients (LightSpeed16, GE Medical Systems), a 40-
detector row scanner was used for five patients (Brilliance
40, Philips Medical Systems, Best, The Netherlands) and a
64-detector row scanner was used for five patients
(Aquilion, Toshiba, Tokyo, Japan). Other CT scanners
were utilized for 18 patients. None of the patients received
an intravenous injection of contrast medium. The scanning
parameters were 120 kVp and 90-170 mA. Scanning and
image reconstruction for single-detector CT was performed
with a section thickness of 5 mm, a pitch of 1 and a
reconstruction interval of 5 mm. For the 4-64-detector row
CT scanners, scanning and image reconstruction was
performed with a beam width of 0.625-10 mm and a beam
pitch of 0.875-1.675 and scan data were reconstructed
with a 2.5-mm section thickness for transverse images. In
Cha et al.
208
Korean J Radiol 10(3), June 2009
both single and multiple-detector CT, data were
reconstructed by the use of a bone algorithm. Image data
were directly displayed on monitors (four monitors with
1,536 × 2,048 image matrices, 8-bit viewable gray scale
and 60-ft-lambert luminescence) of a picture archiving and
communication system (PACS) (Pathspeed or Centricity
2.0; General Electric Medical Systems Integrated Imaging
Solutions, Mt. Prospect, IL). Both mediastinal (window
width, 400 HU; window level, 20 HU) and lung (window
width, 1,500 HU; window level, -700 HU) window images
were available on the monitors for analysis.
Analyses of Radiographic and CT Findings
Reviews of chest radiographs and CT scans were
performed at least two months apart for concern of recall
bias. Chest radiographs and CT scans were reviewed in a
random order by two independent thoracic radiologists for
frequency and extent (involved zones on radiographs or
the number of lobes seen on CT images) of lung lesions,
and decisions on findings were reached by consensus. If
controversy arose, a third reviewer repeatedly reviewed
the cases based on the analyses of the previous two
reviewers.
For the chest radiographic analyses, we divided each
lung into three zones, and each zone was assessed
separately. Lesions were considered located in the upper
zone if they were located cephalad to the aortic arch, in
the lower zone if they were located caudad to the inferior
pulmonary vein and in the middle zone if they were
located in between the other two areas. The overall extent
of each pattern was estimated by calculating the number of
the involved zones (six zones for each patient). The
observers assessed the extent and presence of lung
parenchymal abnormalities including reticulo-nodular
opacity, nodule size (a small nodule < 10 mm in diameter;
large nodule, 10-30 mm), all nodules (small nodules or
large nodules), consolidation and ground-glass opacity
(GGO). The number of cavities and the presence or
absence of pleural effusion and lymphadenopathy were
also recorded. Reticulo-nodular opacity was regarded
present when combined reticular and nodular opacity was
observed. A nodule was considered present when there
was rounded opacity that was well-defined or poorly
defined. Consolidation was defined as a homogeneous
increase in pulmonary parenchymal opacity that obscured
the margins of vessels and airway walls. GGO was defined
as an area of hazy increased lung opacity, within which
margins of pulmonary vessels may be indistinct. A cavity
was regarded present when a gas-filled space was noticed
within pulmonary consolidation, a mass or a nodule (17).
On CT scans, the presence of each parenchymal
abnormality in each lobe (six lobes: right upper lobe, right
Radiological Findings of Extremely Drug-Resistant Pulmonary Tuberculosis in Non-AIDS Patients
Korean J Radiol 10(3), June 2009
209
Table 1. Comparisons of Demographic Data among 141 Patients with Drug-Sensitive Tuberculosis, 53 Patients with
Multidrug-Resistant Tuberculosis and 15 Patients with Extensively Drug-Resistant Tuberculosis
DS TB (n = 141) MDR TB (n = 53) XDR TB (n = 15) P values
Age, years (mean
SD) 51 19.1 38 17.5 36 16.5 < 0.001*
(53, 1.61, 15-85) (31, 2.41, 15-74) (30, 4.27, 19-75)
Sex (M:F) 79 : 62 32 : 21 8 : 7 < 0.826
Note.─ *Kruskal-Wallis test was used to compare three, different groups. DS TB = drug-sensitive tuberculosis, MDR TB = multidrug-resistant
tuberculosis, XDR TB = extensively drug-resistant tuberculosis, SD = standard deviation. Numbers in parentheses are median, standard error and range.
Table 2. Presence of Parenchymal Abnormalities among Three Groups as Depicted on Chest Radiographs
DS TB (n = 141) MDR TB (n = 53) XDR TB (n = 15) P values Meanings
�
Reticulo-nodular opacity 112 (79) 40 (75) 11 (73) < 0.757
All nodules 125 (89) 44 (83) 015 (100) < 0.187
Small nodules 123 (87) 43 (81) 12 (80) < 0.478
Large nodules 097 (69) 18 (34) 09 (60) < 0.001 MDR < DS*
Consolidation 111 (79) 36 (68) 09 (60) < 0.122
GGO lesion 090 (64) 10 (19) 05 (33) < 0.001 MDR = XDR < DS
Cavities 073 (52) 23 (43) 07 (47) < 0.570 DS < MDR = XDR
Multiple cavities 08 (6) 09 (17) 03 (20) < 0.021 MDR < DS*
Pleural effusion 081 (57) 16 (30) 05 (33) < 0.002 MDR < DS*
Lymphadenopathy 041 (29) 12 (23) 1 (7) < 0.140
Note.─
�
Meanings were derived from paired comparisons of each of two groups. *XDR TB as compared with MDR TB or XDR TB as compared with DS
TB was not significant. Numbers in parentheses are percentages. DS TB = drug-sensitive tuberculosis, MDR TB = multidrug-resistant tuberculosis, XDR
TB = extensively drug-resistant tuberculosis, GGO = ground-glass opacity
middle lobe, right lower lobe, upper division of the left
upper lobe, lingular division of the left upper lobe and the
left lower lobe) was recorded. The observers assessed the
extent and presence of tree-in-bud signs (centrilobular
nodules less than 10 mm in diameter and branching
nodular structures within a secondary pulmonary lobule),
small nodules (nodules < 10 mm in diameter), large
nodules (10-30 mm in diameter), all nodules (small
nodules or large nodules), consolidation, GGO and
bronchial dilatation (17). The number of cavities (summed
number of cavitating nodules or masses and cavitating
consolidation), presence of pleural effusion, pleural
thickening, pericardial effusion and lymphadenopathy
were also recorded.
Statistical Analyses
Statistical analyses were performed using SPSS software
(version 12.0; SPSS, Chicago, IL). The significances of
differences of sex and the frequency of each pattern of
parenchymal abnormality in the three disease groups were
evaluated using the chi-square test. The Kruskal-Wallis test
was used to compare differences of age, number of cavities
and the extent of involvement (i.e., the number of
involved lobes) of each pattern of parenchymal abnormal-
ity in the three groups. If significant differences among the
three groups were determined with use of the Kruskal-
Wallis test, the Mann-Whitney test was used to determine
the difference between any two groups. For all statistical
values, a p value of less than 0.05 was considered to
indicate a statistically significant difference.
RESULTS
Patients Demographics
The demographic data of the three patient groups are
summarized in Table 1. The mean age of all patients was
47 years and the age range was 15-85 years. The mean
ages were significantly different for the DS TB group
(mean age, 51 years; median age, 53 years; age range, 15-
85 years, standard error, 1.61), the MDR TB group (mean
age, 38 years; median age, 31 years; age range, 15-74
Cha et al.
210
Korean J Radiol 10(3), June 2009
Table 3. Extent of Parenchymal Abnormalities and Number of Cavities in Three Groups as Depicted on Chest Radiographs
DS TB (n = 141) MDR TB (n = 53) XDR TB (n = 15) P values Meanings
Reticulo-nodular opacity 1.13
0.88 1.58 1.54 1.47 1.13
(1, 0.07, 0-5) (1, 0.21, 0-6) (2, 0.29, 0-3) < 0.233
Small nodules 1.48
1.02 1.55 1.42 1.53 1.13
(1, 0.09, 0-5) (1, 0.20, 0-6) (2, 0.29, 0-4) < 0.851
Large nodules 0.96
0.92 0.43 0.69 0.80 0.78
(1, 0.08, 0-5) (0, 0.10, 0-3) (1, 0.20, 0-2) < 0.001 MDR < DS*
Consolidation 1.20
1.03 1.08 0.98 1.20 1.32
(1, 0.09, 0-5) (1, 0.13, 0-3) (1, 0.34, 0-4) < 0.746
GGO lesion 0.89
0.92 0.36 0.83 0.53 0.83
(1, 0.07, 0-5) (0, 0.12, 0-4) (0, 0.22, 0-2) < 0.001 MDR < DS*
Number of cavities 0.63
0.81 0.68 0.96 0.80 1.15
(1, 0.07, 0-5) (0, 0.13, 0-4) (0, 0.30, 0-4) < 0.943
Note.─ *XDR TB as compared with MDR TB or XDR TB as compared with DS TB is not significant. Numbers represent mean standard deviation of
involved zones. Numbers in parentheses are median, standard error and range. DS TB = drug-sensitive tuberculosis, MDR TB = multidrug-resistant
tuberculosis, XDR TB = extensively drug-resistant tuberculosis, GGO = ground-glass opacity
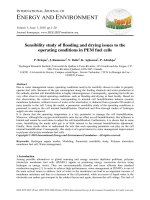
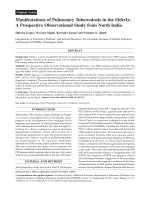
Fig. 1. Findings for extensively drug-resistant pulmonary tubercu-
losis in 29-year-old man. Posterior-anterior chest radiograph
shows nodules, consolidation containing cavities and ground-
glass opacity in right lung and reticulo-nodular lesions (arrow) in
left middle lung zone.
years, standard error, 2.41) or the XDR TB group (mean
age, 36 years; median age, 30 years; age range, 19-75
years, standard error, 4.27). Patients with DS TB were
older as compared to patients with MDR TB or XDR TB (p
< 0.001). There was no significant age difference between
patients with MDR TB and XDR TB. The sex ratio was not
significantly different among the three groups.
Imaging Findings
Chest Radiographic Findings
The radiographic findings of the three patient groups
with TB are summarized in Tables 2 and 3, and the
radiographic findings for XDR TB patients are described in
Table 4. For XDR TB patients, the most frequent patterns
of lung involvement were all nodules (small nodules or
large nodules, 15 of 15 patients, 100%), reticulo-nodular
densities (11 of 15, 73%) and consolidation (9 of 15,
60%). Cavities were observed in seven (47%) patients
(Table 2). All of these patterns for parenchymal lesions
were predominantly located in the upper and middle lung
zones (Table 4) (Figs. 1 and 2).
The most common finding in all three groups was all
nodules (observed in 89%, 83% and 100% for patients
with DS TB, MDR TB and XDR TB, respectively) (Table 2)
(Figs. 1-3). The frequency of GGO and pleural effusion
was significantly higher in patients with DS TB as
compared to patients with MDR TB and XDR TB (p <
0.001). Multiple cavities were more frequently observed in
MDR TB and XDR TB patients as compared to DS TB
patients (p = 0.021) (Figs. 1 and 2). Large nodules (p <
0.001) and GGO lesions (p < 0.001) were more extensive
in DS TB patients as compared to MDR TB patients (Table
Radiological Findings of Extremely Drug-Resistant Pulmonary Tuberculosis in Non-AIDS Patients
Korean J Radiol 10(3), June 2009
211
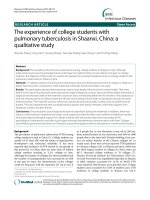
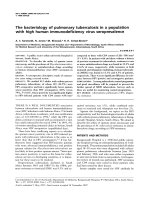
Fig. 2. Findings for extensively drug-resistant pulmonary tuberculosis in 22-year-old man.
A. Posterior-anterior chest radiograph shows small nodular lesions, reticulo-nodular lesions and cavitating nodules (arrows) mainly in left
upper and middle lung zones and in right apex.
B-D. Transverse CT (2.5-mm section thickness) scans obtained at levels of great vessels (B), main bronchi (C) and left basal trunk (D),
respectively, show small nodules and cavitating nodules (arrows) mainly in left upper lobe and superior segment of left lower lobe. Also,
note mild interlobular septal thickening (arrowheads) in left upper lobe.
AB
CD
3). There was no significant difference in the radiographic
findings between MDR TB and XDR TB patients.
CT Findings
The CT findings of the three patient groups with TB are
summarized in Tables 5 and 6. For XDR TB patients, the
most frequent patterns of lung involvement were all
nodules (6 of 7 patients, 86%), and the tree-in-bud sign (5
of 7 patients, 71%). Cavities were observed in three (43%)
patients. All of these patterns of parenchymal lesions were
predominantly located in the upper and lower lobes (Table
4) (Fig. 2).
The most common pattern in the three groups was all
nodules (observed in 93%, 98% and 86% of DS TB, MDR
TB and XDR TB patients, respectively) (Table 5) (Figs. 2
and 3). Large nodules were more commonly observed in
MDR TB patients (71%, mean extent 1.19 lobes) as
compared to DS TB patients (50%, mean extent 0.83
lobes) (p = 0.015) (Tables 5 and 6). The extent of small
nodules was significantly larger in patients with MDR TB
as compared to patients with DS TB (p = 0.049) (Table 6).
Multiple cavities were also more commonly observed in
patients with MDR TB (40%) as compared to patients with
DS TB (15%) (p < 0.002) (Fig. 2). The mean number of
cavities for DS TB, MDR TB and XDR TB patients were
1.38, 2.45 and 4.86, respectively (Table 6). Bronchial
dilatation was more common in XDR TB patients (43%,
mean extent 0.43 lobe) and MDR TB patients (55%, mean
Cha et al.
212
Korean J Radiol 10(3), June 2009
Table 4. Chest Radiographic and CT Findings of Extensively Drug-Resistant Pulmonary Tuberculosis
Radiographic Findings (n = 15) CT Findings (n = 7)
Patterns Laterality Zonal Involvement Patterns Laterality Involved Lobes
Uni Bi RU RM RL LU LM LL Uni Bi RU RM RL LU Li LL
RN opacity 9 02 10 1 0 6 4 1 TBS 3 2 3 0 1 1 1 1
(n = 11) (n = 5)
All nodules 5 10 10 3 3 6 5 4 All nodules 4 2 6 0 3 2 1 1
(n = 15) (n = 6)
Small nodules 4 08 09 3 2 3 4 2 Small nodules 4 2 6 0 3 2 1 1
(n = 12) (n = 6)
Large nodules 8 01 04 2 1 4 1 0 Large nodules 5 1 3 0 1 2 0 1
(n = 9) (n = 6)
Consolidation 9 00 06 5 2 3 2 0 Consolidation 2 1 2 1 1 1 0 0
(n = 9) (n = 3)
GGO (n = 5) 5 00 00 2 1 3 2 0 GGO (n =0) 0 0 0 0 0 0 0 0
Cavity (n = 7) 5 02 06 1 0 2 2 1 Cavity (n = 3) 2 1 3 0 0 1 1 1
Note.─ Uni = unilateral, Bi = bilateral, RU = right upper, RM = right middle, RL = right lower, LU = left upper, LM = left middle, Li = lingular division,
LL = left lower, RN = reticulo-nodular, GGO = ground-glass opacity, TBS = tree-in-bud sign
Table 5. Presence of Parenchymal Abnormalities in Three Groups as Depicted on CT Images
DS TB (n = 141) MDR TB (n = 42) XDR TB (n = 7) P values Meanings
Tree-in-bud signs 097 (69) 37 (88) 5 (71) < 0.046 DS < MDR
All nodules 131 (93) 41 (98) 6 (86) < 0.369
Small nodules 124 (88) 40 (95) 6 (86) < 0.380
Large nodules 071 (50) 30 (71) 6 (86) < 0.015 DS < MDR*
Consolidation 091 (65) 30 (71) 3 (43) < 0.319
GGO 035 (25) 07 (17) 0 (0)0< 0.191
Bronchial dilatation 026 (18) 23 (55) 3 (43) < 0.001 DS < MDR = XDR
Cavities 051 (36) 29 (69) 3 (43) < 0.001 DS < MDR*
Multiple cavities 021 (15) 17 (40) 2 (29) < 0.002 DS < MDR*
Pleural effusion 036 (26) 10 (24) 3 (43) < 0.561
Pleural thickening 016 (11) 04 (10) 3 (43) < 0.038 DS = MDR < XDR
Pericardial effusion 06 (4) 04 (10) 1 (14) < 0.271
Lymphadenopathy 046 (33) 06 (14) 2 (29) < 0.069
Note.─ *XDR TB as compared with MDR TB or XDR TB as compared with DS TB is not significant. Numbers in parentheses are percentages. DS TB =
drug-sensitive tuberculosis, MDR TB = multidrug-resistant tuberculosis, XDR TB = extensively drug-resistant tuberculosis, GGO = ground-glass opacity
extent 0.67 lobe) as compared to DS TB patients (18%,
mean extent 0.34 lobe) (p < 0.001). Tree-in-bud signs were
more commonly (p = 0.046) and extensively (p = 0.010)
involved in MDR TB patients (88%, mean extent 2.33
lobes) as compared to DS TB patients (69%, mean extent
1.55 lobes). Pleural thickening was more frequently
observed in XDR TB patients (43%) as compared to DS
TB (11%), and MDR TB (10%) patients. Except for the
pleural thickening, no significant differences were
determined for frequency and extent of parenchymal
abnormalities between MDR TB patients and XDR TB
patients with the use of CT.
DISCUSSION
In our study, as compared to involvement for MDR TB
patients, as seen on chest radiographs, large nodules and
GGO lesions were more frequently observed and showed
more extensive involvement. Multiple cavities were more
common in MDR TB and XDR TB patients as compared to
DS TB patients. With the use of CT, large nodules,
bronchial dilatation and multiple cavities were observed
more frequently in XDR and MDR TB patients as
compared to DS TB patients. In addition, the number of
cavities involved and the number of lobes containing small
nodules were higher in MDR TB patients as compared to
DS TB patients. Thus, for MDR TB or XDR TB patients as
compared to DS TB patients with the use of CT, parenchy-
mal lesions that were more extensive were seen. GGO
lesions were more frequently observed for DS TB patients
as compared to MDR TB or XDR TB patients as seen on
chest radiographs. However, for the use of CT, there was
no significant difference in the frequency of GGO lesions
among the three groups. Chest radiographs did not
accurately show disease processes (more frequent and
Radiological Findings of Extremely Drug-Resistant Pulmonary Tuberculosis in Non-AIDS Patients
Korean J Radiol 10(3), June 2009
213
AB
CD
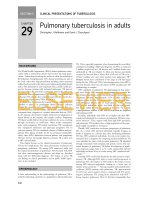
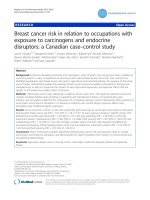
Fig. 3. Findings for drug-sensitive tuberculosis in 70-year-old man.
A. Posterior-anterior chest radiograph shows small nodular lesions (small arrows) in right upper lung zone and variable-sized nodules
and reticulo-nodular lesions (large arrows) in right lower lung zone.
B-D. Transverse CT (2.5-mm section thickness) scans obtained at levels of great vessels (B), aortic arch (C) and liver dome (D), respec-
tively, show small nodules (arrows), tree-in-bud signs (arrowheads) and nodules (curved arrow) in right upper lobe and right lower lobe.
extensive involvement of nodular lesions for MDR and
XDR TB patients) observed with the use of CT. These
findings were probably due to limited resolution and a
summation effect of overlapping lesions associated with
the use of chest radiography. The inferior capability of
chest radiography as compared to CT to distinguish
between MDR TB and DS TB has also been reported in
previous studies (18-20).
It has been reported that multiple cavities and bronchiec-
tasis are more frequently observed in MDR TB patients as
compared to DS TB patients (14, 21). Our results were
similar to previous results. Fishman et al. (18) have
reported that although the overall radiographic findings
and patterns of MDR TB patients and DS TB patients are
similar, there are significant differences among patients
depending on how MDR TB is acquired. Most patients with
primary drug resistance (in this study all of 33 patients
were HIV-positive and the mean CD4 count in these
patients was 108 cells/μL) showed a primary form of TB
with abnormalities such as noncavitary consolidation,
pleural effusion and lymphadenopathy. Cavitary disease
was more common in patients who acquired MDR TB
secondary to noncompliance with therapy (63% [17 of 27
patients] of the patients were HIV-positive, and the mean
CD4 count in these patients was 194 cells/μL). Cavitation
was less frequent in patients with MDR TB who were HIV-
positive and excessively immunocompromised as
compared to HIV-negative and immunocompetent
patients.
Our results differed from the findings reported by
Fishman and colleagues (18). In our study, all patients
were HIV-negative and had primary drug resistance.
However, cavities were more common and extensive in
XDR TB patients or MDR TB patients than in DS TB
patients. Moreover, nodules depicted on CT were the most
frequent lung abnormalities observed and had involvement
that was more extensive in XDR TB or MDR TB patients
than in DS TB patients. Thus, cavitary lesions and nodules
were the predominant CT patterns of lung abnormalities in
non-AIDS XDR and MDR TB patients. These observations
indirectly corroborate the findings of a previous report
where the most important determinant of radiologic
patterns of parenchymal abnormalities was patient
immunity (i.e., HIV sero-positivity and a decreased CD4
count < 200 cells/μL) rather than the drug-resistance
intensity of the organisms involved (22).
In South Korea, TB remains a major public health threat
and an economic burden. A national survey disclosed
35,269 new cases (73 of 100,000 population) in 2005 (23).
MDR TB strains occurred in 3% of new cases and in 14%
of previously treated cases (24) and approximately 5-20%
of MDR TB patients were confirmed as having XDR TB
(5-11, 13). In our institution, we saw 366 patients with
MDR TB over 13 years, and of these 366 patients, 52
(14%) were confirmed as having XDR TB infections.
Drug resistance can develop during inadequate anti-
tuberculous chemotherapy that enables selection of drug-
resistant organisms (acquired resistance). Radiological
findings might show inadvertently progressed features with
an ongoing infection (chronic TB infection) during the
development of acquired resistance. Thus, we have
included only patients who had a primary resistant form of
Cha et al.
214
Korean J Radiol 10(3), June 2009
Table 6. Extent of Parenchymal Abnormalities and Number of Cavities in Three Groups as Depicted on CT Images
DS TB (n = 141) MDR TB (n = 42) XDR TB (n = 7) P values Meanings
Tree-in-bud signs 1.55 1.53 2.33 1.71 1.00 1.00 < 0.010 DS = XDR < MDR
(1, 0.13, 0-6) (2, 0.26, 0-6) (1, 0.38, 0-3)
Small nodules 2.21
1.58 2.88 1.70 1.86 1.57 < 0.049 DS < MDR*
(2, 0.13, 0-6) (3, 0.26, 0-6) (1, 0.60, 0-4)
Large nodules 0.83
1.04 1.19 1.13 1.00 0.58 < 0.069
(1, 0.09, 0-5) (1, 0.18, 0-5) (1, 0.22, 0-2)
Consolidation 1.13
1.15 1.17 1.03 0.71 1.11 < 0.453
(1, 0.10, 0-5) (1, 0.16, 0-3) (0, 0.42, 0-3)
GGO 0.57
1.29 0.21 0.57 0.00 0.00 < 0.153
(0, 0.11, 0-6) (0, 0.09, 0-3) (0, 0, 0)
Bronchial dilatation 0.34
0.84 0.67 0.72 0.43 0.54 < 0.001 DS < MDR*
(0, 0.07, 0-4) (1, 0.11, 0-3) (0, 0.20, 0-1)
Number of cavities 1.38
5.99 2.45 4.87 4.86 11.14 < 0.001 DS < MDR*
(0, 0.50, 0-50) (1, 0.75, 0-30) (0, 4.21, 0-30)
Note.─ *XDR TB as compared with MDR TB or XDR TB as compared with DS TB is not significant. Numbers represent mean standard deviation of
involved lobes. Numbers in parentheses are median, standard error and range. DS TB = drug-sensitive tuberculosis, MDR TB = multidrug-resistant
tuberculosis, XDR TB = extensively drug-resistant tuberculosis, GGO = ground-glass opacity
MDR TB (who had received no or less than one month of
anti-TB treatment) and XDR TB patients (who had
received no or less than one month of anti-TB treatment or
received only first-line anti-TB drugs).
In our study, there was no difference in imaging findings
in terms of frequency and extent of each parenchymal
abnormality between XDR TB patients and MDR TB
patients except for pleural thickening. Therefore, it does
not seem to be possible to differentiate between MDR TB
and XDR TB based on imaging findings alone. The clinical
significance of the difference in the frequency of pleural
thickening was not clear. For DS TB and MDR TB, the
frequency of pleural thickening was not different (11%
versus 10%). For XDR TB patients, the frequency was
43% (in three of seven patients). The small number of
XDR TB patients might has been one of factors for such a
difference, but a further study with more cases is required.
Age was significantly different among the three groups.
Patients with DS TB (mean age, 51 years) were older than
patients with MDR TB (mean age, 38 years) or XDR TB
(mean age, 35 years). We do not know the precise cause of
this difference. One possible reason may be the year in
which effective anti-TB drug therapies (such as rifampin
therapy) were started. In South Korea, rifampin-based
regimens were given first in the private sector during the
1980s, and the current 6-month, four-drug (including
rifampin) regimen became standard in the national
tuberculosis plan in 1990. Elderly patients likely acquired
the organisms in the past when the circulating bacilli were
susceptible to the current regimen, whereas young patients
likely acquired the bacilli more recently, when the bacilli
were more likely to be resistant. Other related factors
(drug resistance in young adults) may be due to decreased
patient immunity caused by the declining BCG effect (most
older people in South Korea received BCG vaccinations)
and an unhealthy lifestyle (lack of exercise and sudden
excessive weight loss to maintain a thin body habitus) in
young adults.
This study has several limitations. First, as our study was
retrospective in design, not all patients underwent both
chest radiography and CT. Moreover, patients were
selected over a long period and the times of selection for
the three groups were different. Although we selected
patients over a long period, we still found only a small
number of patients with XDR TB. Thus, the difference in
imaging findings among DS TB, MDR TB, and XDR TB
patients might be underestimated. However, the number
of XDR TB cases in non-AIDS patients is extremely small.
Second, selection bias may also have existed in our study.
As our institution is a tertiary referral hospital, patients
with more grave symptoms or cases that were more
complicated might have been selectively included. Third,
the exact time between symptom onset and an imaging
study in our study could have not been provided owing to
a long period of patient selection and the retrospective
design. Instead, we were aware of interval between
sputum acid-fast bacilli (AFB) isolation and the imaging
studies. Imaging findings of pulmonary tuberculosis may
depend on the chronicity or disease-ongoing period. A
further study on imaging findings of XDR TB in considera-
tion of chronicity of the disease needs to be performed.
In conclusion, MDR and XDR pulmonary TB in non-
AIDS patients is characterized with the use of CT by more
extensive parenchymal lesions of the post-primary form of
TB containing multiple cavities than DS tuberculosis and is
more frequently observed in young patients. Thus, when
young non-AIDS patients have culture-positive AFB and
show multiple cavities, nodules and bronchial dilatation as
depicted on CT, the presence of MDR or XDR TB infection
should be considered. The disease pattern and extent of
MDR and XDR TB are similar.
Appendix
The sample size of the control group (DS TB patients)
was determined based on the use of formulas described by
Fleiss et al. (16) for unequal sample size analysis.
According to previous studies about the comparison of
radiological findings among MDR, XDR and DS TB
patients (5, 14), the most significantly different radiological
finding was multiple cavitation, which was predicted to be
0.15 for DS TB, 0.6 for MDR TB and 0.6 for XDR TB. The
estimated total patient number determined by use of the
chi-squared test for multiple proportions was 203 by using
a power of 0.90, alpha of 0.05 and the above proportional
settings. From the given patient number for MDR TB and
XDR TB of 68, we determined that the minimum required
sample size for DS TB patients was 135.
References
1. Extensively drug-resistant tuberculosis (XDR-TB): recommenda-
tions for prevention and control. Wkly Epidemiol Rec
2006;81:430-432
2. Gandhi NR, Moll A, Sturm AW, Pawinski R, Govender T,
Lalloo U, et al. Extensively drug-resistant tuberculosis as a cause
of death in patients co-infected with tuberculosis and HIV in a
rural area of South Africa. Lancet 2006;368:1575-1580
3. Centers for Disease Control and Prevention (CDC). Emergence
of Mycobacterium tuberculosis with extensive resistance to
second-line drugs—worldwide, 2000-2004. MMWR Morb
Mortal Wkly Rep 2006;55:301-305
4. Raviglione MC, Smith IM. XDR tuberculosis—implications for
global public health. N Engl J Med 2007;356:656-659
5. Kim HR, Hwang SS, Kim HJ, Lee SM, Yoo CG, Kim YW, et al.
Impact of extensive drug resistance on treatment outcomes in
non-HIV-infected patients with multidrug-resistant tuberculosis.
Radiological Findings of Extremely Drug-Resistant Pulmonary Tuberculosis in Non-AIDS Patients
Korean J Radiol 10(3), June 2009
215
Clin Infect Dis 2007;45:1290-1295
6. Migliori GB, Besozzi G, Girardi E, Kliiman K, Lange C,
Toungoussova OS, et al. Clinical and operational value of the
extensively drug-resistant tuberculosis definition. Eur Respir J
2007;30:623-626
7. Kwon YS, Kim YH, Suh GY, Chung MP, Kim H, Kwon OJ, et
al. Treatment outcomes for HIV-uninfected patients with
multidrug-resistant and extensively drug-resistant tuberculosis.
Clin Infect Dis 208;47:496-502
8. Mitnick CD, Shin SS, Seung KJ, Rich ML, Atwood SS, Furin JJ,
et al. Comprehensive treatment of extensively drug-resistant
tuberculosis. N Engl J Med 2008;359:563-574
9. Keshavjee S, Gelmanova IY, Farmer PE, Mishustin SP, Strelis
AK, Andreev YG, et al. Treatment of extensively drug-resistant
tuberculosis in Tomsk, Russia: a retrospective cohort study.
Lancet 2008;372:1403-1409
10. Kim DH, Kim HJ, Park SK, Kong SJ, Kim YS, Kim TH, et al.
Treatment outcomes and long-term survival in patients with
extensively drug-resistant tuberculosis. Am J Respir Crit Care
Med 2008;178:1075-1082
11. Shah NS, Pratt R, Armstrong L, Robinson V, Castro KG,
Cegielski JP. Extensively drug-resistant tuberculosis in the
United States, 1993-2007. JAMA 2008;300:2153-2160
12. Choi JC, Lim SY, Suh GY, Chung MP, Kim H, Kwon OJ, et al.
Drug resistance rates of Mycobacterium tuberculosis at a private
referral center in Korea. J Korean Med Sci 2007;22:677-681
13. Jeon CY, Hwang SH, Min JH, Prevots DR, Goldfeder LC, Lee
H, et al. Extensively drug-resistant tuberculosis in South Korea:
risk factors and treatment outcomes among patients at a tertiary
referral hospital. Clin Infect Dis 2008;46:42-49
14. Chung MJ, Lee KS, Koh WJ, Kim TS, Kang EY, Kim SM, et al.
Drug-sensitive tuberculosis, multidrug-resistant tuberculosis, and
nontuberculous mycobacterial pulmonary disease in nonAIDS
adults: comparisons of thin-section CT findings. Eur Radiol
2006;16:1934-1941
15. Eng J. Sample size estimation: how many individuals should be
studied? Radiology 2003;227:309-313
16. Fleiss JL. Statistical methods for rates and proportions. New
York, NY: Wiley 1981:45
17. Hansell DM, Bankier AA, MacMahon H, McLoud TC, Muller
NL, Remy J. Fleischner Society: glossary of terms for thoracic
imaging. Radiology 2008;246:697-722
18. Fishman JE, Sais GJ, Schwartz DS, Otten J. Radiographic
findings and patterns in multidrug-resistant tuberculosis. J
Thorac Imaging 1998;13:65-71
19. Greenberg SD, Frager D, Suster B, Walker S, Stavropoulos C,
Rothpearl A. Active pulmonary tuberculosis in patients with
AIDS: spectrum of radiographic findings (including a normal
appearance). Radiology 1994;193:115-119
20. Lessnau KD, Gorla M, Talavera W. Radiographic findings in
HIV-positive patients with sensitive and resistant tuberculosis.
Chest 1994;106:687-689
21. Kim HC, Goo JM, Lee HJ, Park SH, Park CM, Kim TJ, et al.
Multidrug-resistant tuberculosis versus drug-sensitive tuberculo-
sis in human immunodeficiency virus-negative patients:
computed tomography features. J Comput Assist Tomogr
2004;28:366-371
22. Geng E, Kreiswirth B, Burzynski J, Schluger NW. Clinical and
radiographic correlates of primary and reactivation tuberculosis:
a molecular epidemiology study. JAMA 2005;293:2740-2745
23. Korean Center for Disease Control and Prevention. Annual
report on the notified tuberculosis patients in Korea (2005.1-
2005.12). 2006
24. Bai GH, Park YK, Choi YW, Bai JI, Kim HJ, Chang CL, et al.
Trend of anti-tuberculosis drug resistance in Korea, 1994-2004.
Int J Tuberc Lung Dis 2007;11:571-576
Cha et al.
216
Korean J Radiol 10(3), June 2009