Sensibility study of flooding and drying issues to the operating conditions in PEM fuel cells
Bạn đang xem bản rút gọn của tài liệu. Xem và tải ngay bản đầy đủ của tài liệu tại đây (687.17 KB, 20 trang )
INTERNATIONAL JOURNAL OF
ENERGY AND ENVIRONMENT
Volume 1, Issue 1, 2010 pp.1-20
Journal homepage: www.IJEE.IEEFoundation.org
Sensibility study of flooding and drying issues to the
operating conditions in PEM fuel cells
F. Brèque1, J. Ramousse2, Y. Dubé1, K. Agbossou1, P. Adzakpa1
1
Hydrogen Research Institute, Université du Québec à Trois-Rivières, 3351 boulevard des Forges, C.P.
500, Trois-Rivières (Québec), G9A 5H7, Canada.
2
LOCIE - Université de Savoie, Campus scientifique - Savoie Technolac, 73376 Le Bourget du Lac –
CEDEX, France.
Abstract
Due to water management issues, operating conditions need to be carefully chosen in order to properly
operate fuel cells. Because of the gas consumption along the feeding channels and water production at
the cathode, internal cell humidification is highly inhomogeneous. Consequently, operating fuel cells are
very often close to critical operating conditions, such as flooding and drying, at least locally. Based on
this observation, the critical current, corresponding to internal cell humidification balance (acurate
membrane hydration, without excess of water at the electrodes), is deduced from a pseudo-2D model of
mass transfer in the cell. Using the model, a parametric sensibility study of the operating conditions is
presented to analyze the cell internal humidification. Dead-end and flow-through modes of hydrogen
supply are also compared.
It is shown that the operating temperature is a key parameter to manage the cell humidification.
Moreover, although the oxygen stoichiometric ratio has an effect on cell humidification, this influence is
limited and cannot be used alone to adjust the cell humidification. Furthermore, it is shown that in some
cases, humidifying the anode inlet gas is of little interest to the internal humidification adjustment.
Finally, those results allow to understand the role that each operating parameter can play on the cell
internal humidification. Consequently, this study is of a great interest to water management improvement
in polymer electrolyte membrane fuel cells.
Copyright © 2010 International Energy and Environment Foundation - All rights reserved.
Keywords: Hydrogen supply modes, Modeling, Parametric sensibility study, Polymer electrolyte
membrane fuel cell, Water management.
1. Introduction
Among possible alternatives to global warming and energy resource depletion problems, polymer
electrolyte membrane fuel cells (PEMFC) appear as promising energy conversion devices using
hydrogen as energy vector. They are environmentally friendly and more efficient than standard
combustion engines [1]. In order to achieve high performances, water management in PEMFCs is one of
the main critical issues to address: lack of water in the membrane can lead to an important increase of
membrane resistance and thus to a decrease of the cell potential, while an excess of liquid water in the
electrodes can reduce gas transport to the catalyst layers and, again, decrease the cell voltage. The lack of
ISSN 2076-2895 (Print), ISSN 2076-2909 (Online) ©2010 International Energy & Environment Foundation. All rights reserved.
2
International Journal of Energy and Environment (IJEE), Volume 1, Issue 1, 2010, pp.1-20
humidification (drying) and excess of humidification (flooding) are thus harmful to the performances of
the PEMFC [2]. Accurate water content is therefore required in the cell.
In this context, numerical models combined with experimentation can help to understand the
mechanisms involved in the cell operation, and thus can lead to water management improvement. The
bases of the PEMFC modeling have been set in the early 90’s: 1D isothermal and steady state models of
PEMFCs were developed [3, 4]. Later, the channel dimension and primary temperature effects were
added to the models [5-7] in order to describe the non-homogeneous distribution of the species and
temperature in the cell. The main mechanisms driving the cell performances were thus pointed out.
Using models, the main influences of the operating parameters on gaseous species and liquid water
distributions were studied [8, 9]. These authors highlighted the decrease of performances caused by
liquid water accumulation along the channels. In parallel to those numerical results, experimental studies
were also conducted. The effect of the cell internal humidification on the cell voltage was experimentally
pointed out [11, 15] and the local water accumulation in a cell was observed using neutron imaging
procedure [10, 12]. Finally, all these numerical and experimental studies confirm that liquid water has
major effects on fuel cell performances. According to this observation, it is needed to predict the
influences of the operating conditions on the internal cell humidification as well as on the cell
performances.
In this way, the threshold current density corresponding to the onset of two-phase operating regimes have
already been derived thanks to simple analytical expressions [12, 14] or more detailed models [16, 17].
Even though influences of some operating parameters on the internal cell humidification have been
analyzed, no comprehensive studies on the effect of all the operating parameters on the cell performances
have been presented. Moreover, no information in terms of appropriate operating parameters (acurate
membrane hydration without water excess in the electrodes) are given, though such information is the
most important aspect when studying water management in fuel cells. Consequently, information given
by those models is not sufficient to develop a water management strategy. Moreover, to our knowledge,
no comparison between the different modes of hydrogen supply (dead-end or flow-through) has been
conducted. Few experimental studies were also conducted on the influence of operating parameters [18]
but more numerical work is needed in order to improve water management strategies.
For that purpose, a complete sensibility analysis of the internal humidification is presented in this paper.
This study is based on a dynamic pseudo-2D model of mass transfer in a polymer electrolyte membrane
fuel cell. This model describes multi-component gas transport in the electrodes and water transport in the
membrane. As a result, the effects of operating conditions on liquid water appearance in the cell and on
the related cell performances are discussed and analyzed in detail. These operating conditions include
relative humidities, temperatures, pressures and stoichiometric ratios at both electrodes, as well as the
modes of hydrogen supply (flow-through or dead-end). Hence, for any given operating condition, the
critical operating current leading to a well-hydrated membrane without water excess in the electrodes is
computed.
Because the model applies for a specific fuel cell, the results are based on given fuel cell features like
geometry. Therefore, the critical operating current presented here refers of course to the modeled fuel
cell and is not necessarily the same for other fuel cells. However, the method and the tendencies of the
results presented are more general. Based on this model, the role that each operating parameters can play
in order to manage the internal cell humidification is pointed out. According to these results, a control
strategy will next be developed to operate any modeled cell at the best humidification conditions.
2. Numerical modeling
2.1 Mathematical problem statement
The modeled single fuel cell is represented schematically in Figure 1. The input gases, hydrogen at the
anode and oxygen at the cathode, flow in channels in the z-direction. Both flows reach the catalyst layers
(CL) by transport through the two GDLs (x-direction). There, reactants are consumed and water is
produced at the cathode side. The water flowing in the membrane is absorbed on one side and desorbed
on the other.
The following transport phenomena are taken into account. First, the motion of the gas molecules can be
either by bulk transport, by convection, and/or by diffusion. Second, the gases fed in are not pure, but
contain nitrogen (in the air), water and trace concentrations of other gases (CO, nitrogen compounds etc.)
whose effects have to be taken into account. Third, the motion of the water molecules inside the
membrane is also affected by electro-osmotic drag, which corresponds to the water transport relating to
ISSN 2076-2895 (Print), ISSN 2076-2909 (Online) ©2010 International Energy & Environment Foundation. All rights reserved.
International Journal of Energy and Environment (IJEE), Volume 1, Issue 1, 2010, pp.1-20
3
the proton transport from the anode to the cathode, and which acts in addition to the usual convection and
diffusion. And fourth, from a practical point of view, the hydrogen supply can be either flow-through or
dead-end (the air supply is always flow-through).
Figure 1. Schematic of mass transfer phenomena in PEM fuel cells
The main assumptions considered in the model are as follows [19]:
• The model is a pseudo 2D model. The model computes species flow in the channel direction, but
current density in the z-direction is assumed constant. Water fluxes at the membrane interfaces
are also assumed to be constant in the z-direction.
• The cell temperature remains uniform in the cell [20].
• The total pressures remain uniform in both GDLs [20].
• Species are considered in gas phase only (no liquid water) in the gas channels and in the GDLs.
2-phase water transport in the electrodes will be introduced in future work. The gas phase is
treated as an ideal mixture.
• The cathode CL is integrated in the membrane to model water production while the anode CL is
assumed to be infinitely thin as explained in [21].
• Gas crossover in the membrane is neglected.
2.2 Membrane water transport (x-direction)
Water transport in the membrane is modeled with the governing equations proposed by Springer et al. [4]
and used by Fournier et al. [19]. Water concentration in the membrane and in the cathode CL follows the
continuity equation (1).
⎧ 0 in th e m em b ran e
∂C w ∂N w
+
= ⎨
∂t
∂x
⎩ R w in th e cath o d e catalyst layer
(1)
where C w is the water concentration (mol.m-3), t is time (s), Nw is the water molar flux (mol.m².s-1) and x
the abscissa (m) and Rw the molar water production rate (mol.m-3.s-1).
The water concentration C w is related to the water content λ ( mol H 2O / mol SO − ) by equation (2) ( λ is
3
the ratio between the water moles and the sulfate sites moles in the membrane):
λ=
EW
Cw
ρm
(2)
ISSN 2076-2895 (Print), ISSN 2076-2909 (Online) ©2010 International Energy & Environment Foundation. All rights reserved.
International Journal of Energy and Environment (IJEE), Volume 1, Issue 1, 2010, pp.1-20
4
−1
where EW and ρ m are respectively the equivalent weight of the membrane ( kg ⋅ mol SO − ) and the density
3
of the dry membrane (kg⋅m-3).
The molar water production rate (assumed uniform in the CL thickness) in the catalyst layer Rw is given
according to Faraday’s law:
Rw =
i
2L F
(3)
int
where i is the current density (A⋅m-2), Lint is the cathode catalyst layer thickness (m) and F is the
Faraday’s constant (F=96485 C.mol-1)
Water transport across the membrane is driven by three phenomena: diffusion [4], electro-osmotic drag
[4] and bulk motion [22]. Therefore the water flux across the membrane N w is given by equation (4):
N w = − Dw
∂Cw
i
+ η d + Cw v
∂x
F
(4)
where Dw is the water diffusivity in the membrane (m2⋅s-1), ηd is the electro-osmotic drag coefficient (-)
and v is the total velocity (m.s-1).
In equation (4), the first term describes the diffusion in which Dw the water diffusivity in the membrane,
is based on [4]:
⎡
⎛ 1
1
Dw = Dλ exp ⎢ 2416 ⎜
−
⎜ 303 T
⎢
op
⎝
⎣
⎞⎤
⎟⎥
⎟⎥
⎠⎦
(5)
where Top is the cell operating temperature (K) and Dλ (m2⋅s-1) depends on λ as follow:
⎧1.03125 ×10⁻¹¹ λ
if
⎪
Dλ = ⎨1.744 ×10⁻¹¹ λ − 2.14 × 10⁻¹¹
if
⎪5.766 ×10⁻¹² λ + 4.8656 ×10⁻¹¹
if
⎩
λ≤3
3< λ ≤6
λ>6
(6)
The second term in equation (4) is the electro-osmotic drag and is proportional to the current density with
a water content dependant coefficient [4]:
2.5
(7)
ηd =
λ
22
The last term in equation (4) refers to the bulk motion, usually called convection. The velocity v is
computed via Darcy’s law with a linearity assumption on the total pressure in the membrane:
v=−
K ∂P K ⎛ Pan − Pcat ⎞
= ⎜
⎟
µ ∂x µ ⎝ Lm ⎠
(8)
where K is the membrane permeability (m2), µ is the water viscosity (kg⋅m-1⋅s-1), P is the pressure (Pa)
denoted Pan at the anode and Pcath at the cathode, and Lm is the membrane thickness (m).
The boundary conditions for (1) are the water content at both membrane/GDL interfaces. These water
contents are computed from the water pressure at the membrane/GDL interface via the sorption isotherm
[4]. The sorption isotherm represents the balance between the water activity A (-) in the gas and the
membrane water content λ at the membrane/GDL interface:
(9)
λ = 0.043 + 17.81 A − 39.85 A2 + 36.0 A3 for 0 < A ≤ 1
where
ISSN 2076-2895 (Print), ISSN 2076-2909 (Online) ©2010 International Energy & Environment Foundation. All rights reserved.
International Journal of Energy and Environment (IJEE), Volume 1, Issue 1, 2010, pp.1-20
A=
int
Pw
Psat (Top )
5
(10)
with Pwint is the water pressure at the membrane/cathode interface (Pa) and Psat the vapor saturation
pressure (Pa) is given by (11) in [4]:
3
2
P
(11)
log10 sat = 1.4454 ×10⁻⁷ (Top − 273.15) − 9.1837 ×10⁻⁵ (Top − 273.15) + 0.02953(Top − 273.15) − 2.1794
P
0
where P0 is the reference pressure (1 atm).
2.3 GDL transport model (x-direction)
Gaseous species involved are respectively H 2 , H 2Ovap and CO at the anode and O2 , H 2Ovap and N 2 at
the cathode. Their distribution in the GDLs are computed with the species conservation [13] in a onephase flow:
⎞ ∂
⎞
∂ ⎛ Ptot
∂ ⎛ P
eff ∂
ε yi ⎟ + ( yi Ntot ) = − ⎜ − tot Dim
( yi ) ⎟
⎜
⎜
⎟
⎜
⎟
∂t ⎝ R Top
∂x ⎝ R Top
∂x
⎠ ∂x
⎠
(12)
where R is the universal gas constant (R=8.314 J⋅mol-1⋅K-1), ε is the GDL porosity (-) and yi the molar
fraction of species i (-) defined by (13):
P
(13)
yi = i
Ptot
The term yi N tot , where N tot = ∑ N i , refers to the bulk motion. The right part of equation (12)
eff
corresponds to the diffusion. The effective gas diffusivity of species i in the mixture m Dim (m2⋅s-1) is
given by:
eff
Dim =
eff
eff
Pj Dij + Pk Dik
(14)
Pj + Pk
where j and k are the two other species of the gas mixture. Effective diffusivity refers to the diffusivity in
a porous medium. In the case of a random fibrous porous medium, Nam and Kaviany [23] derived the
effective diffusivity as follow.
eff
ij
D
⎛ ε −εp
= Dij ε ⎜
⎜ 1− ε
p
⎝
⎞
⎟
⎟
⎠
α
(15)
where ε p = 0.11 and α = 0.785 .
The binary gas diffusivity of the species i within j Dij is computed similarly as proposed by Bird et al.
[24].
Fluxes at the membrane/GDL interfaces are boundary conditions for (12). Except for water, these fluxes
are computed according to Faraday’s law:
i
i
(16)
NH = , NO = − , NN = NCO = 0
2
2F
2
4F
2
N H 2O is given as an output of the membrane sub-module.
The other boundary conditions for equation (12) are the molar fractions at the GDL/gas channel interface
yiGDL / ch . They are computed according to equation (17):
Ni = − hm
Ptot
( yich − yiGDL / ch ) + yi Ntot
RTop
(17)
ISSN 2076-2895 (Print), ISSN 2076-2909 (Online) ©2010 International Energy & Environment Foundation. All rights reserved.
International Journal of Energy and Environment (IJEE), Volume 1, Issue 1, 2010, pp.1-20
6
where hm is the mass transfer convection coefficient (m⋅s-1) which is fixed using the Sherwood number
[25].
This equation expresses, in steady state, the mass transport between the bulk molar fraction in the
channel yich and the molar fraction at the GDL/channel interfaces. The last term in equation (17)
corresponds to the bulk motion of the mixture. The molar fraction yi is either yiGDL / ch or yich depending
on the direction of the bulk motion.
2.4 Channel transport model (z-direction)
Whereas air is supplied in flow-through mode only, hydrogen can be supplied in flow-through mode or
in dead-end mode. To describe gas transport in each mode, two models are developed.
2.4.1 Flow-through mode
For each species, the molar balance for a slice ∂z in the channel is derived as:
∂Qi
A
= Ni m
∂z
Lch
(18)
where the molar flux in the x-direction N i is assumed to be uniform along the z-direction. The molar
flows in the z-direction Qi (mol⋅s-1) are as follow:
Qi =
Pi ch
vtot Ach
R Top
(19)
In (19), the velocity of the total gas mixture in the channel vtot (m.s-1) is computed in each slice using the
relationship (20).
P
(20)
Qtot = tot vtot Ach
R Top
where Ach is the channel area (m2) and Ptot the total pressure in the slice ∂z , based on the total pressure
drop in the channel. The total pressure drop is given by equation (21) [26]:
(21)
∆Ptot = k1 Qtot − k2
where Qtot is the total molar flow (mol⋅s-1); the constants k1 and k 2 are determined experimentally:
k1 = 4.09 10 −3 atm ⋅ s ⋅ mol −1 and k 2 = 6.75 10 −4 atm . The decreasing total pressure along the channel
direction is then assumed to be linear.
Using (18) to (21), the profiles of the partial pressures in the gas channel Pi ch are computed along the zdirection.
2.4.2 Dead-end mode
In addition to the previous approach corresponding to flow-through mode, hydrogen can be supplied in
dead-end mode. In this mode, no pressure variation is assumed along the channel (z-direction). However,
gas species accumulation (transient regime) is taken into account using the following molar balance in
the anode channel volume:
P ∂yi
(22)
Vch tot
= Qiin − N i Am
RTop ∂t
where Vch is the channel volume (m3). In both flow-through and dead-end modes, the boundary
conditions of the channel transport model are the fluxes exchanged between the channel and the GDLs as
in
well as the channel inlet conditions ( SR in , RH in , Ptot , y in ) which give Qiin and yiin .
ISSN 2076-2895 (Print), ISSN 2076-2909 (Online) ©2010 International Energy & Environment Foundation. All rights reserved.
International Journal of Energy and Environment (IJEE), Volume 1, Issue 1, 2010, pp.1-20
7
2.5 Simulation conditions
The coupled equations described above are solved numerically by a finite difference method with
implicit scheme and coded in C programming language. The model is run in the Matlab-Simulink
environment to solve the algebraic loops. For all the results shown hereafter, in addition to the individual
parameters analyzed in each paragraph, the reference operating conditions used are given in Table 1.
Relevant parameters describing the modeled fuel cell are listed in Table 2.
Table 1. Reference operating conditions
Parameter
Symbol Units
Anode inlet gas pressure
in
Pan
kPa
Value in H2 Value in H2 flowdead-end mode through mode
101.325
101.325
Cathode inlet gas pressure
in
Pcat
kPa
101.325
101.325
Anode inlet relative humidity
in
RH an
-
0
0.5
Cathode inlet relative humidity
in
RH cat
SRH 2
-
0.5
0.5
-
1
2
Hydrogen stoichiometric ratio
Oxygen stoichiometric ratio
SRO2
-
2
2
Hydrogen inlet moalr fraction
in
yH 2
-
1
1
Oxygen inlet moalr fraction
in
yO2
-
0.21
0.21
Cell operating temperature
Top
K
333.15
333.15
Table 2. Model parameters
Parameter
Membrane active area
Symbol Units
m²
Am
Membrane thickness
Lm
LGDL
GDL thickness
Value
78 10-4
m
37 10-6
m
280 10-6
0.5
1.4 10-6
GDL porosity
Anode channels cross section area
ε
Ach , an
m²
Cathode channels cross section area
Ach ,cat
m²
1.344 10-6
Anode channels length
m
1.158
Molecular weight of dry membrane
Lch ,an
EW
Density of dry membrane
ρm
kg.m
Membrane permeability
Water viscosity
K
m²
Mass transfer coefficient between
GDL and gas channel in the anode
Mass transfer coefficient between
GDL and gas channel in the cathode
hm ,an
kg.m −1.s −1
m.s −1
hm ,cat
m.s −1
−1
kg.molSO− - 0.9
3
µ
−3
2800
1.58 10-18
4.71 10-4
1.2
0.09
3. Results and discussion
3.1 Liquid water appearance and critical current
Since the most critical constraint on power cell operation comes from the presence of water, the
conditions under which liquid water appears in the cell were investigated. This section presents these
results and shows how to relate liquid water appearance to ideal operating conditions.
ISSN 2076-2895 (Print), ISSN 2076-2909 (Online) ©2010 International Energy & Environment Foundation. All rights reserved.
8
International Journal of Energy and Environment (IJEE), Volume 1, Issue 1, 2010, pp.1-20
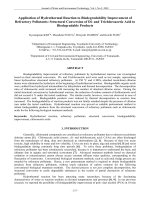
3.1.1 Liquid water appearance locations in the literature
Existing models described in the literature implicitly consider different locations in the cell to study the
appearance of liquid water. In order to open the discussion on those locations, a schematic trend of the
water vapor pressure at the cathode is presented in Figure 2. This discussion is focused on the cathode
because this electrode contains much more water than the anode [10] due to the water production at the
cathode and to the electro-osmotic drag always oriented from the anode to the cathode.
Figure 2. (a) Cathode geometrical scheme and, (b) schematic progression of the vapor pressure at the
cathode
The channel inlet gas is at point A with a given vapor partial pressure. By progressing through the
channel to the outlet point B, water vapor content in the gas increases due to water production at the
cathode. In addition, the water content increases from the channel to the catalyst layer because of the
diffusion gradient.
To find out the conditions which lead to the appearance of liquid water, a first approach is to look at the
gas flow in the cathode channel [11]. The outlet water vapor partial pressure in the gas can be computed
via a mass balance between the inlet and outlet vapor pressures in the channel. The difference between
the inlet and the outlet water vapor pressure is here due to the flux in the x-direction (mainly related to
the water production). Based on this computation, the necessary conditions for liquid water appearance
are obtained. The analysis implicitly focuses on point B because only the progression along the channel
is taken into account.
Karnik et al. [27] deal with liquid water appearance using a two-lumped-volumes approach –
corresponding to the two electrode volumes – to model the cell. In those two volumes, bulk conditions
are computed through mass balance. Accordingly, assuming linear progression through the channel, the
bulk conditions in both volumes correspond to the conditions at the center of the cell along the cell
channel. Hence, with this kind of model, it is point E which is implicitly considered for the liquid water
appearance analysis.
In both of the above approaches, water distribution in the cell x-thickness is neglected. But 1D models
along the cell thickness are sometimes used to determine liquid water appearance in the cell [14]. In this
type of model, the channel inlet conditions are assumed to be the boundary conditions. Point D is
therefore implicitly considered for the liquid water appearance. Indeed, in this case, it is assumed that the
water concentration gradient along the gas channel is negligible (high stoichiometric ratio).
Finally, the first droplet of liquid water in the whole cell would obviously appear at point C, in the
catalyst layer and close to the channel outlet where the vapor pressure is the highest [17]. Wang et al.
[13] established the boundary between one-phase and two-phase flows through a 2D model by
computing the liquid water appearance at this point C.
This overview highlights the different locations when dealing with liquid water appearance in the cell.
The models used are often too simple to allow a complete analysis of operating parameters. Moreover, in
ISSN 2076-2895 (Print), ISSN 2076-2909 (Online) ©2010 International Energy & Environment Foundation. All rights reserved.
International Journal of Energy and Environment (IJEE), Volume 1, Issue 1, 2010, pp.1-20
9
these studies, no results are analyzed in term of internal water cell management leading to acurate
membrane hydration without excess water in the electrodes. The present model allows to analyze liquid
water appearance in any location throughout the cell. Thus, the two next sections (sections 3.1.2 and
3.1.3) focus on finding a pertinent location allowing to interpret the appearance of liquid water in terms
of an ideal operating point.
3.1.2 Onset of two-phase regime in the electrodes
As mentioned in section 3.1.1, water first appears at the catalyst layer close to the channel’s outlet (point
C in Figure 2). The present model therefore computes the threshold current density corresponding to the
first appearance of liquid water at point C for different oxygen stoichiometric ratios SRO2 and
temperatures Top (Figure 3). Water production is obviously directly related to the current density: the
higher the current, the more water has to be removed from the cell. As long as the vapor pressure is
below the saturation pressure, water is present in the gaseous phase only. On the other hand, when the
saturation pressure is reached, water condenses in the cell and both phases are present. It therefore exists
a threshold current which triggers the development of two-phase flows [13].
Figure 3. Threshold current for the first liquid droplet appearance in the cell
Figure 3 shows how the threshold current increases versus the oxygen stoichiometric ratio, for three
operating cell temperatures (Top). The results show a strong dependence of this threshold current on
temperature because of the strong dependence of the saturation pressure on temperature (as described in
equation (11)). Similar results were obtained in [13] and [11]. With the help of Figure 3, for a given
current and temperature, the minimum stoichiometric ratio necessary to avoid liquid water in the whole
cell can be known. For example, in order to keep the cell without liquid water at 60°C and for
intermediate currents (around 0.5 A.cm-2), it is sufficient to hold the oxygen stoichiometric ratio at a
minimum of 5. For high currents (around 1 A.cm-2), the stoichiometric ratio has to be increased up to 10
in order to avoid water condensation. This threshold stoichiometric ratio is also strongly temperature
dependent: for 55°C, the ratio increases up to 17, whereas for 65°C, a ratio of 5 is enough (still at high
currents).
This analysis leads to the conclusion that, in general cases where the oxygen stoichiometric ratio is
between 2 and 3, liquid water will exist in the cell for intermediate and high currents. However, the
presence of liquid water is not intrinsically damageable to the cell. Flooding, where the liquid water
produces dramatic voltage degradation, appears only once there is a certain amount of liquid water in the
cell, and not just as soon as the first droplet appears [12]. In addition, reasonable amounts of liquid water
can have good effects on the cell voltage by decreasing the membrane resistance [15]. Therefore, the first
appearance of water droplets at the catalyst layer close to the channel outlet (point C on Figure 2) does
not correspond to a critical operating point. Hence, as it will be explained in the next section, it is
desirable to analyzed other locations in order to signal the threshold for liquid water appearance.
ISSN 2076-2895 (Print), ISSN 2076-2909 (Online) ©2010 International Energy & Environment Foundation. All rights reserved.
10
International Journal of Energy and Environment (IJEE), Volume 1, Issue 1, 2010, pp.1-20
3.1.3 Critical operating current
Because the onset of the two-phase regime in the whole cell is not a critical aspect for the cell operation,
it is useful to develop another approach where liquid water appearance could be analyzed in terms of
ideal operating conditions.
As explained in earlier sections, accurate water content is required to decrease the membrane resistance,
but excess water in the GDL is harmful for mass transport. The influence of the internal cell
humidification on the cell performances can be examined through the current density progression along
the channel (z-direction) as presented by Sun et al. [15]. For an under-humidified cell, the local current
increases monotonously along the channel. Indeed, the membrane hydration level at the inlet A is low;
this means a low local current density. Further along the channel towards B, as liquid water is produced,
the membrane hydration increases progressively, yielding a higher local current density. On the other
hand, for an over-hydrated cell, the local current decreases along the channel. Indeed, oxygen
concentration decreases along the channel due to oxygen consumption and because the water content in
the CL increases due to water production inherent to the cell’s operation. This decrease of oxygen
concentration results in a decrease of the current density. Moreover, there are also cases where the
current increases in a first part of the channel, reaches a maximum, and then decreases further along the
channel. In these cases, the two opposite effects of cell hydration (drying and flooding) are both locally
present, but the cell is not strictly over-humidified or under-humidified. The maximum current density is
found near the point in the z-direction where liquid water first appears in the CL. Indeed, at this point,
the membrane is well humidified and there is no excess liquid water to prevent gas transport. In order to
reach a good compromise between drying at the inlet and flooding near the outlet, it is therefore assumed
that optimal internal humidification conditions are reached when liquid water appears at the cathode in
the middle of the cell along the channel direction (point F in Figure 2). In accordance with the discussion
above, the threshold current density involving liquid water appearance at point F (Figure 2) will be
computed for different operating conditions. This threshold current density will be called the critical
current density, and denoted by i_cr. For any operating conditions, if the operating current is lower than
the critical current, there is no liquid water in the middle of the cell along the channel. This is interpreted
in this work as an under-humidified cell and may lead to drying. On the other hand, if the operating
current is higher than the critical current, liquid water is present in more than one half of the channel.
This is interpreted in this work as an over-humidified cell and may lead to flooding. The critical current
computed in this paper is therefore assumed to be the ideal current for the given operating conditions.
Further developments on that ideal humidification conditions assumption will be addressed in later
papers. However, no matter which assumption is used, the trend of the next results, like the parameters
influences, will remain unchanged. Hence, the results below are useful to analyze the role that each
operating parameters can play in the cell internal humidification management.
3.2 Critical current analysis
In this section, the effects of the operating parameters (inlet humidities, stoichiometric ratio, temperature
and pressures) on the critical current are presented. This allows to quantify the operating parameters
effects on the internal cell hydration and to determine operating parameters resulting in the ideal cell
internal humidification (accurate membrane hydration without liquid water excess).
3.2.1 Effect of the inlet relative humidities
It is expected that the inlet relative humidities influence the cell internal humidification, but their effects
may be very different according to the hydrogen supply mode.
Hydrogen dead-end mode
Figure 4 shows the critical current density icr (A⋅cm-2) for different inlet relative humidities respectively
in
in
at the cathode RH cat and at the anode RH an . The other operating parameters are summarized in tables 1
and 2 (in particular, the operating temperature is 60°C and the oxygen stoichiometric ratio is 2).
Three different zones are observed in Figure 4. For low cathode relative humidities, the critical current is
higher than 1 A⋅cm-2 no matter what the anode inlet humidity is. The cell is therefore under-humidified
(for currents lower than 1 A⋅cm-2). On the contrary, for high cathode relative humidities, the critical
current tends towards 0. The cell is therefore over-humidified (for currents higher than 0.005 A⋅cm-2). A
ISSN 2076-2895 (Print), ISSN 2076-2909 (Online) ©2010 International Energy & Environment Foundation. All rights reserved.
International Journal of Energy and Environment (IJEE), Volume 1, Issue 1, 2010, pp.1-20
11
third medium zone exists where the critical current varies from 0 to 1 A⋅cm-2 depending on the inlet
relative humidities. For any pair of relative humidities in this zone, the operating current has to be
accurately chosen in order to reach the appropriate operating conditions. Inversely, for any operating
current density, the inlet relative humidities can be accurately chosen in this third zone to reach the ideal
conditions.
Figure 4. Critical current density (A⋅cm-2) for different inlet relative humidities (dead-end mode)
According to the results of Figure 4, the cathode relative humidity has a much greater influence on the
critical current than the anode one (in steady state). This is because of the cathode humidity’s important
effect on the water pressure profile, as indicated by the relatively large vertical separation of the two
tracks in the membrane, the GDLs and the channels (Figure 5). On the contrary, the anode humidity has a
low influence on the critical current because it has a very little impact on water distribution in the cell
(Figure 6).
Figure 5. Influence of the inlet cathode relative humidity on the water content in the membrane and on
water vapor profile in the electrodes at the center of the cell (anode inlet relative humidity is 0 and i = 0.3
A.cm-2)
ISSN 2076-2895 (Print), ISSN 2076-2909 (Online) ©2010 International Energy & Environment Foundation. All rights reserved.
12
International Journal of Energy and Environment (IJEE), Volume 1, Issue 1, 2010, pp.1-20
Comparing these two cases (Figure 5 and Figure 6) shows that the cathode inlet RH is a very significant
factor in influencing the water vapor pressure and the water content (the difference between the two
water content curves in Figure 5 is of the order of 400%), whereas the anode inlet RH is not significant
(the difference in Figure 6 is of the order of 5%). This is due to the fact that, in dead end mode, the water
accumulates in steady state at the anode side up to a certain level which creates a diffusive flux allowing
to balance the electro-osmotic flux. Another reason is that the water flux created in the membrane by the
inlet water content is non-significant versus the electro-osmotic flux and the production flux (for
common operating conditions). No anode humidification is therefore required in a dead-end mode in
steady state.
Figure 6. Influence of inlet anode relative humidity on water vapor profile in the electrodes and on the
water content in the membrane (cathode inlet relative humidity is 0.5 and i = 0.3 A.cm-2)
Hydrogen flow-through mode
Figure 7 presents the critical current density i cr for different inlet cathode and anode relative humidities
in
in
RH cat and RH an when hydrogen is supplied in a flow-through mode.
Figure 7. Critical current density ( A ⋅ cm −2 ) for different inlet relative humidity (flow-through mode)
ISSN 2076-2895 (Print), ISSN 2076-2909 (Online) ©2010 International Energy & Environment Foundation. All rights reserved.
International Journal of Energy and Environment (IJEE), Volume 1, Issue 1, 2010, pp.1-20
13
It is seen that the dependence of the critical current density on the humidities is qualitatively similar to
the dead-end mode. Nevertheless, some differences exist. The anode relative humidity has more
influence in flow-through mode than in dead-end mode. However, this influence is still less than the
influence of the cathode relative humidity. Except for high anode humidifications, the critical current
density at a given value of cathode humidity is higher in flow-through mode than in dead-end mode.
Flow-through mode thus tends to decrease the internal cell humidification since the gas flow removes
water from the cell. For high anode relative humidifications, the critical current is lower, implying a
higher cell internal humidification due to the fact that more water is added into the cell.
3.2.2 Effect of the stoichiometric ratios
In both hydrogen supply modes, the stoichiometric ratios influence water removal from the electrodes,
and accordingly, the critical current. In this section, dead-end and flow-through configurations are
studied separately because the hydrogen stoichiometric ratio can vary only in the flow-through
configuration.
Hydrogen dead-end mode
Figure 8 shows the influence of the oxygen stoichiometric ratio on the critical current density for
different cathode relative humidities (see Table 1 for the others operating parameters).
Figure 8. Influence of the oxygen stoichiometric ratio on the critical current density
This figure shows that, for a 50% cathode relative humidity, the oxygen stoichiometric ratio can be
chosen to reach any critical current density in the range of 0 to 1 A⋅cm-2. However this is not the case for
some other cathode relative humidities. For a low cathode inlet humidification (30%), the critical current
density is always above 0.4 A⋅cm-2, no matter what the stoichiometric ratio is. This implies that for low
currents, the cell will always be under-humidified. On the other hand, for a high cathode inlet
humidification (70%), the critical current density is always below 0.3 A⋅cm-2, no matter what the
stoichiometric ratio is, and the cell will thus be over-humidified for high currents. Clearly, optimal
humidification conditions cannot be reached merely by changing the oxygen stoichiometric ratio.
Hydrogen flow-through mode
Figure 9 presents the influence of the hydrogen and oxygen stoichiometric ratios on the critical current
density in flow-through mode hydrogen supply. The influence of the oxygen stoichiometric ratio in deadend mode of hydrogen supply is also reported for comparison (see Table 1 for the others operating
parameters).
ISSN 2076-2895 (Print), ISSN 2076-2909 (Online) ©2010 International Energy & Environment Foundation. All rights reserved.
14
International Journal of Energy and Environment (IJEE), Volume 1, Issue 1, 2010, pp.1-20
Figure 9. Influences of the stoichiometric ratios
First, it can be seen that the oxygen stoichiometric ratio has almost the same influence in dead-end mode
as in flow-through mode. Indeed, increasing the oxygen stoichiometric ratio results in better water
removal from the channels. This effect is the same no matter how the hydrogen is supplied.
Secondly, the hydrogen stoichiometric ratio has less influence on the critical current than the oxygen
ratio. Indeed, there is no inert gas present in the supplied hydrogen (compared to oxygen), and the
mechanisms involved in water distribution in the cell are not symmetrical (water production at the
cathode and electro-osmotic drag toward the cathode). Accordingly, tuning the hydrogen stoichiometric
ratio can be less efficient than tuning the oxygen one in order to adjust cell humidification conditions.
3.2.3 Effect of the temperature
The cell internal humidification is thermo-dependent as a consequence of the water saturation pressure
thermo-dependency. The critical current will therefore depend on the temperature. The influence of the
temperature on the critical current is presented in Figure 10 for different cathode relative humidities (the
anode relative humidity is 0 and hydrogen is supplied in a dead end mode - see Table 1 for the others
operating parameters).
Figure 10. Temperature effect on the critical current (dead end mode of hydrogen supply)
ISSN 2076-2895 (Print), ISSN 2076-2909 (Online) ©2010 International Energy & Environment Foundation. All rights reserved.
International Journal of Energy and Environment (IJEE), Volume 1, Issue 1, 2010, pp.1-20
15
The critical current density is extremely dependent on temperature because of the exponential
dependency of the saturation pressure, as shown in (11). The result is that the critical current varies from
0 to 1 A⋅cm-2 within a narrow temperature range of only 10°C, the onset of the change depending on the
value of the cathode relative humidity (the higher that value, the higher the onset temperature). This
implies that a small change in temperature for the same operating current can lead to a drastic change in
the cell humidification conditions, changing from flooding to drying or inversely. Similar results are
obtained in a hydrogen flow-through mode. Hence, temperature control can be very efficient to solve cell
degradations due to water faults. This highlights the importance of heat management in fuel cells.
3.2.4 Effect of the total pressure
Pressure is another operating parameter which could influence the critical current. Simulations were
conducted for various cathode and anode inlet total pressures (“total pressure” here means the sum of all
the partial pressures at any electrode). Pressures are considered only up to 200 kPa because many fuel
cells operate around atmospheric pressure in order to reduce compressor energy consumption.
As shown in Figure 11, the anode and cathode total pressures (kept equal) also have an important
influence on the critical current. (Note that, once again, all the other parameters remain constant - see
Table 1 for the values - and particularly, the oxygen stoichiometric ratio is set at 2). Still, the influence of
the pressure is roughly the same in both hydrogen supply modes.
Figure 11. Total pressure effect on the critical current (dead end mode of hydrogen supply)
The decrease of the critical current versus the total pressure is explained via the gas velocity in the
channel. Indeed, let’s consider two operating conditions where only the total pressure is different. First, a
change in the total pressure does not lead to a change in the inlet vapor partial pressure since the latter
depends only on the relative humidity and on the temperature as given by equation (23) (the saturation
pressure depends on temperature only and not on total pressure):
(23)
P2in = RHin × Psat (Top )
prod
It does not lead either to a change in the water production N H O based on (24):
2
prod
H2O
N
i
=
2F
(24)
Hence, the input water content is the same in both cases. On the other hand, the water removal is
changed. Indeed, the cathode flow rate is given by equation (25).
ISSN 2076-2895 (Print), ISSN 2076-2909 (Online) ©2010 International Energy & Environment Foundation. All rights reserved.
International Journal of Energy and Environment (IJEE), Volume 1, Issue 1, 2010, pp.1-20
16
Qtot =
Ptot
vtot Ach
R Top
(25)
So, the cathode velocity is:
vtot =
Qtot R Top
Ptot Ach
(26)
A high total pressure therefore produces a low velocity (the total molar flow is approximately the same
since the stoichiometric ratio is constant). Now, the water removed from the cell by air is given by:
QH 2O =
PH 2O
R Top
vtot Ach
(27)
Lower velocity yields a lower water removal rate, and so the water vapour pressure in the electrode is
higher. Finally, this higher water vapour pressure results in a lower critical current density according to
its definition.
3.3 Humidification strategies
To obtain good membrane humidification, it is common to think that hydrogen has to be humidified and
supplied in flow-through mode [28]. The results in the present study suggest that a good membrane
humidification can also be obtained with dead-end mode. The present section compares these different
strategies.
Figure 12 shows the water content profile in the membrane (x-direction) for a 0.3 A⋅cm-2 current density
and for different humidification conditions (the operating parameters are given in the previous Tables 1
and 2). The profile is the one at the coordinate z corresponding to the center of the cell along the channel
direction.
Figure 12. Water content profile in the membrane for different humidification conditions
For cases 1 to 4, the operating current corresponds to the critical current, i.e. the ideal current leading to
water balance in the cell related to the operating conditions. Thus, the four cases are ideal cases for four
different humidification strategies: flow-through mode with fully humidified hydrogen (case 1), deadend mode with fully humidified hydrogen (case 2), dead-end mode without anode humidification (case
3), and flow-through mode without anode humidification (case 4).
ISSN 2076-2895 (Print), ISSN 2076-2909 (Online) ©2010 International Energy & Environment Foundation. All rights reserved.
International Journal of Energy and Environment (IJEE), Volume 1, Issue 1, 2010, pp.1-20
17
The cases with a 100% anode inlet humidification ratio (cases 1 and 2) lead to the best membrane
humidification. However, their profiles are only a few per cent better than those for 0% anode
humidification (cases 3 and 4). Hence all four cases also give reasonably similar ohmic losses, even at
high current densities (within 5% at 1 A⋅cm-2).
Conventional wisdom has it that anode inlet humidification is required to prevent membrane drying near
the anode, particularly at high current densities where an important electro-osmotic drag exists [28]. This
is clear by comparing cases 1 and 5 (at the same cathode inlet humidification of 38%). On the other hand,
the same performances can be achieved without anode humidification simply by changing the cathode
humidification, as shown by comparison of cases 1 and 4 (with 76% cathode humidification).
Since the performance for each humidification strategy (flow-through or dead-end with hydrogen
saturated or not) is almost the same for the ideal operating conditions, it can be concluded that
humidifying the anode inlet is not significantly important. Hence, instead of using a hydrogen flowthrough mode with a recirculation and humidification system at the anode, a simpler hydrogen dead-end
mode with no anode humidification can be used. Only an adjustment of the cathode humidification is
necessary in this case. This concluding remark is of a great interest for fuel cell design. According to this
observation, the fuel cell system can largely be reduced and simplified for the same performances. Note
that it is the strategy used by Ballard with the NEXA fuel cell [29]. However, purges have to be done and
optimized to regularly remove water and inert gases.
4. Conclusions and perspectives
A dynamic pseudo 2D model of a polymer electrolyte membrane fuel cell is presented in this work. This
model describes multi-component gas transport in the gas diffusion layers and in the bipolar plate
channels. It also describes water transport in the membrane. This model is used to analyze the role that
each operating parameters can play in the cell internal humidification management and consequently, the
cell performances.
For that purpose, a discussion is opened about the effect of liquid water appearance at different locations
in the cell on the voltage. According to this analysis, it is proposed that the ideal internal humidification
conditions are reached when liquid water appears in the middle of the cell along the channel. This
appears to be a good compromise between flooding and drying. The critical current density which yields
this ideal internal humidification is then computed for various operating conditions. The influence of the
various operating parameters on this critical current, such as gas inlet relative humidities, temperature,
stoichiometric ratios or pressures, is analyzed. In the analysis, dead-end and flow-through modes of
hydrogen supply are also compared.
Operating cell temperature has a strong influence on the critical current and can dramatically influence
the internal humidification of the cell. Hence, the temperature is a key parameter to control when
considering the cell internal humidification. It is shown that the cathode total pressure also has a
significant influence. Moreover, although the oxygen stoichiometric ratio has an effect on cell
humidification, this influence is limited and cannot be used alone to adjust the cell humidification.
In contrast to the cathode inlet humidification, the anode inlet humidification has almost no influence in a
dead-end hydrogen configuration; its influence in a flow-through mode is not significant either. In
addition, it is found that, instead of using a hydrogen flow-through mode with a recirculation and
humidification system at the anode, a simpler hydrogen dead-end mode with no anode humidification
can be used to obtain almost the same membrane humidification. An adjustment of the cathode
humidification is necessary in this case. Indeed, the anode is prevented from drying at high current
density due to the water diffusion from the cathode toward the anode.
All these results are of great interest to the improvement of water management in PEMFC. They lead to a
better understanding of how to use the operating parameters to control the cell internal humidification.
These results are also useful to develop control humidification strategies by simulating different
humidification approaches. In a future part of this work, liquid water transport will be modeled for a
more precise determination of the optimum operating conditions,. This will allow to take into account
voltage drops due to flooding. Furthermore, a transient analysis of the internal humidification will be
conducted Finally, this simple control-oriented model will be used by a real time control algorithm to
command the fuel cell operating parameters in order to improve the overall system efficiency.
ISSN 2076-2895 (Print), ISSN 2076-2909 (Online) ©2010 International Energy & Environment Foundation. All rights reserved.
18
International Journal of Energy and Environment (IJEE), Volume 1, Issue 1, 2010, pp.1-20
Acknowledgements
This work was jointly supported by LTE-Hydro-Quebec and Natural Sciences and Engineering Research
Council of Canada. The authors gratefully acknowledge the advices of Michel Dostie, Michael Fournier
and Alain Poulin from the LTE Hydro-Québec.
References
[1] Barbir F. PEM fuel cells: theory and practice. Elsevier Academic Press, 2005.
[2] Ramousse J., Adzakpa K.P., Dube Y., Agbossou K., Fournier M., Poulin A., Dostie M. Local
voltage degradations (drying and flooding) analysis through 3D stack thermal modeling, Accepted
for publication in J. Fuel Cell Science and Technology 2009.
[3] Bernardi D.M., Verbrugge M.W. A mathematical model of the solid-polymer-electrolyte fuel cell.
J. Electrochem. Soc., 1992, 139, 2477-2491.
[4] Springer T.E., Zawodzinski T.A., Gottesfeld S. Polymer electrolyte fuel cell model. J.
Electrochem. Soc. 1991, 138, 2334-2342.
[5] Fuller T.F., Newman J. Water and thermal management in solid-polymer-electrolyte fuel cells. J.
Electrochem. Soc. 1993, 140, 1218-1225.
[6] Nguyen T.V., White R.E. A water and heat management model for proton-exchange-membrane
fuel cells. J. Electrochem. Soc. 1993, 140, 2178-2186.
[7] Adzakpa K.P., Ramousse J., Dubé Y., Akremi H., Agbossou K., Dostie M., Poulin A. Fournier M.
Transient air cooling thermal modeling of a PEM fuel cell. J. Power Sources 2008, 179, 164-176.
[8] Natarajan D., Van Nguyen T. Three-dimensional effects of liquid water flooding in the cathode of
a PEM fuel cell. J. Power Sources 2003, 115, 66-80.
[9] Sun H., Liu H., Guo L.-J. PEM fuel cell performance and its two-phase mass transport. J. Power
Sources 2005, 143, 125-135.
[10] Dunbar Z., Masel R.I. Quantitative MRI study of water distribution during operation of a PEM
fuel cell using Teflon(R) flow fields. J. Power Sources 2007, 171, 678-687.
[11] Tuber K., Pocza D., Hebling C. Visualization of water buildup in the cathode of a transparent PEM
fuel cell. J. Power Sources 2003, 124, 403-414.
[12] Owejan J.P., Trabold T.A., Gagliardo J.J., Jacobson D.L., Carter R.N., Hussey D.S., Arif M.
Voltage instability in a simulated fuel cell stack correlated to cathode water accumulation. J.
Power Sources 2007, 171, 626-633.
[13] Wang Z.H., Wang C.Y., Chen K.S. Two-phase flow and transport in the air cathode of proton
exchange membrane fuel cells. J. Power Sources 2001, 94, 40-50.
[14] Pasaogullari U., Wang C.-Y. Liquid water transport in gas diffusion layer of polymer electrolyte
fuel cells. J. Electrochem. Soc. 2004, 151, A399-A406.
[15] Sun H., Zhang G., Guo L.-J., Dehua S., Liu H., Effects of humidification temperatures on local
current characteristics in a PEM fuel cell. J. Power Sources 2007, 168, 400-407.
[16] Lee C.-I., Chu H.-S. Effects of cathode humidification on the gas-liquid interface location in a
PEM fuel cell. J. Power Sources 2006, 161, 949-956.
[17] Lee C.-I., Chu H.-S. Effects of temperature on the location of the gas-liquid interface in a PEM
fuel cell. J. Power Sources 2007, 171, 718-727.
[18] Williams M.V., Kunz H.R., Fenton J.M., Operation of Nafion®-based PEM fuel cells with no
external humidification: influence of operating conditions and gas diffusion layers. J. Power
Sources 2004, 135, 122-134.
[19] Fournier M., Agbossou K., Poulin A., Dubé Y., Simard G. Dynamic model of a PEMFC stack
suitable for component level modeling of a fuel cell based generator. Proceedings of the 16th
World Hydrogen Energy Conference. Lyon, France, 2006.
[20] Song D., Wang Q., Liu Z.-S., Huang C. Transient analysis for the cathode gas diffusion layer of
PEM fuel cells. J. Power Sources 2006, 159, 928-942.
[21] Weber A.Z., Newman J. Modeling transport in polymer-electrolyte fuel cells. Chem. Rev. 2004,
104, 4679-4726.
[22] B.M. Eaton. One dimensional transient model of heat, mass, and charge transfer in a proton
exchange membrane. M. of Sc. Thesis, Virginia Polytechnic and State University, 2001.
[23] Nam J.H., Kaviany M. Effective diffusivity and water-saturation distribution in single- and twolayer PEMFC diffusion medium. Int. J. Heat Mass Transfer 2003, 46, 4595-4611.
[24] Bird R.B., Stewart W.E., Lightfoot E.N. Transport phenomena. John Wiley & sons, 1960.
ISSN 2076-2895 (Print), ISSN 2076-2909 (Online) ©2010 International Energy & Environment Foundation. All rights reserved.
International Journal of Energy and Environment (IJEE), Volume 1, Issue 1, 2010, pp.1-20
19
[25] Chang M.-H., Chen F., Teng H.-S. Effects of two-phase transport in the cathode gas diffusion
layer on the performance of a PEMFC. J. Power Sources 2006, 160, 268-276.
[26] Hassanaly N., Agbossou K., Dube Y., Adzakpa K.P. Air Supply state model for a proton exchange
membrane fuel cell control, Proceedings of the Canadian Conference on Electrical and Computer
Engineering. Vancouver, Canada, 2007. p. 1511-1514.
[27] Karnik A.Y., Stefanopoulou A.G., Sun J. Water equilibria and management using a two-volume
model of a polymer electrolyte fuel cell. J. Power Sources 2007, 164, 590-605.
[28] You L., Liu H. A two-phase flow and transport model for the cathode of PEM fuel cells. Int. J.
Heat Mass Transfer 2002, 45, 2277-2287.
Florent Breque received his bachelor degree in Mechanical and Aeronautical Engineering at ENSMA (Ecole Nationale Supérieure
de Mécanique et d’Aérotechnique), Poitiers, France, in early 2005. In the same time, he specialized at McGill University in
Montréal (Canada) in fluid mechanics, energetics and heat transfer.
He was a research engineer at European Aeronautic Defence and Space Company (EADS). Then he joined the Hydrogen Research
Institute IRH (Institut de Recherche sur l’Hydrogène), Trois-Rivières, Canada, in 2006 as a Master student. His research includes
numerical modelling and control aspects of polymer electrolyte membrane fuel cells. He mainly focuses on mass transfer in order
to improve water management in a fuel cell. His work is supported by Hydro-Québec, Natural Resources Canada and the Natural
Sciences and Engineering Research Council of Canada.
E-mail address:
Julien Ramousse received the B.Sc. and M.Sc. degrees in energetics and mechanical engineering from the Ecole Nationale
Supérieure d’Électricité et de Mécanique (ENSEM), Nancy, France, in 2002, and the Ph.D. degree from the Institut National
Polytechnique de Lorraine (INPL), Nancy, France, in 2005. He worked in the Hydrogen Research Institute, Université du Québec à
Trois-Rivières, Trois-Rivières, QC, Canada, from September 2006 to 2008 as a Postdoctoral Researcher. Since September 2008, he
is an Assistant Professor at the engineering school Polytech’Annecy-Chambéry, Université de Savoie, Chambéry, France.
His research, now done at the Laboratoire Optimisation de la Conception et Ingénierie de l’Environnement (LOCIE) concerns
transfer intensification in energy conversion devices. His research fields include mainly mass transfer in order to improve water
management in fuel cells, numerical modeling and control aspects of PEMFC systems, and recently heat transfer in thermoelectric
heat pumps. He is the co-author of almost 10 publications with more than 30 conference presentations.
Dr. Ramousse is a member of the Editorial Advisory Board of the International Journal of Energy and Environment (IJEE).
E-mail address:
Yves Dube received his B.S. (1977) in physical engineering, M.S. (1979) in mechanical engineering and Ph.D. (1985) degree in
Simulation and Control from the Université Laval in Canada. He is now Professor in the Mechanical Engineering Department of
UQTR. His present research activities are in the area of renewable energy, hydrogen combustion engine development and control
of mechanical systems. He is the author of more than 30 publications and has 1 patent. He is a Professional Engineer and member
of the Ordre des Ingénieurs du Québec since 1977.
E-mail address:
Kodjo Agbossou (M'1998, SM’2001) received his B.S. (1987), M.S. (1989) and Ph.D. (1992) degrees in Electronic Measurements
from the Université de Nancy I, France. He was a post-doctoral researcher (1993-1994) at the Electrical Engineering Department of
the Université du Québec à Trois-Rivières (UQTR), and was Lecturer (1997-1998) at the same department. Also he was Project
Manager and Research Professional (1994-1998) in the Ultrasonic and Sensor Laboratory. Since 1998, he is Full Professor in the
Electrical and Computer Engineering Department of UQTR. He was the Director of Graduate Studies in Electrical Engineering.
He is now a head of the department and his present research activities are in the area of renewable energy, integration of hydrogen
production, storage and electrical energy generation system, control and measurements. He is the author of more than 70
publications and has 3 patents.
Pr. Agbossou is also a PES-IEEE member and former Chair of IEEE Section Saint Maurice, QC, Canada. He is a Professional
Engineer and joined the Ordre des Ingénieurs du Québec in 1998.
E-mail address:
Pelope Adzakpa received the B.Sc. and M.Sc. degrees in mathematics from the University of Lome, Lome, Togo, in 1998 and
1999, respectively, and the M.Sc. and Ph.D. degrees in industrial engineering from the University of Technology, Troyes, France,
in 2001 and 2004, respectively. From 2000 to 2004, he was a Lecturer and a Research Assistant in the Industrial Systems
Engineering Department, University of Technology, Troyes. From 2006 to 2007 he was a Postdoctoral Researcher at the Hydrogen
Research Institute, Université du Québec à Trois-Rivières, Trois-Rivières, QC, Canada. He is currently a Comptia RFID+ Certified
Professional in RFID software solutions. He is the author or coauthor of several publications. His research interests include
industrial systems control, dependability and optimization, renewable-energy-system modeling, control, and diagnosis and RFID
based ERP solutions.
E-mail address:
ISSN 2076-2895 (Print), ISSN 2076-2909 (Online) ©2010 International Energy & Environment Foundation. All rights reserved.
20
International Journal of Energy and Environment (IJEE), Volume 1, Issue 1, 2010, pp.1-20
ISSN 2076-2895 (Print), ISSN 2076-2909 (Online) ©2010 International Energy & Environment Foundation. All rights reserved.