13C–18O bonds in carbonate minerals: A new kind of paleothermometer ppt
Bạn đang xem bản rút gọn của tài liệu. Xem và tải ngay bản đầy đủ của tài liệu tại đây (606.76 KB, 18 trang )
13
C–
18
O bonds in carbonate minerals: A new kind of paleothermometer
Prosenjit Ghosh
a,
*
, Jess Adkins
a
, Hagit Affek
a
, Brian Balta
a
, Weifu Guo
a
,
Edwin A. Schauble
b
, Dan Schrag
c
, John M. Eiler
a
a
Division of Geological and Planetary Sciences, California Institute of Technology, Pasadena, CA 91125, USA
b
Department of Earth and Space Sciences, University of California—Los Angeles, Los Angeles, CA 90095, USA
c
Department of Earth and Planetary Sciences, Harvard University, Cambridge, MA 02138-2902, USA
Received 2 August 2005; accepted in revised form 10 November 2005
Abstract
The abundance of the doubly substituted CO
2
isotopologue,
13
C
18
O
16
O, in CO
2
produced by phosphoric acid digestion of synthetic,
inorganic calcite and natural, biogenic aragonite is proportional to the concentration of
13
C–
18
O bonds in reactant carbonate, and the
concentration of these bonds is a function of the temperature of carbonate growth. This proportionality can be described between 1 and
50 °C by the function: D
47
= 0.0592 Æ 10
6
Æ T
À2
À 0.02, where D
47
is the enrichment, in per mil, of
13
C
18
O
16
OinCO
2
relative to the
amount expected for a stochastic (random) distribution of isotopes among all CO
2
isotopologues, and T is the temperature in Kelvin.
This relationship can be used for a new kind of carbonate paleothermometry, where the temperature-dependent property of interest is the
state of ordering of
13
C and
18
O in the carbonate lattice (i.e., bound together vs. separated into different CO
3
2À
units), and not the bulk
d
18
Oord
13
C values. Current analytical methods limit precision of this thermometer to ca. ± 2 °C, 1r. A key feature of this thermometer
is that it is thermodynamically based, like the traditional carbonate–water paleothermometer, and so is suitable for interpolation and
even modest extrapolation, yet is rigorously independent of the d
18
O of water and d
13
C of DIC from which carbonate grew. Thus, this
technique can be applied to parts of the geological record where the stable isotope compositions of waters are unknown. Moreover,
simultaneous determinations of D
47
and d
18
O for carbonates will constrain the d
18
O of water from which they grew.
Ó 2005 Elsevier Inc. All rights reserved.
1. Intr oduction
Oxygen isotope exchange equilibria between carbonate
minerals and water form the basis of the oldest and most
widely used type of geochemical paleothermometer (Urey,
1947; McCrea, 1950; Epstein et al., 1953; Emiliani, 1955,
1966a,b). The carbonate–water thermometer is a landmark
of both paleoclimate research and isotope geochemistry,
but suffers from one simple but important weakness: the
oxygen isotope compositions of both carbonates and the
waters from which they grew must be known to determine
temperature. Carbonates are a widespread and often well-
preserved part of the geological record, but only rarely do
we have direct and independent evidence for the oxygen
isotope compositions of ancient waters.
Various approaches have been taken for resolving or cir-
cumventing this difficulty. For example, it is possibl e to
estimate the d
18
O of the ancient ocean by modeling d
18
O
gradients in marine sediment pore-waters (Schrag et al.,
1996, 2002; Adkins et al., 2002), based on oxygen isotope
compositions of benthic foraminifera (Shackleton, 1967),
or based on reconstructed sea-level changes and the esti-
mated d
18
O of glacial ice (Dansgaard and Tauber, 1969).
These approaches are generally only useful for study of
Pleistocene marine records—an important but small subset
of all the potential uses of carbonate paleothermometry.
Similarly, there are several marine paleothermometers
based on speciation of planktonic organisms, relative
abundances of alkenones, or the Mg/Ca or Sr/Ca ratios
of corals, foraminifera, and other carbonate-producing
organisms. These thermometers can also be used to precise-
ly re-construct Pleistocene marine temperature, but are
unsuitable for extrapolation in temperature, apply only
0016-7037/$ - see front matter Ó 2005 Elsevier Inc. All rights reserved.
doi:10.1016/j.gca.2005.11.014
*
Corresponding author. Fax: +1 626 568 0935.
E-mail address: (P. Ghosh).
www.elsevier.com/locate/gca
Geochimica et Cosmochimica Acta 70 (2006) 1439–1456
to the ocean, and are of uncertain value in the deep geolog-
ical past.
We present the principles, calibration data and an illus-
trative application of a new paleothermometer based on
ÔclumpingÕ of
13
C and
18
O in the carbonate mineral lattice
into bonds with each other—that is, we examine not only
the
13
C/
12
C and
18
O/
16
O ratios of carbonates, but also
the fraction of
13
C and
18
O atoms that are joined together
into the same carbonate ion group (
13
C
18
O
16
O
2
2À
). This
thermometer is based on a thermodynamically controlled
stable isotope exchange equilibrium among components
of the carbonate crystal lattice. Because it involv es a homo-
geneous equilibrium (reaction among components of a sin-
gle phase), it rigorously constrains the temperature of
carbonate growth based on the isot opic composition of
carbonate alone, independent of the isotopic composition
of the water from which it grew or other phases with which
it co-exists.
1.1. A paleothermometer based on ordering of
13
C and
18
Oin
carbonate minerals
Carbonate minerals contain 20 different isotopologues,
or isotopic variants, of the carbonate ion group (Table
1). The most ab undant of these,
12
C
16
O
3
2À
($98.2%) con-
tains no rare isotopes. The next three most abundant,
13
C
16
O
3
2À
($1.1%),
12
C
18
O
16
O
2
2À
($0.6%) and
12
C
17
O
16
O
2
2À
($0.11%) are singly substituted (i.e., contain
one rare isotope). Collectively, these four isotopologues
constitute almost all ($99.99%) of the carbonate ions in
natural carbonate minerals, and effectively control their
bulk d
13
C, d
17
O and d
18
O values. However, most of the iso-
topic diversity—16 different isotopologues in all—is con-
tained in the doubly, triply and quadrupally substituted
carbonate ion units that make up the remaining
$100 ppm. Each of these multiply substituted isotopo-
logues has unique vibrational properties, and therefore
they must differ from one another in thermodynamic stabil-
ity (among other things).
In a carbonate crystal at thermodynamic equilibrium,
the relative abundances of the various carbonat e ion isoto-
pologues must conform to equilibrium constants for reac-
tions such as:
13
C
16
O
2À
3
þ
12
C
18
O
16
O
2À
2
¼
13
C
18
O
16
O
2À
2
þ
12
C
16
O
2À
3
(Reaction 1)
There are many independent reactions of this type, but we
focus only on this one because it involves the most abun-
dant (and therefore most easily measured) doubly substi -
tuted isotopologue (
13
C
18
O
16
O
2
2À
).
Urey (1947), Bigeleisen and Mayer (1947), and Wang
et al. (2004) examine the thermodynamics of reactions
analogous to Reaction 1 involving isotopologues of simple
molecular gases. They show that equilibrium constants for
such reactions are temperature dependent and generally
promote ÔclumpingÕ of heavy isotopes into bonds with each
other (increasing the proportions of multiply substituted
isotopologues) as temperature decreases. If Reaction 1 fol-
lows similar principles, its equilibrium constant should be
near 1 at very high temperatures and increase (driving
the reaction to the right) with decreasing temperature.
Thus, in thermodynamically equilibrated carbonates, the
equilibrium constant for Reaction 1 can serve as the basis
of a geothermometer, provided that the temperature
dependence of this reaction is known and the abundances
of all the reactant and product isotopic species can be
measured.
Reaction 1 can be thought of as analogous to order/dis-
order exchange reactions among cation sites in pyroxenes
Table 1
Abundances of isotopologues of CO
2
and CO
3
, assuming bulk
13
C/
12
C
ratios equal to PDB, bulk
18
O/
17
O/
16
O ratios equal to SMOW, and a
stochastic (random) distribution of isotopes
C Mass Abundance
Isotopes
12
C 12 98.89%
13
C 13 1.11%
O
16
O 16 99.759%
17
O 17 370 ppm
18
O 18 0.204%
CO
2
Mass Abundance
Isotopologue
16
O
12
C
16
O 44 98.40%
16
O
13
C
16
O 45 1.10%
17
O
12
C
16
O 45 730 ppm
18
O
12
C
16
O 46 0.40%
17
O
13
C
16
O 46 8.19 ppm
17
O
12
C
17
O 46 135 ppb
18
O
13
C
16
O 47 45 ppm
17
O
12
C
18
O 47 1.5 ppm
17
O
13
C
17
O 47 1.5 ppb
18
O
12
C
18
O 48 4.1 ppm
17
O
13
C
18
O 48 16.7 ppb
18
O
13
C
18
O 49 46 ppb
CO
3
Mass Abundance
Isotopologue
12
C
16
O
16
O
16
O 60 98.20%
13
C
16
O
16
O
16
O 61 1.10%
12
C
17
O
16
O
16
O 61 0.11%
12
C
18
O
16
O
16
O 62 0.60%
13
C
17
O
16
O
16
O 62 12 ppm
12
C
17
O
17
O
16
O 62 405 ppb
13
C
18
O
16
O
16
O 63 67 ppm
12
C
17
O
18
O
16
O 63 4.4 ppm
13
C
17
O
17
O
16
O 63 4.54 ppb
12
C
17
O
17
O
17
O 63 50 ppt
12
C
18
O
18
O
16
O 64 12 ppm
13
C
17
O
18
O
16
O 64 50 ppb
12
C
17
O
17
O
18
O 64 828 ppt
13
C
17
O
17
O
17
O 64 0.5 ppt
13
C
18
O
18
O
16
O 65 138 ppb
12
C
17
O
18
O
18
O 65 4.5 ppb
13
C
17
O
17
O
18
O 65 9 ppt
12
C
18
O
18
O
18
O 66 8 ppb
13
C
17
O
18
O
18
O 66 51 ppt
13
C
18
O
18
O
18
O 67 94 ppt
1440 P. Ghosh et al. 70 (2006) 1439–1456
and feldspars (e.g., Myers et al., 1998). For this reason, we
describe the thermometer based on Reaction 1 as the
Ô
13
C–
18
O order/disorder carbonate thermometerÕ. A less
precise, but less ungainly term we also use here is the Ôcar-
bonate clumped-isotope thermometerÕ. The important fea-
ture of this thermometer is that it involves a homogeneous
equilibrium (that is, a reaction among components of one
phase, rather than between two or more phases), and there-
fore rigorously constrains temperature without knowing
the isotopic composition of a second phase.
We are aware of no way one could directly measure
abundances of
13
C
18
O
16
O
2
2À
ionic groups in carbonate
minerals with sufficient precision to be useful for paleother-
mometry. They make up only ca. 60 ppm of natural car-
bonates (Table 1), and we show below that they must be
analyzed with relative precision of ca. 10
À5
. It seems
unlikely that any spectroscopic method could meet these
requirements. However, Eiler and Schauble (2004) and Af-
fek and Eiler (2005), recently showed that it is possible to
analyze
13
C
18
O
16
OinCO
2
at natural abu ndances and with
the necessary precision. We show here that the abundance
of
13
C
18
O
16
OinCO
2
produced by phosphoric acid diges-
tion of carbonate minerals is proportional to the abun-
dance of
13
C
18
O
16
O
2
2À
ionic groups in those minerals
themselves. Thus, combination of the mass-spectromet ric
methods of Eiler and Schauble (2004) and Affek and Eiler
(2006) with long-established methods of phosphoric acid
digestion of carbonates can constrain the equilibrium con-
stant for Reaction 1, and therefore the growth temperature,
in a sample of solid carbonate.
2. Samples and methods
2.1. Samples
2.1.1. Natural and synthetic calcite standards
We studied one inter-laboratory calcite standard (NBS-
19, distributed by the IAEA) and three intra-laboratory
calcite standards, ÔMARJ-1Õ, ÔMZ carbonateÕ and ÔSigma-
carbÕ. Two of the standards (NBS-19 and MARJ-1) were
purified from Italian Carrara marbles that were meta mor-
phosed to upper-greenschist facies during the mid-Tertiary
(Friedman et al., 1982; Molli et al., 2000; Leiss and Molli,
2003; Ghosh et al., 2005). MAR-J1 studied here has a grain
size of less than 250 lm and a texture and chemical and O
and C isotope composition similar to NBS-19 (Ghosh
et al., 2005). The MZ carbonate standard was obtained
from MERCK ( and the Sig-
ma-carb standard was obtained from Sigma–Aldrich chem-
ical supply ( Both of these
carbonates were produced by passing carbon dioxide
through a slurry of calcium oxide and water, producing a
very fine precipitate of calcite (the industrial term for this
reaction is the Ôcarbonation processÕ). The typical grain size
of these carbonate powders is 40–50 l, based on measure-
ment under a binocu lar microscope. It is unimportant for
our purposes whether the carbonation process promotes
oxygen isotope exchange equilibrium between carbonate
and water; it is important only that the carbonate precipi-
tates are chemically pure and isotopically homogeneous
when sampled in mg-sized aliquots, and thus provide a use-
ful basis for establishing the precision of our analyses.
2.1.2. Equatorial surface coral
We examined a sample of Porites surface coral collect-
ed from the west shore of Sumatra in the equatorial
Indian Ocean. This specimen, Mm97Bc, was obtained
from K. Sieh and was collected from the crest of a living
coral head in 1 m water depth at Memong Island (98.54
E; 0.035 N) (Natawidjaja, 2003, 2004). We estimate the
mean growth temperature of this coral to be
29.3 ± 2 °C, based on instrumental records from this re-
gion, which is characterized by a weak seasonality and
little spatial variability over hundreds of km (Abram
et al., 2003). Additional information about this sample
can be found in (Natawidjaja, 2003). This aragonitic cor-
al slab (1–2 cm) was sampled using a file, yielding
$100 lm powder.
2.1.3. Deep sea coral
We examined two specimens of D. dianthus (a deep sea
coral also previously referred to as D. cristagalli). Sample
47407, described in Adkins et al. (2003), was collected at
549 m water depth in the Southern Pacific ocean (54.49 S,
129.48 W) and grew at an estimated average temperature
of 5.5 ± 1.0 °C, based on instrument records from similar
depth and location. Sample 47413 was collected at 420 m
water depth off the south shore of New Zealand (50.38 S,
167.38 E) and grew at an estimated average temperatur e
of 8.0 ± 0.5 °C, also based on local instrument records.
These aragoni tic corals were sampled by breaking off frag-
ments of their fragile septa, followed by crushing to a mean
grain size of 100 lm. Both samples are from the Smithso-
nian co llections.
2.1.4. Calcites grown inorg anically at known temperat ure
We grew calcite by removing CO
2
from aqueous solu-
tions of sodium bicarbonate and calcium chloride or from
calcite-saturated solutions, using a method similar to that
described by Kim and O ÕNeil (1997). Two different variants
of this method were employed:
(1) Sample HA1 was prepared in the following way:
first, CO
2
(99.96%, Air Liquide) was bubbled
through de-ionized water at room temperature for
1 h. Next, NaHCO
3
(AR, Mallickrodt) was added
to the acidified water in quantities required to pro-
duce a 5 mM solution (R CO
3
2À
). After complete
dissolution of NaHCO
3
, CaCl
2
(99.8%, Fisher
scientific) was add ed to the solution, in amounts
required to make an equimolar NaHCO
3
:CaCl
2
solution, and the solution was stirred to complete
dissolution. CO
2
was then removed from this
solution using methods described below, forcing
13
C–
18
O bonds in carbonate minerals:A new kind of paleothermometer 1441
precipitation of calcite. The yield of calcite from
this experiment was low, and so we modified our
procedure for the remaining experiments.
(2) The rest of the samples were prepared by first bub-
bling CO
2
into a stirred suspension of CaCO
3
(99%
pure obtained from Sigma–Aldrich chemical supply,
approximately 0.5 g in 800 ml de-ionized water) for
1–2 h. The un-dissolved CaCO
3
was removed by
gravitational filtering through a grade-2 Whatman fil-
ter. The solution was then purged of CO
2
as described
below, forcing precipitation of calcite. Solutions pre-
pared in this way yielded far more calcite per unit
time, perhaps becau se partly dissolved nuclei of start-
ing calcite remained in suspension, providing tem-
plates for calcite precipitation.
Regardless of the way the solution was prepared, once
ready, approximately 200 ml was poured into an Erlenmey-
er flask that was sealed with a rubber stopper equipped
with inlet and outlet BEV-A-LINE tubing. This was placed
in a controlled-tempera ture water bath and allowed to
thermally equilibrate for 1 h. The temperature in the water
bath was monitored throughout our experiment using a
mercury thermometer. The temperature stability of the
chilled bath was ± 0.2 °C, that of the room temperature
bath was ± 1 °C, and that of heated water bath was
±2 °C. After thermally equilibrating, N
2
gas (99.96%, Air
Liquide) was bubbled first through a similar Erlenm eyer
flask filled with the same de-ionized water used to make
our solution (to minimize isotopic evolution of the solution
due to evaporation into the N
2
gas stream) and then
through the solution itself through a Pasteur pipette dipped
in the solution and attached to the rubber stopper sealing
the Erlenmeyer flask. The N
2
flow rate was approximately
10 ml/min for samples HA1 through HA7 and HA12 and
approximately 50 ml/min for sample HA9. Carbon dioxide
dissolved in the solution partitioned into the N
2
and was
removed from the system, promoting super saturation
and slow precipitation of calcium carbonates (Fig. 1, panel
1). The bubbling rate of N
2
was controlled by a regulator
attached to the gas cylinder and was monitored by count-
ing the number of bubbles per 30 s (10 ml/min was equiva-
lent to about 20 bubbles to 30 s).
Precipitation experiments were performed at room tem-
peratures (23 ± 1 °C), in an ice–water bath temperature
(1 ± 0.2 °C), and in heated water baths (at 33 ± 2 and
50 ± 2 °C). The time required for the first appearance of
visible precipitate depended on the composition of the solu-
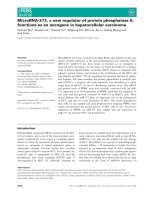
Fig. 1. Schematic illustration of apparatus used in this study. Panel 1: System of vessels and purge gases used in the synthesis of calcite from bicarbonate
solutions. See text for explanation. Panel 2: vacuum and carrier-gas apparatus used for phosphoric acid digestion of carbonate and clean-up of product
CO
2
. Powdered carbonate sample and phosphoric acid are placed in separate arms of the reaction vessel, evacuated, placed in a constant-temperature
bath, and then the vessel is tipped to mix acid with sample. Product CO
2
is cryogenically purified of water and other trace gases, condensed into a small
glass vessel, and transferred to the carrier-gas system for further purification. There, CO
2
is entrained in a He stream flowing at 2 ml/min, passed through a
32 m long 530 lm ID Supelco gas-chromatography column held at À10 °C and re-collected in a glass trap immersed in liquid nitrogen. Finally, the re-
collected CO
2
is returned to the vacuum system and cryogenically separated from He purge gas prior to mass spectrometric analysis.
1442 P. Ghosh et al. 70 (2006) 1439–1456
tion, temperature, and bubbling rate, and was typically
about 1 day. It took at least one day and a maximum of
five days to generate sufficient mate rial ($10 mg CaCO
3
)
for both X-ray diffraction and isotopic analysis. Upon
completion of each experiment, the solid carbonate precip-
itated on the walls and at the bottom of the vessel was re-
moved using a rubber spatula, filtered by injecting the
suspension through a Whatman GF/C filter paper and then
air dried for at least 48 h prior to storage for isotopic
analysis.
The mineralogy of every precipitate was identified by X-
ray diffraction analysis and some of the precipitates were
examined by optical microscopy. Further details about
each sample are summarized in Table 5.
An aliquot (15–10 ml) of the supe rnatant was stored in
an air-tight polypropylene container for d
18
O analysis
using a GasBench II water-equilibration system attached
to a Thermo Finnegan Delta Plus located at University
of California Irvine, with analytical precision of ± 0.1&.
The differences in d
18
O between calcites and waters (see Ta-
ble 5 and the Results and Discussion, below) fall broadly
within the range previously observed for inorganic calcite
synthesis experiments such as the ones we performed
(OÕNeil et al., 1969; Kim and OÕNeil, 1997), but do not
agree exactly (the average disagreement in the difference
(d
18
O
carbonate
À d
18
O
water
) is 0.3&). This disagreement
could reflect any combination of: temperature variations
during experiments; failure to maintain a constant isotopic
composition of solution during experiments or between
sampling and final analyses; and analytical errors in deter-
minations of the d
18
O of water and carbonate. All of these
factors potentially apply both to our experiments and those
to which we compare our results. Variations and errors in
temperature influence the accu racy of our calibration of
Reaction 1, but the other factors should not (see Fig. 4
in the Section 3, below). We do not believe we can indepen-
dently determine which combination of these errors in our
experiments and those of Kim and O ÕNeil (1997), explains
this discrepancy between the two studies. However, its
magnitude translates into a discrepancy in apparent tem-
perature of only 2 °C. This is comparable to the precision
in temperature corresponding to our best analytical preci-
sion in D
47
, and thus any error in our experiments implied
by this comparison seems unlikely to introduce a signifi-
cant additional error in the thermometer based on Reac-
tion 1.
2.2. Phosphoric acid digestion of carbonates
We extracted CO
2
from carbonates by reaction with
anhydrous phosphoric acid, following the methods of
McCrea (1950) and Swart et al. (1991). Fig. 1 (panel 2)
illustrates the glass vacuum apparatus used for this pur-
pose. This apparat us uses McCrea-type reaction vessels
and conventional vacuum cryogenic procedures to trap
product CO
2
and separate it from trace water. We imagine
that more sophisticated, automated devices should also be
appropriate for analyses such as those we describe,
although large samples (ca. 5 mg) are preferred to generate
the intense mass-47 ion beams needed for precise isotopic
analyses, and not all such systems can easily accommodate
such large samples. The details of our phosphoric acid
digestion procedure are as follows:
• Each reaction vessel is loaded with ca. 5 mg of sample
and 10 ml of $103% phosphoric acid (density 1.90 g/
ml) and evacuated to a baseline pressure of
$4 · 10
À3
mbar for more than 2 h.
• Each reaction vessel is then immersed a NESLAB water
bath, held at a temperature of 25 °C (unless otherwise
noted), and allowed to thermally equilibrate for 1 h pri-
or to tippi ng the acid reservoir to spill over the sample
powder, starting the acid digestion reaction.
• Unless otherwise noted, the reaction is allowed to pro-
ceed for at least 12 h and usuall y ca. 16 h (over night).
• Product CO
2
is then cryogenically collected into a glass
trap immersed in liquid nitrogen, and then released by
warming the trap to À77.8 °C (by immersing the trap
in a dry ice + ethanol slurry), leaving any trace water
frozen in the trap.
• Product CO
2
is then cryogenically collected into a small
($1 cc) evacuated glass sample vessel.
2.3. Purification of analyte CO
2
Multiply substituted isotopologues make up a small
fraction (10Õs of ppm at most) of CO
2
having natural stable
isotope abundances, and so accurate analysis requires a vir-
tual absence of isobar ic interferences from con taminant
gases (Eiler and Schauble, 2004). The most important of
these contaminants are hydrocarbons and halocarbons
(Eiler and Schauble, 2004). These are most easily removed
by gas-chromatography, and can be monitored in all sam-
ples by simultaneous analysis of masses 47, 48 and 49.
These contaminants typically contribute nearly equally to
all three of these masses, producing distinctive and highly
correlated relationships between relatively small 47 excess
(tenthÕs of per mil) and proportionately greater excesses
in 48 (several per mil) and 49 (tens of percent; Eiler and
Schauble, 2004). Therefore, each CO
2
sample analyzed in
this study was entrained in a He stream flowing at 2 ml/
min and passed through a 30 m long 530 lm ID Supelco
gas-chromatography column packed with porous divinyl
benzene polymer held at À10 °C, and re-collected in a glass
trap immersed in liquid nitrogen. The gas-chromatography
column was held in an oven (Hewlet Packard instruments
Model description: Perfect fit Model no: G1530A), modi-
fied so that it could be purged with the boil-off gas from
a tank of liquid nitrogen. See Fig. 1, panel 2 for further de-
tails. For these conditions and our typical sample size (ca.
50 lmol), elution times are 1 h with collection efficiency of
>95%. Small variations in collection efficiency within this
range appear not to be associated with isotopic fraction-
13
C–
18
O bonds in carbonate minerals:A new kind of paleothermometer 1443
ation. Finally, the re-collected CO
2
was then cryogenically
separated from He purge gas by condensation in a glass
trap immersed in liquid nitrogen followed by evacuation
of the residual He. Finally, the purified CO
2
was condensed
back into the small glass sample container and introduced
to the dual-inlet system of a Finnigan MAT 253 isotope ra-
tio mass spectrometer (see below). If evidence of contami-
nation was observed during analysis (based on correlated
47, 48 and 49 signals and /or atypical drift in the analysis),
the entire procedure was repeat ed to further purify the
sample. The GC column and connection assembly was
baked at 200 °C at a He flow rate of 5 ml/min for more
than 30 min between samples.
2.4. Mass spect rometric analyses of purified CO
2
All analyses reported here were made on a Finnigan
MAT 253 gas source isotope ratio mass spectrometer, con-
figured to simultaneously collect ion beams corresponding
to M/Z = 44, 45 and 46 (read through 3 Æ 10
8
to 1 Æ 10
11
X
resistors), as well as 47, 48 and 49 (read through 10
12
X
resistors). All measurements were made in dual inlet mode,
and with a typical source pressure sufficient to maintain the
mass-44 ion beam at a current of 160 nA. Each analysis in-
volves 10 cycles of sample-standard comparison and each
cycle involves 8 s integration of sample and standard ion
beams. Analyses were standardized by comparison with
an intra-laboratory reference gas whose bulk composition
had been previously calibrated against CO
2
produced by
phosphoric acid digestion of NBS-19, and whose abun-
dance of mass-47 isotopologues was established by com-
parison with CO
2
that had been heated to 1000 °Cto
achieve the stochastic distribution. These heated gas stan-
dards were prepared to have bulk stable isotope composi-
tions similar to those of unknowns, in order to minimize
the potential errors associated with mass spectrometric
nonlinearities (which are observable when samples and
standards differ by more than ca. 20–30& in any given iso-
tope ratio). See Eiler and Schauble (2004) for further de-
tails regarding protocols for standardizing measurements
of mass 47 CO
2
.
Abundances of mass-47 CO
2
are reported using the var-
iable D
47
, defined as in Eiler and Schauble (2004) and Wang
et al. (2004). Briefly, the D
47
value is the difference in per
mil between the measured 47/44 ratio of the sample and
the 47/44 ratio expected for that sample if its stable carbon
and oxygen isotopes were randomly dist ributed among all
isotopologues—a case described as the stochastic distribu-
tion. External precision of individual measurements of D
47
is typically 0.03&, consistent with counting-statistics limits
for these ion intensities and analytical durations. Most
samples were measured 3–10 times, such that the standard
error of their D
47
values is in the range 0.01–0.02&.
Finally, we define here the variable D
13
C
18
O
16
O
2
. By anal-
ogy with D
47
for CO
2
, D
13
C
18
O
16
O
2
equals the deviation, in
per mil, of the abundance of
13
C
18
O
16
O
2
2À
carbonate ion
units in a carbonate crystal from the abundance expected
for the stochastic distribution of all stable isotopes in that
crystal. To first order, D
13
C
18
O
16
O
2
equals k
eq
1
(the equilibri-
um constant for React ion 1), À1 · 1000.
3. Results
3.1. External precision of CO
2
extracted at 25 °C from
carbonate standards
Fig. 2 plots all analyses of the NBS-19, MAR-J1, MZ
carbonate and Sigma-carb standards made between Janu-
ary, 2004 and April, 2005. Each data point represents the
average of between 1 and 10 analyses of the gas from a sin-
gle acid extraction experiment; the error bar is ± 1se (the
standard error for that group of analyses—the appropriate
statistic to evaluate the reproducibility of separate acid
extraction experiments).
Carbon dioxide extracted from NBS-19 was analyzed
eight times where each gas was analyzed 4 or more times
(so that the standard error for each sample is expected to
be ca. 0.015&). These yield an average and standard devi-
Fig. 2. Values of D
47
determined for CO
2
extracted from reference
carbonates, NBS-19, MAR J1, MZ carbonate and Sigma carb., between
January 2004 and April 2005 (see Table 2). Each data point represents the
average of between 1 and 10 analyses of the gas from a single acid
extraction experiment. The error bar for each point is ± 1SE (the standard
error for that group of replicate mass-spectrometric analyses of a single
gas sample). This standard error obviously shrinks with increasing
numbers of replicate mass spectrometric analyses; this fact is visually
emphasized by using different symbols to discriminate between samples
analyzed, 2–3 times, or 4 or more times. We exclude samples analyzed only
once for visual clarity; all are shown as small symbols, and have average
standard errors of ± 0.030 &, 1SE. Long-term analytical reproducibility is
generally a small multiple (1· to 1.5·) of that expected by counting
statistics alone. See text for discussion.
1444 P. Ghosh et al. 70 (2006) 1439–1456
ation for their D
47
values of 0.341 ± 0.034 (Table 2). One of
these eight samples (the D
47
value of 0.27, measured on 9/
29/2004) is a 2r outlier to the rest of the group; the remain-
ing 7 have an average and standard deviation of
0.352 ± 0.019—the expected reproducibility based on
counting statistics alone. There is no obvious reason why
the measurement on 9/ 29/2004 is an outlier to this popula-
tion, although our sample purification procedures have im-
proved through time and we suspect data generated before
11/2004 a re more prone to unidentified contaminants than
those generated after. Three samples of CO
2
from MAR-J1
were analyzed 4 or more times each, and yielded an average
and standard deviation for D
47
of 0.341 ± 0.019 (Table 2).
NBS-19 and MAR-J1 are both Italian marbles, and so we
find it unsurprising that their D
47
values are indistinguish-
able from each other. Table 2 and Fig. 2 also present anal-
yses of CO
2
samples extracted from these materials where
each gas was analyzed only 1, 2 or 3 times each. These data
are similar to the measurements summarized above, but
scatter more widely (ca. ± 0.03&,1r), as expected for their
poorer counting statistics. Curiously, the mean D
47
values
for CO
2
analyzed fewer than 4 times are slightly lower than
those analyzed four or more times for two of three stan-
dards for which such a comparison can be made (NBS-19
and MAR-JI, but not MZ carbonate). We suspect that this
reflects a difference in standardization and/or trace con-
tamination between relatively early generated data (prior
to 6/2004, most of which were analyzed 1–3 times and were
less carefully cleaned) and more recent data (most of which
are analyzed 4 or more times and were more carefully
cleaned).
Eleven samples of CO
2
from Sigma-carb standard were
measured where each gas was analyzed 4 or more times.
These yield an average and standard deviation for D
47
of
0.551 ± 0.025. This reproducibility is poorer than expected
from counting statistics alone (ca. ±0.01–0.02 &), but the
variation of observed values through time makes it evident
that external precision over short time periods (weeks) is
systematically better: When data are grouped by week,
the sample-to-sample standar d deviations are 0.005,
0.009, 0.016 and 0.035 (see Table 2)—i.e., the average
external pr ecision for data measured the same week
(± 0.015) is equal to that expected from counting statistics.
This grouping of data over short time periods is also evi-
dent in Fig. 2, where one can see that measurements of Sig-
ma-carb standard drift by ca. 0.01–0.03& over several-
week timescales rather than being randomly distributed
over their 4 mon ths interval. We suspect this is evidence
that the external precisions of our acid extraction measure-
ments are comparable to counting statistics (0.01–0.02&)
over short time periods, but that some aspect of our mea-
surements, such as mass spectrometer calibration and/or
the temperature or cleanliness of acid extraction, drifts
subtly from week to week. Finally, only one measurement
of CO
2
from MZ standard involved 4 or more an alyses of
product CO
2
. However, the group of all samples (most of
which were analyzed only 1–3 times) over a 3 month period
Table 2
Stable isotope analyses, including D
47
,ofCO
2
extracted by phosphoric
acid digestion at 25 °C from various inter- and intra-laboratory carbonate
standards
Date Run no.* d
13
C
PDB
d
18
O
SMOW
D
47
Standard
error
NBS-19
Number of run P 4
1/21/2004 A 1533–38 1.92 38.83 0.35 0.02
4/11/2004 A 2166–70 1.97 38.90 0.34 0.03
6/8/2004 B 123–26 1.95 39.04 0.36 0.01
9/29/2004 B 505–511 1.93 38.78 0.27 0.01
1/18/2005 C 325–29 2.01 38.20 0.32 0.01
2/18/2005 C 913–917 1.99 39.30 0.37 0.02
2/25/2005 C 1092–95 2.00 39.38 0.37 0.02
4/1/2005 C 1585–88 1.99 39.27 0.36 0.03
Number of run 3-2
1/28/2004 A 1573–74 2.00 38.97 0.35 0.06
1/28/2004 A 1575–76 2.02 39.00 0.29 0.04
3/30/2004 A 2084–85 1.95 38.96 0.38 0.06
4/3/2004 A 2142–43 1.96 38.92 0.33 0.003
5/11/2004 B 2263–64 1.94 39.08 0.28 0.03
5/27/2004 B 2471–73 1.89 38.94 0.41 0.01
8/10/2004 B 176–77 2.01 39.14 0.34 0.01
9/26/2004 B 450–52 1.87 39.10 0.28 0.01
9/26/2004 B 453–55 1.96 39.23 0.35 0.02
10/8/2004 B 665–68 1.92 39.58 0.33 0.01
10/16/2004 B 744–47 1.75 38.86 0.38 0.02
1/24/2005 C 497–500 1.96 39.23 0.32 0.00
2/23/2005 C 1463–65 1.99 39.05 0.39 0.01
6/3/2005 C 1979–81 1.69 38.89 0.36 0.03
Single run
1/28/2004 A 1561 1.97 38.82 0.47 —
2/2/2004 A 1620 1.98 38.96 0.20 —
2/3/2004 A 1632 2.01 38.98 0.21 —
2/15/2004 A 1762 2.05 39.02 0.29 —
2/18/2004 A 1804 1.93 38.65 0.23 —
3/9/2004 A 1924 1.96 38.83 0.28 —
3/30/2004 A 2087 1.96 38.99 0.26 —
3/30/2004 A 2040 1.97 39.01 0.39 —
4/20/2004 A 2197 1.91 38.70 0.34 —
5/11/2004 B 2268 1.99 39.13 0.24 —
5/14/2004 B 2313 1.99 39.13 0.32 —
5/19/2004 B 2363 1.94 39.08 0.36 —
5/25/2004 B 2441 1.94 39.04 0.43 —
MAR J1
Number of run P 4
2/7/2004 B 2851–53 2.01 39.20 0.35 0.02
5/27/2004 B 2854–57 1.97 39.26 0.35 0.02
6/10/2004 B 583–87 1.96 39.29 0.32 0.02
Number of run 3-2
2/7/2004 B 2855–56 1.93 39.15 0.37 0.01
3/12/2004 B 1440–43 2.02 39.37 0.31 0.02
3/12/2004 B 1342–44 1.90 38.67 0.35 0.01
7/28/2004 B 41–42 1.92 39.00 0.28 0.04
9/16/2004 B 371–73 1.95 39.08 0.27 0.01
9/16/2004 B 374–76 1.95 39.06 0.34 0.04
12/17/2004 B 1443–45 1.92 39.20 0.33 0.03
Single run
9/17/2004 B 368 1.945 39.08 0.27 —
Sigma carbonate
Number of run P 4
12/4/2004 B 1389–99 À42.31 20.76 0.51 0.01
(continued on next page)
13
C–
18
O bonds in carbonate minerals:A new kind of paleothermometer 1445
yields an average and standard deviation for D
47
of
0.64 ± 0.02; the precision of these data is indistinguishable
from the expected limits from counting statistics (± 0.02–
0.03 for these data).
These data indicate that long-t erm external precision in
analyses of D
47
for CO
2
produced from acid digestion of
carbonates is similar to counting statistics (± 0.01–0.02)
over short time periods (days to weeks), but can degrade
to twice the counting statistics limit (± 0.03&) over periods
of months. One implication of this result is that the preci-
sion for D
47
measurements of unknowns should be maxi-
mized by normalization to a carbonate standard
measured within the same week under the same conditions.
3.2. Effects of varying the temperature of phosphoric acid
digestion
In the absence of any analytical fractionation, the D
47
value of CO
2
produced by carbonate acid digestion should
equal the D
13
C
18
O
16
O
2
value of reactant carbonate (this is eas-
ily shown by sampling statistics; see Table 1). However,
reaction of carbonate with phosphoric acid releases only
2/3 of the carbonate oxygen as CO
2
; the remainder remains
in solution. This reaction is accompanied by an oxygen iso-
tope fractionation, yielding CO
2
that is ca. 10& higher in
d
18
O than reactant carbonate. The exact magnitude of this
fractionation varies with reaction temperature and differs
among the various carbonate minerals (Sharma and
Clayton, 1965; Swart et al., 1991; Kim and O ÕNeil, 1997).
The physical cause of this fractionation is unclear. It might
reflect a temperature-dependent exchange equilibrium
between extracted CO
2
and residual O in solution, in which
case the D
47
value of product CO
2
should equal the equilib-
rium value for gaseous CO
2
at the temperature of extrac-
tion (Wang et al., 2004; Eiler and Schauble, 2004) and no
information regarding ordering of
13
Cand
18
O in the car-
bonate mineral lattice should be preserved. It might instead
reflect a kinetic isotope effect acting on the C–O bond; in
this case we expect that a
18
O
CO
2
ÀCO
2À
3
should differ for
13
C
and
12
C carbonate ions, and D
47
of extracted CO
2
should
be proportional but not equal to D
13
C
18
O
16
O
2
. We expect that
in this case any offset between D
13
C
18
O
16
O
2
and D
47
should
vary with extraction temperature, because a
18
O
CO
2
ÀCO
2À
3
varies
with temperature. If the physical cause is a kinetic isotope
effect acting on metal-O bonds, we expect that there should
be little or no sensitivity to
13
C–
12
C substitution, and D
47
of
product CO
2
should equal or closely approach D
13
C
18
O
16
O
2
.
We extracted CO
2
from Sigma-carb standard at 25, 50
and 80 °C and from NBS-19 at 25, 35 and 45 °C. Table
3 and Fig. 3 summarize results of these experiments. The
NBS-19 data discussed here were generated very early in
this study and lacked the careful purification, standardi-
zation and replication characteristic of other da ta in this
paper; they cannot be directly compared with NBS-19
data in Table 2 and Fig. 2. However, they do provide
useful constraints on the temperature effect on acid
digestion fractionat ions and so are included here. The
d
18
O value of product CO
2
decreases with increasing
reaction temperature, with an average slope of
À0.028& per °C(Table 3; this slope is similar to that
found by Swart et al., 1991). Also as expected, the
d
13
C value of product CO
2
is similar at all reaction tem-
peratures. The D
47
value of product CO
2
decreases with
increasing reaction temperature with an overall slope of
À0.0016& per °C. The results of these experi ments are
inconsistent with an exchange equilibrium between
extracted CO
2
and residual oxygen because the D
47
value
of product CO
2
is far from the internal equilibrium for
CO
2
gas at the temperatures of extraction (which varies
from D
47
of 0.93& at 25 °C to 0.64& at 80 °C; Wang
et al., 2004; Eiler and Schauble, 2004). Thus, these re-
sults suggest that the D
47
value of CO
2
produced by acid
digestion of carbonate has some simple proportionality
to the D
13
C
18
O
16
O
2
value of that carbonate, and that this
proportionality is only weakly dependent on reaction
temperature.
Table 2 (continued)
Date Run no.* d
13
C
PDB
d
18
O
SMOW
D
47
Standard
error
12/16/2004 B 1402–13 À42.32 20.73 0.53 0.01
1/6/2005 B 171–72 À42.46 20.77 0.59 0.04
1/23/2005 C 460–63 À42.48 20.44 0.56 0.01
2/19/2005 C 933–38 À42.28 20.95 0.59 0.01
2/21/2005 C 963–68 À42.52 20.57 0.58 0.01
3/2/2005 C 1137–42 À42.06 20.94 0.56 0.01
3/7/2005 C 1214–19 À42.02 20.88 0.54 0.02
3/8/2005 C 1263–68 À42.32 20.86 0.54 0.02
3/17/2005 C 1379–84 À42.37 20.71 0.55 0.02
3/20/2005 C 1415–20 À42.28 20.95 0.53 0.02
MZ carbonate
Number of run P 4
2/26/2004 A 1853–56 À13.29 35.63 0.61 0.008
Number of run 3-2
4/11/2004 A 2171–72 À13.44 35.33 0.68 0.019
4/2/2004 A 2124–25 À13.44 35.30 0.65 0.016
9/15/2004 B 359–361 À13.56 35.03 0.66 0.020
Single run
2/15/2004 A 1763 À13.48 35.35 0.65 —
5/11/2004 A 2261 À13.32 35.48 0.63 —
4/7/2004 A 2140 À13.43 35.35 0.67 —
4/7/2004 A 2128 À13.49 35.34 0.61 —
3/9/2004 A 1983 À13.41 35.24 0.63 —
Table 3
Stable isotope compositions of CO
2
released from NBS-19 and Sigma
carbonate reacted at three different temperature with 103% phosphoric
acid
Sample d
13
C
PDB
d
18
O
SMOW
Temperature
of reaction
(°C)
D
47
Standard
error of
D
47
values
NBS-19 1.95 39.00 25 0.28 0.032
NBS-19 2.01 38.61 35 0.197 0.035
NBS-19 1.97 38.29 45 0.21 0.038
NBS-19 1.96 38.09 45 0.28 0.036
Sigma carb À42.31 20.76 25 0.54 0.028
Sigma carb À42.28 19.81 50 0.52 0.034
Sigma carb À42.20 19.22 80 0.47 0.026
1446 P. Ghosh et al. 70 (2006) 1439–1456
3.3. Analyses of carbonates subjected to high-temperature
re-crystallization
Aliquots of MZ and Sigma-carb standards and an ara-
gonitic deep sea coral (47413) were re-crystallized by load-
ing them into a sealed Pt capsule and heating to 1100 °C
for 48 h in a TZM (Tungsten Zirconium Molybdenum al-
loy) cold-seal pressure vessel under 1000 bars of pressure.
Experimental charges were quenched in air at the end of
each experiment. The recovered calcite crystals were exam-
ined under the binocular and petrographic microscopes
and showed evidence of pervasive re-crystallization and
coarsening.
This high-temperature re-crystallization procedure
should drive Reaction 1 toward a stochastic distribution.
Thus, if acid digestion produces no difference between
D
13
C
18
O
16
O
2
and D
47
, we should find that CO
2
extracted from
these materials has a D
47
value of 0&. If we find some other
result, it could indicate a fractionation of associated with
acid digestion (as was suggested in the last section by the
dependence of D
47
values on extraction temperature).
Table 4 and Fig. 4 summarize the results of analyses of
CO
2
produced by acid digestion of these materials. We
find they yield CO
2
with D
47
values of 0.14 ± 0.03 (for
re-crystallized Sigma-carb standard), 0.22 ± 0.03 (for re-
crystallized MZ standard), and 0.25 ± 0.02 (for deep sea
coral 47413). These data suggest that CO
2
produced by
phosphoric acid digestion at 25 °C is subtly ($0.2&)
higher in D
47
than the D
13
C
18
O
16
O
2
value reactant carbonate.
The range of results for these re-crystallized materials is
greater than expected by analytical precision alone,
suggesting either that our heating experiments failed
to entirely equilibrate the starting materials at high
Table 4
Isotopic composition of carbon dioxide extracted from various carbonates before and after high-temperature recrystallization
Before re-crystallization After re-crystallization
Sample: D
47
d
13
C
PDB
d
18
O
SMOW
D
47
d
13
C
PDB
d
18
O
SMOW
47413 aragonite coral 0.74 ± 0.012 À6.51 41.43 0.28 ± 0.02 À7.82 40.21
MZ carbonate 0.64 ± 0.024 À13.15 35.18 0.22 ± 0.03 À13.82 34.74
Sigma carb 0.55 ± 0.025 À42.31 20.78 0.14 ± 0.03 À40.58 23.84
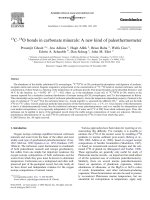
Fig. 4. Plot of the D
13
C
18
O
16
O
2
value (approximately equal to 1000 Æ (k
1
À 1),
where k
1
is the equilibrium constant of Reaction 1), as predicted by
Schauble and Eiler (2004); (left vertical scale; solid curve) and the D
47
value of CO
2
extracted from re-crystallized and synthetic calcites (see
legend), vs. 10
6
/T
2
. All data are averages of multiple extractions, where
appropriate (see Tables 4 and 5). Note that in the absence of any acid-
digestion fractionation D
47
of CO
2
extracted from carbonate minerals
should equal D
13
C
18
O
16
O
2
of reactant carbonate. Calcite and aragonite
recrystallized at high temperature are expected to yield CO
2
with D
47
near
0, and thus the higher observed values suggest an acid digestion
fractionation of ca. 0.1–0.2& (a value of 6 0.14& is preferred, for
reasons discussed in the text). The gray curve illustrates the Schauble and
Eiler (2004) model estimate for D
13
C
18
O
16
O
2
offset by this amount. The data
for calcites grown from aqueous solution show a correlation (r = 0.94)
between D
47
of extracted CO
2
and T
À2
, where T is the growth temperature
in Kelvin. This correlation line is shown as a thin black line. The dashed
extension of this line to lower values of 10
6
/T
2
is our hypothesis for the
relationship between carbonate growth temperature and D
47
of extracted
CO
2
at temperatures greater than 50 °C.
Fig. 3. Values D
47
for CO
2
extracted from Sigma-carb and NBS-19
standards at 25, 35, 45, 50 and 80 °C. The d
18
O value of product CO
2
decreases with increasing reaction temperature, with an average slope of
À0.028& per °C (see Table 3; this slope is similar to that found by Swart
et al., 1991). The D
47
value of product CO
2
decreases with increase in
reaction temperature, with an overall slope of À0.0016& per °C. Note that
NBS-19 analyses were made early in this study and lack the standardi-
zation, purification and replication of other data; they cannot be directly
compared to measurements of NBS-19 summarized in Table 2.
13
C–
18
O bonds in carbonate minerals:A new kind of paleothermometer 1447
temperatures or that these samples experienced different
degrees of re-equilibration during que nching. It is note-
worthy that the D
47
values of CO
2
extracted from these
materials after re-crystallization is positively correlated
with the D
47
values of CO
2
extracted from them before
re-crystallization (Table 4 and Fig. 4 ). This observation
supports the interpretation that our heating protocol
failed to fully equilibrate them during high-temperature
re-crystallization (e.g., perhaps coarse grains retain a core
that did not undergo re-crystallization and re-setting),
and, by extension, that Reaction 1 is highly resistant to
resetting in the absence of recrystallization. Therefore,
the lowest D
47
value measured in CO
2
released from
re-crystallized Sigma-carb (0.14&) likely represents the
maximum fractionation accompanying acid digestion.
Despite these ambiguities, both the dependence of D
47
of CO
2
on acid digestion temperature and the positive
D
47
values observed in CO
2
from high-temperature re-
crystallized carbonate support the interpretation that acid
digestion involves an isotopic fractionation of D
47
, and
that fraction ation must be controlled if one is to achieve
precise results for unknown samples (as one must do
when analyzing d
18
O of carbonates by phosphoric acid
digestion). Fortunately, in the case of D
47
the tempera-
ture effect on the acid-digestion fractiona tion is subtle
(0.0016& per °C), and so only need be controlled to
within ± 10–15 °C to keep errors smaller than the stan-
dard errors of our most precise measurements. Further
work will be needed to establish the exact amplitude of
the acid digestion fractionation and whether or not the
same fractionation applies to dolomites, magnesites, side-
rites and other non-CaCO
3
carbonates. For our present
purposes, we restrict ourselves to analysis of calcite and
aragonite at constant temperatures of acid digestion,
and discuss variability in D
47
of evolved CO
2
rather than
attempting to correct such data back to inferred values
of D
13
C
18
O
16
O
2
.
3.4. Calcite precipitated from aqueous solution at known,
controlled temperatures
We examined the influence of carbonate growth temper-
ature on the D
47
value of CO
2
extracted from carbonate by
analyzing CO
2
extracted from calcites grown in the labora-
tory at known, controlled temperatures from aqueous solu-
tions (see Section 2.1, above, for a description of the
methods used to synthesize these calcites). Table 5 summa-
rizes the results of these analyses, and Figs. 4 and 5 plot the
D
47
values of CO
2
extracted from these calcites vs. 10
6
/T
2
,
where T is the measured growth temperature, in Kelvin.
We also plot in Fig. 4 the value of D
13
C
18
O
16
O
2
predicted by
Schauble and Eiler (2004); for calcite that is in equilib rium
with respect to Reaction 1, and the results of analyses of
carbonates re-crystallized at 1100 °C. The data for calcites
grown from aqueous solution show a correlation between
the temperature of calcite precipitation and the D
47
value
carbon dioxide extracted from that calcite. A least-square
Table 5
Stable isotopic composition of synthetic calcites and natural aragonitic
corals grown at known temperatures
Sample
details
Growth
temperature
(°C)
d
18
O water
SMOW
d
13
C
PDB
d
18
O
PDB
D
47
Calcite HA12 50 ± 2 À8.09 À21.53 À15.53 0.53
À21.57 À15.61 0.60
À21.58 À15.64 0.59
À21.59 À15.64 0.54
À21.59 À15.64 0.53
À21.59 À15.65 0.58
À21.59 À15.65 0.54
À21.59 À15.64 0.55
Average À21.58 À15.62 0.55
Standard error 0.021 0.040 0.011
Calcite HA3 1 ± 0.2 À7.6 À25.47 À5.21 0.77
À25.47 À5.26 0.68
À25.47 À5.26 0.80
À25.47 À5.26 0.75
À25.46 À5.26 0.71
À25.47 À5.27 0.79
À25.47 À5.25 0.72
À25.47 À5.27 0.81
À25.46 À5.27 0.81
À25.47 À5.26 0.83
À25.47 À5.28 0.85
Average À25.47 À5.26 0.77
Standard error 0.004 0.019 0.016
Calcite HA9 33 ± 2 À7.37 À21.58 À11.34 0.65
À21.59 À11.37 0.61
À21.59 À11.38 0.61
À21.59 À11.38 0.53
À21.59 À11.37 0.63
À21.59 À11.36 0.59
Average À21.59 À11.37 0.60
Standard error 0.01 0.01 0.015
Calcite HA1 23 ± 1 À7.47 À17.52 À10.48 0.74
À17.53 À10.50 0.55
À17.53 À10.50 0.64
À17.53 À10.49 0.70
À17.53 À10.49 0.66
À17.53 À10.49 0.62
Average À17.53 À10.49 0.65
Standard error 0.01 0.01 0.025
Calcite HA2 23 ± 1 À7.54 À24.81 À10.30 0.70
À24.82 À10.31 0.75
À24.82 À10.31 0.73
À24.82 À10.32 0.67
À24.81 À10.30 0.71
Average À24.81 À10.31 0.71
Standard error 0.005 0.008 0.014
Calcite HA7 23 ± 1 À7.88 À23.72 À11.16 0.58
À23.75 À11.22 0.64
À23.75
À11.22 0.55
À23.75 À11.23 0.65
À23.75 À11.22 0.69
Average À23.74 À11.21 0.62
Standard error 0.01 0.03 0.025
(continued on next page)
1448 P. Ghosh et al. 70 (2006) 1439–1456
linear fit to these data yields the relationship (with correla-
tion coefficient r = 0.94):
D
47
¼ 0:0592 Á 10
6
Á T
À2
À 0:02.
Note that this equation relates the D
47
value of carbon
dioxide produced by phosphoric acid digestion of carbon-
ate to the growth temperature of that carbonate. This is
the simplest way to derive a paleotemperature equation
directly from our data, but keep in mind that it reflects a
combination of the temperature dependence of Reaction
1 and a 6 0.14& enrichment in D
47
relative to D
13
C
18
O
16
O
2
caused by acid digestion at 25 °C. Note also that this rela-
tionship might not be suitable for extrapolation to temper-
atures greater than 50 °C because we know from analysis of
high-temperature re-crystallized calcites that the trend
could pass through a D
47
value as high as 0.14& when
10
6
/T
2
approaches 0. Nevertheless, this equation is suitable
for interpolation and we suggest that it should be used for
paleothermometry in the temperature range 1–50 °C until
data become available for higher temperature experimental
carbonates. The temperature sensitivity of this equation,
combined with the best analytical precision for D
47
that
we have achieved on homogenized, high-purity calcite
(ca. ±0.01&), implies that Reaction 1 can be used to per-
form carbonate paleothermometry at near-earth-surface
temperatures with precision of ca. ± 2 °C.
3.5. Analysis of natural corals grown at known,
approximately constant temperatures
We find that our sample of Porites coral collected from
the Sumatran surface ocean yields CO
2
having a D
47
value
of 0.63&. When plotted in Fig. 5 at this coralÕs inferred
growth temperature (29.3 ± 2 °C), this result is consistent
with the temperature dependence we determined for syn-
thetic calcite. Similarly, our analyses of two samples of
the deep-sea coral, D. dianthus, yield D
47
values of
0.74& (sample 47407, grown at 5 ± 1 °C) and 0.75&
(sample 47413, grown at 8 ± 0.5 °C). These results are
generally consistent with our inorganic calcite calibration
(Fig. 5), although coral 47413 falls above that calibration
by slightly more (0.02) than analytical uncertainty. All
three of these corals are aragonitic, rich in organic matter,
and, exhibit Ôvital effectsÕ in their d
18
O and d
13
C values
(subtle in the case of Sumatran Porites; variable and se-
vere in the case of deep-sea D. dianthus). The fact that
all three samples yield results broadly consistent with
our inorganic calcite calibration curve indicates several
important things about the analysis of D
47
values in nat-
ural carbonates:
• First,aragoniteandcalcite appear toexhibitthesamerela-
tionship between carbonate growth temperature and the
D
47
value of CO
2
produced by phosphoric acid extraction.
• Second, vital effects that influence d
18
O and d
13
C of bio-
logically mediated carbonate appear not to strongly
influence D
47
values of CO
2
extracted from that carbon-
Table 5 (continued)
Sample
details
Growth
temperature
(°C)
d
18
O water
SMOW
d
13
C
PDB
d
18
O
PDB
D
47
Calcite HA4 50 ± 2 À7.45 À26.38 À14.67 0.52
À26.38 À14.71 0.51
À26.38 À14.71 0.56
À26.38 À14.70 0.58
À26.39 À14.70 0.61
À26.38 À14.71 0.56
À26.38 À14.70 0.52
Average À26.38 À14.70 0.55
Standard error 0.004 0.015 0.014
Deep sea corals
47407 5.5 ± 1.0
(Adkins et al.,
2003)
0.3 ± 0.2 À2.51 0.95 0.76
À2.51 0.95 0.70
À2.51 0.94 0.75
Average À2.51 0.95 0.74
Standard error 0.002 0.004 0.019
47413 8.0 ± 0.5
(Adkins et al.,
2003)
— À6.52 À0.04 0.77
À6.51 À0.05 0.74
À6.52 À0.05 0.74
À6.52 À0.05 0.74
Average À6.51 À0.05 0.74
Standard error 0.003 0.003 0.012
Surface coral
Indonesian
Surface Coral
Mm97-Bc
($1960)
29.3 ± 2 — À1.54 À5.27 0.63 ± 0.034
Fig. 5. Values of D
47
of CO
2
extracted from calcites grown from aqueous
solution (reproduced from Fig. 4) and of deep-sea and surface corals,
plotted vs. 10
6
/T
2
, where T is the known growth temperature in Kelvin.
Note that both surface and deep-sea aragonitic corals generally conform
to the trend defined by inorganic calcites. Deep-sea coral 47413 lies slightly
(0.02&) above this trend, perhaps suggesting a subtle Ôvital effectÕ (this
aliquot of this sample exhibits extreme vital effects on its d
13
C and d
18
O
values; Table 5).
13
C–
18
O bonds in carbonate minerals:A new kind of paleothermometer 1449
ate. This is consistent with models for the vital effect,
which assume that carbonate deposition occurs in local
isotopic eq uilibrium (Bohm et al., 2000; Adkins et al.,
2003). These models describe the vital effect by way of
reservoir effects on the sampled C and O pools, not
through kinetic fractionations. The equilibrium constant
for Reaction 1 is independent of bulk isotopic composi-
tion, and so should not be sensitive to such reservoir
effects. Note, however, that the aliquot of sample
47413 analyzed here has the greatest vital effect on its
d
13
C and d
18
O values (Table 5; see also Adkins et al.,
2003), and is the one sample to fall slightly above the
inorganic calibration line. Thus, it is possible that vital
effects produce a small increase in D
47
relative to that
predicted for inorganic calcite. Nevertheless, it is clear
from Fig. 5 that this is a second-order perturbation on
the general conformance of biogenic aragonite to our
inorganic calcite calibration line.
• Finally, organic contaminants are potentially problem-
atic for measurements of D
47
, and so it is significant that
these measurements yielded an easily interpreted result
despite the large concentration of organic matter in
the analyte corals. This result suggests that our CO
2
purification procedures are successful at removing what-
ever volatile organic contaminants might be produced
by acid digestion of natural corals.
3.6. Speculations and initial evidence regarding the kinetics
of
13
C–
18
O ‘clumping’
All geothermometers are meaningful only if one has a
clear understanding of the geological environments in
which they reach equilibrium and the effects of subsequent
processes on re-setting that equilibrium. It seems likely to
us, based on the known rapid kinetics of carbonate acid-
base chemistry in aqueous solution (Zeebe et al., 1999)
and previous experience with the kinetics of the carbon-
ate–water oxygen isotope thermometer (Spero et al.,
1997), that carbonate precipitation from water or re-crys-
tallization in the presence of water often achieves or close-
ly approaches local equilibrium with respect to Reaction 1
at any temperature P0 °C (perhaps low er in the case of
carbonates grown from brines or other low-temperature
solutions). This inference is supported by our observation
that carbonates grown in the temperature range 1–50 °C,
both inorganically and biologically, are enriched in
13
C–
18
O bonds by ca. 0.5–0.7&, as expected by theory
(Fig. 5). Note, however, that some processes, such as
air–sea exchange and biological carbonate precipitation,
can involve rapid, selective transport of dissolved inorgan-
ic carbon species, and consequential departures from local
equilibrium with respect to oxygen isotope exchange reac-
tions (Zeebe et al., 1999). We suspect such aqueous envi-
ronments might also generate non-equilibrium
abundances of
13
C–
18
O bonds in dissolved inorganic car-
bon species, and thus in the carbonate minerals grown
from such species.
The preservation of growth temperatures through later
geological history raises a separate and more complicated
set of questions: First, if carbonate grows at low tempera-
ture and is then heated without re-crystallization, at what
temperatures and after what times will it re-equilibrate to
take on the new, higher-temperature distribution? This
question must be addressed before we can know how deep-
ly buried a carbonate must be before it ceases to faithfully
record its original precipitation temperature. Second, if a
carbonate grows or re-crystallizes at high temperature
and then cools, what will be the Ôblocking temperatureÕ at
which Reaction 1 stops continuously re-equilibrating? This
question must be answered before we can apply the
13
C–
18
O carbonate thermometer to high-temperature meta-
morphic rocks.
These and related questions cannot be answered without
studying the systematics of D
47
measurements of CO
2
extracted from carbonates having high-temperature histo-
ries, and calibration of the
13
C–
18
O order/disorder carbon-
ate thermometer above 50 °C. Such work is beyond the
scope of this study, although we can comment on several
relevant observations found here. First, our attempts to
re-crystallize calci te and aragonite at 1100 °C were only
partially successful, based on the fact that differences in
13
C–
18
O ordering among starting mate rials were not com-
pletely erased (Fig. 4 and Table 5). This suggests that Reac-
tion 1 is surprisingly refractory to re-equilibration at high
temperatures. Second, NBS-19 and MAR-J1 are calcites
from Italian marbles that were metamorphosed to upper-
greenschist facies during the mid-Tertiary and must have
spent several (perhaps even tens of) million years in the
shallow crust at temperatures below 200 °C(Molli et al.,
2000). Carbon dioxide extracted from them has D
47
values
of 0.34–0.35&. If the dashed curve linking our high- and
low-temperature experimental data in Fig. 4 is correct,
these values imply an apparent temperatures near ca.
200 °C. These data suggest that the Ôblocking temperatureÕ
of the
13
C–
18
O clumping reaction is significantly higher
than earth-surface temperatures, even in rocks that have
sat for millions of years at lower temperatures. These data
are not yet sufficient for a quantitative analysis of the kinet-
ics of Reaction 1, but point toward it being suitably refrac-
tory for preserving paleotemperatures over geological time
scales, so long as re-crystallization has not occurred.
3.7. The seasonal cycle in
13
C–
18
O ordering in Porites coral
from the northern Red Sea
In this section, we discuss an application of the
13
C–
18
O
order/disorder carbonat e paleothermometer to a recent
Porites coral from the northern Red Sea. This thermometer
has an ideal precision of ± 2 °C, 1r, and the sample we
examine is believed to have grown over only a ca. 6–
10 °C temperature range (for reasons discussed below).
Therefore, it should be possible for us to detect seasonality
in growth temperature of this coral, but only if our meth-
ods can consistently generate data on natural materials
1450 P. Ghosh et al. 70 (2006) 1439–1456
with precision of ± 0.01–0.02& . This study is principally a
test of the ÔpracticalÕ limits to precision of our data. Seren-
dipitously, these data also provide suggestive evidence for a
vital effect or other artifact that produces a non-equilibri-
um
13
C–
18
O ordering in at least some corals under some
conditions (perhaps confirming our suggestion, above,
regarding deep-sea coral 47413; see Fig. 5).
The nor thernmost Red Sea experiences unusually large
seasonal variations in sea-surface temperature (SST) be-
tween winter minima averaging 21.2 °C and summer max-
ima averaging 27.6 °C(Rayner et al., 1996), but varying
from place to place and year to year. Winter minima aver-
age 21.2 °C whereas summer maxima average 27.6 °C.
Super-imposed on this seasonality is an inter-annual to
decadal variability of ca. 1–2 °C. Note also that near-sur-
face water temperatures in shallow coastal waters can expe-
rience local excursions outside the range observed by
regional instrument records.
The Ras Muhammed Peninsula is surrounded by a nar-
row fringing shallow-water reef, including coral colonies
growing at a water depth of $5 m. Sample BRI-1 of Porites
lutea was sampled in July, 1995 at Beacon rock (27°50.9
0
N,
34°18.6
0
E) located on the south side of the Ras Muhammed
Peninsula, within the boundaries of Ras Muhammed
National Park and near the southern tip of the Sinai Penin-
sula (Egypt). A core was collected from a hemispherical coral
colony using an underwater pneumatic drill. The core was
drilled vertically, parallel to the major axis of coral growth.
An X-ray radiograph of BRI-1 reveals density bands
that we interpret as a seasonal growth pattern. We initially
sampled this coral at 1-mm increments (measured perpen-
dicular to the growth banding) using a low-speed drill.
Splits of the drilled powders were reacted with phosphoric
acid at 90 °C in a mo dified auto carbonate device and the
purified CO
2
analyzed for d
13
C and d
18
O on a gas source
stable isotope ratio mass spectrometer located at the stable
isotope laboratory in Department of Earth and Planetary
Sciences, Harvard University, Cambridge, Massachusetts.
Additional splits of the same drilled powders were analyzed
for Sr /Ca ratio by isotope dilution on an ICP-AES at Har-
vard. Both of these sets of measurements used techniques
that have been previously described (Billups et al., 2004)
and will be detailed further in a later publication. The re-
sults of these measurements are listed in Table 6 and plot-
ted in Fig. 6. All three variables exhibit a seasonal cycle;
maximum d
18
O values and Sr/Ca ratios and minimum
d
13
C values correspond to cold winter temperatures (mid
February) and the converses correspond to warmer sum-
mer temperatures. The strong seasonality in geochemical
variables also corresponds to the density-banding pattern
observed in the X-ray radiograph (low density corresponds
to summer; high density corresponds to winter).
The arid climate in the northern Red Sea results in large
and seasonally varying evaporative enrichments in the d
18
O
of surface water, which prohibit straightforward applica-
tion of the conventional carbonate–water oxygen isotope
exchange thermometer to the d
18
O record in Fig. 6 (see Fel-
is et al., 2000). If we adopt Felis et al.Õs (2000) empirical cal-
ibration of the d
18
O
carbonate
thermometer in this region, we
conclude that our sample (which varies in d
18
O
PDB
from
À2.31& to À3.79&) grew at temperatures between 17.3
and 26.3 °C. Similarly, the Sr/Ca paleothermometer exhib-
its regional and genus-specific variations in its calibration
that translate into errors of up to 4–6 °C if an inappropri-
ate calibration is used (Marshall and McCulloch, 2002).
However, Felis et al. (2004), present an empirical calibra-
tion for Red Sea corals that could be appropriate for our
sample. If we apply this calibration to our record (which
varies in Sr/Ca variation of from 9.08 and 9.62 · 10
À3
),
we find that it grew at temperatures between 28.5 and
19.5 °C. Both reco rds imply summer temperature maxima
of ca. 26–28 °C, similar to instrument records for the
northern Red Sea (Genin et al., 1995), but winter minima
of 17–20 °C, several degrees colder than the average for
those records. These data suggest that D
47
of CO
2
extracted
from BRI-1 should vary by ca. 0.05&, betw een a summer
minimum of ca. 0.63 and a winter maximum of ca. 0.68.
We re-sampled this coral core by cutting a slab parallel
to the drilled transect shown in Fig. 7 and slowly rubbing it
against an abrasive tool and recovering the powder this
produced. This was done instead of drilling in order to
minimize the possibility of distu rbing the
13
C–
18
O Ôclump-
ingÕ in carbonate by frictional heating. Our average sample
spacing is 1–1.5 mm. The average growth rate of the coral
varies between $10 and 20 mm/year; the interval we sam-
pled corresponds to a summer with two Sr/Ca minima
(temperature maxima) separated by a brief, low-amplitude
Sr/Ca maximum (at $65 mm sampling distance), a broad,
strong winter Sr/Ca maximum (tem perature mini mum) at
$75 mm, a broad, strong summer Sr/Ca minimum at
$85 mm, and a fall rise in Sr/Ca terminating at $90 mm.
Recovered powders were reacted with phosphoric acid
at 25 °C and their product CO
2
analyzed for d
13
C, d
18
O
and D
47
, as for previous measurements described in this pa-
per (Table 6). All extracted CO
2
samples were analyzed five
times, so the expected, average external precision in D
47
for
each sample should be ca. ± 0.013. We assume that the
acid digestion fractionation and the D
47
temperature
calibration for Porites lutea is the same as that for inorgan-
ic calcite (as appears to be true for Sumatran Porites coral
and approximately true for deep-sea D. dianthus coral;
Fig. 5). However, note that Red Sea corals have atypical
calibrations of their Sr/Ca and d
18
O paleothermometers
(Felis et al., 2000, 2004), and so we sh ould perhaps be alert
to the possibility of an unusual temperature sensitivity in
the clumped isotope thermometer.
Table 5 lists the d
18
O and d
13
C of BRI-1 coral (corrected
for acid fractionation) and the D
47
value of CO
2
extracted
from that same coral (not corrected for acid fractionation;
i.e., these data can be directly compared with the experi-
mental data in Figs. 4 and 5). The variations in d
18
O and
d
13
C we observe are consistent with those previously ana-
lyzed on samples drilled from the same coral head
(Fig. 6). Because the growth bands in this coral are curved
13
C–
18
O bonds in carbonate minerals:A new kind of paleothermometer 1451
and vary in thickness, we can only roughly correlate our
samples with those previously analyzed for Sr/Ca. Our
re-sampled interval lies closest to the band between 70
and 90 mm on the distance scale used in Fig. 6, but with
an uncertainty on the order of several mm. Therefore, we
used d
13
C values measured in both sets of samples (Figs.
6B and 7, inset) to correlate measurements of D
47
in one
sample suite with measurements of Sr/Ca ratio in the other.
Fig. 7 compares the Sr/Ca ratio and D
47
stratigraphy,
after spatially aligning the two data sets as described above.
These Sr/Ca data are a sub-set of those shown in
Fig. 6. Curves are fit through both data sets using an expo-
nential smoothing technique ( />glossary_v1.1/tsd.html#smooth) contained within the
SigmaPlot
Ò
software package (www.systat.com/products/
SigmaPlot/). Values of D
47
exhibit spatial variations consis-
tent with a quasi-sinusoidal curve having a period of
$20 mm—similar to the seasonal cycles in Sr/Ca, d
18
O
and d
13
C. Thus, the first-order test we make in this sec-
tion—attempting to retrieve a coherent seasonal cycle from
a low-amplitude record—appears to have succeeded.
The Sr/Ca curve exhibits three minima over the interval
sampled for D
47
: one at $85, one at $68 mm and one at
$62 mm. These latter two minima are separated by a
low-amplitude maximum that likely reflects a summer or
fall temperature anomaly rather than a winter. All of these
Fig. 6. Seasonal cycle in Sr/Ca ratio (A), d
13
C (B) and d
18
O (C) for 5 continuous annual bands from the Red Sea coral, of BRI-1. Maximum d
18
O values
and Sr/Ca ratios and minimal d
13
C values correspond to cold winter temperatures and the converses correspond to warmer summer temperatures. The
variations in Sr/Ca ratios between 9.08 and 9.62 · 10
À3
correspond to a temperature range of between 28.5 and 19.5 °C, respectively, and variations in
d
18
O between À2.31& to À3.79& correspond to a temperature range of between 17.3 and 26.3 (both based on the calibrations of Felis et al., 2000). The
horizontal distance scale is the distance, in millimeters, from a point in the coral interior, and is measured perpendicular to growth banding visible to the
naked eye.
1452 P. Ghosh et al. 70 (2006) 1439–1456
minima correspond to minima in D
47
. Similarly, both the
winter maximum in Sr/Ca ratio at $75 mm and the fall rise
in Sr/Ca at $90 correspond to two maxi ma in D
47
(we did
not measure the D
47
value of carbonate corresponding to
the low-amplitude maximum in Sr/Ca ratio at $65 mm)
(Fig. 7B). Thus, variations in Sr/Ca ratio and D
47
value
are in phase with one another and have the same sign, as
expected if growth temperature controls both varia bles.
The three minima sampled by our traverse have average
D
47
values of between 0.64 and 0.65 (± 0.01), corresponding
to apparent temperatures of between 26.5 and 24.5 (±2) °C,
respectively. These are consistent with summer maximum
temperatures in the northern Red Sea, both as observed in
instrument records and as inferred from interpretations of
the d
18
O and Sr/Ca variations of Red Sea corals (Felis
et al., 2000, 2004). Similarl y, the late fall samples near
90 mm have an average D
47
of 0.70 ± 0.02, corresponding
to an apparent temperature of 15 ± 4. This average is lower
than expected based on Sr/Ca and d
18
O records , but overlaps
at the 1r level the independently estimated winter tempera-
ture minimum. We have not bracketed this value with data
for coral grown the following spring, so it is possible that
we did not sample its maximum D
47
value. Nevertheless,
these data that do exist are consistent with the expected tem-
perature variations. In these, respects, the carbonate
clumped isotope thermometer appears to have successfully
retrieved the known sea surface temperature history of the
northern Red Sea, as recorded in BRI-1.
However, there is one noteworthy complication to our
data set for BRI-1: The winter maximum D
47
value ob-
served near the sampling distance of 75 mm averages
0.74 ± 0.01, corresponding to an apparent temperature
of 8 ± 2 °C—far lower than expected (Fig. 7B; expected
D
47
values are shown by a dashed curve). It seems unlike-
ly to us that this discrepancy reflects analytical error be-
cause five closely spaced samples precisely define this
high D
47
value. It also seems unlikely that this discrepancy
reflects true, lower-than expected wi nter temperatures at
which BRI-1 grew, simply based on the weight of evi-
dence from Sr/Ca and d
18
O thermometry (although both
are based on empirical calibrations and might not have
captured locally extreme temperatures experienced by
the shallow-water sample we have studied). The only
remaining possibility that occurs to us is that the temper-
ature calibration for the carbonate clumped isotope ther-
mometer in this sample of Porites lutea is more
temperature sensitive than in inorganic calcite due to a vi-
tal effect. This is unexpected both because of the success
of our application of the inorganic calibration to Suma-
tran Porites and deep-sea D. dianthus corals and because
the inorganic calibration yielded acceptable temperatures
for the summer, spring and fall parts of the BRI-1 record.
Nevertheless, we hypothesize that the winter band in this
sample grew under conditions that promoted an unknown
vital effect and drove up the D
47
value to values ca.
0.04 ± 0.01& higher than the thermodynamic equilibrium
at its growth temperature. We speculate that this vital ef-
fect might be associated with slower than average growth
during winter months, although there is insufficient infor-
mation as yet to speculate on its physical cause. We ex-
Fig. 7. (A) Reproduces the Sr/Ca ratio of BRI-1 coral from the last 30 mm of the traverse illustrated in Fig. 6. (B) Shows the D
47
value of CO
2
extracted
from aragonite recovered from a re-sampling of the same coral. The inset shows the goodness of fit between the two d
13
C data sets used to match the re-
sampled D
47
traverse with the original Sr/Ca traverse. The curves through both data sets in (A and B) are fit using a Gaussian smoothing technique and
emphasize the seasonal cycle. The dashed curve in (B) indicates the D
47
value predicted based on the Felis et al. (2000); calibration of the Sr/Ca record and
the calibration of the D
47
temperature sensitivity shown in Figs. 4 and 5. Values of D
47
exhibit spatial variations consistent with a quasi-sinusoidal curve
having a period of $20 mm—similar to the seasonal cycles in Sr/Ca, d
18
O and d
13
C. The maxima and minima in Sr/Ca and D
47
line up with one another,
as expected. However, the amplitude of D
47
variations is greater than expected, perhaps reflecting a vital effect acting during winter growth in this coral.
13
C–
18
O bonds in carbonate minerals:A new kind of paleothermometer 1453
pect that a vital effect should lead to a correlation be-
tween D
47
and d
13
C, which is not observed. We suggest
the most useful next step towards advancing these prob-
lems will be detailed study of cultured corals and other
carbonate-precipitati ng organisms.
4. Summary and future directions
Ordering of
13
C and
18
O into bonds with each other within
the crystal lattice of carbonate minerals is a temperature-de-
pendent phenomenon that can be characterized by analysis
of
13
C
18
O
16
OinCO
2
produced by phosphoric acid digestion.
Phosphoric acid digestion appears to produce a small
(60.14&) enrichment in
13
C
18
O
16
O relative to proportions
of
13
C
18
O
16
O
2
2À
carbonate ions in reactant carbonate miner-
als, but this effect depends only weakly to acid reaction tem-
perature (0.0016& per °C) and so is relatively easily
controlled.
Analyses of natural and synthetic carbonates grown at
known temperatures demonstrate that Ôclumpin g Õ of
13
C
and
18
O isotopes in calcite and aragonite is subtle at
earth-surface temperatures (ca. 0.7& enrichments in
13
C–
18
O bonds compared to their expected abundance in
a material with randomly distributed stable isotopes).
Moreover, the temperature dependence of this effect is sub-
tle (the range is ca. 0.75–0.50& between 1 and 50 ° C,
respectively). Nevertheless, proportions of
13
C–
18
O bonds
in carbonates can be measured consistently with external
precision as good as 0.01–0.02&, even in complex natural
materials, and so this thermometer can constrain growth
temperature with precision as good as ± 2 °C. This uncer-
tainty is too large for some problems (e.g., Pleistocene
tropical SST variations, which are thought to be a few de-
grees or less) but sufficient for resolving many problems in
paleoclimate research, meteoritics and the thermal history
of soil s and shallow crustal rocks.
The most important feature of the carbonate clumped
isotope thermometer is that it is based on a homogeneous
equilibrium, and thus it is rigorously defined based only
on measurements of the isotopic content of carbonate min-
erals. That is, it is independent of the isoto pic composition
of water from which carbonate grew, or of any other phase
with which carbonate might have co-existed. For this rea-
son, it does not suffer from the Ôice volume problemÕ and
analogous problems with carbonate–water exchange ther-
mometers, which are rigorously defined only when the
composition of carbo nates and waters from which they
grew are independently known. Also, the clumped isotope
thermometer is based on a thermodynamic exchange equi-
librium, and so is suitable for interpolation and applica-
tions to past times and diverse settings, unlike various
empirical phylogenitic or morphological thermometers.
Analyses of biogenic aragonite from deep-sea and sur-
face corals grown at known temperatures generally con-
form to the inorganic calibration of the carbonate
clumped isotope thermometer; this includes samples of D.
dianthus corals that exhibit pronounced Ô vital effectsÕ in
their d
13
C and d
18
O values. Thus, there does not generally
appear to be a Ô vitalÕ effect in biological materials. Howev-
er, the D. dianthus specimen showing the greatest Ôvital ef-
fectÕ releases CO
2
that is higher in D
47
than expected by our
inorganic calibration (by just more than analytical preci-
sion); similarly, seasonal variability in D
47
in CO
2
from
Red Sea Porites coral suggests winter growth may be asso-
ciated with an anomalous enrichment in
13
C–
18
O Ôclump-
ingÕ. We are unsure what physical processes might be
responsible for such an effect, and suggest future studies
of cultured organisms grown under controlled conditions
will be required to fully understand it.
Analysis of carbonates that have undergone high-tem-
perature re-crystallization followed by slow cooling sug-
gests the blocking temperature of the carbonate clumped
isotope therm ometer (i.e., the tempe rature at which it ceas-
Table 6
Results of D
47
and Sr/Ca analyses of red sea coral (BRI-1) sample
Filed re-sampling Drilled transect
Sample
No.
Distance
(mm)
D
47
Standard
error
Distance
(mm)
Sr/Ca d
13
C
PDB
d
18
O
PDB
A36 63.03 0.63 0.03 48 9.38 À1.29 À 3.24
A35 64.03 0.63 0.03 49 9.28 À1.32 À 3.30
A33 67.03 0.64 0.03 50 9.2 À1.28 À3.23
A32 68.03 0.65 0.03 51 9.17 À0.43 À 3.35
A31 69.18 0.69 0.02 52 9.13 À0.91 À 3.34
A29 70.84 0.72 0.01 53 9.2 À1.17 À3.13
A28 71.39 0.72 0.03 54 9.29 À1.05 À 2.99
A27 72.27 0.72 0.02 55 9.38 À1.00 À 2.96
A26 73.24 0.77 0.00 57 9.43 À1.41 À 2.52
A25 73.94 0.75 0.01 58 9.47 À1.78 À 2.62
A24 74.75 0.74 0.03 59 9.49 À1.57 À 2.79
A23 75.71 0.75 0.01 60 9.38 À1.39 À 3.01
A22 76.56 0.67 0.02 61 9.31 À1.38 À 3.11
A21 76.97 0.77 0.03 62 9.26 À1.06 À 3.22
A19 78.88 0.68 0.02 63 9.27 À0.87 À 3.15
A18 79.53 0.64 0.02 64 9.24 À1.12 À 3.22
A17 79.83 0.69 0.01 65 9.31 À0.94 À 3.29
A16 80.23 0.69 0.02 66 9.35 À0.67 À 3.37
A15 80.89 0.63 0.03 67 9.27 À1.02 À 3.35
A14 81.68 0.64 0.01 68 9.24 À1.20 À 3.21
A13 82.74 0.67 0.03 69 9.25
À1.21 À3.08
A12 83.38 0.65 0.02 70 9.33 À1.15 À 2.91
A10 84.75 0.64 0.03 71 9.45 À1.22 À 2.69
A9 85.61 0.65 0.00 72 9.49 À1.59 À2.48
A8 86.33 0.72 0.01 73 9.61 À1.97 À2.46
A7 86.82 0.68 0.01 74 9.6 À2.18 À2.50
A6 87.36 0.73 0.03 75 9.56 À1.95 À2.69
A5 87.95 0.68 0.03 76 9.54 À1.82 À2.77
A4 88.50 0.68 0.02 77 9.44 À1.51 À2.90
A2 89.64 0.71 0.02 78 9.37 À1.46 À3.05
79 9.32 À1.21 À3.22
80 9.24 À1.01 À3.23
81 9.25 À0.99 À3.23
82 9.22 À0.71 À3.40
83 9.21 À0.81 À3.29
84 9.22 À1.12 À3.20
85 9.24 À1.12 À3.15
86 9.25 À0.93 À3.11
87 9.26 À1.30 À3.06
88 9.28 À1.66 À2.78
89 9.4 À
2.05 À2.45
1454 P. Ghosh et al. 70 (2006) 1439–1456
es to continuously re-equilibrate over geological timescales)
is on the order of 200 °C. Thus, is seems likely that the sub-
surface environm ents amenable to study by this approach
will be those reached during diagenesis, catagenesis, burial
metamorphism, anchimetamorphism, some types of ore
formation, meteoritic aqueous alteration and similar envi-
ronments in which water is abundant and temperatures
are in the range 0–200 °C.
Data presented here calibrate the
13
C–
18
O order/disorder
carbonate thermometer for inorgani c calcite between 1 and
50 °C, and document its applicability to biogenic aragonite.
However, several additional studies are needed to fully
flesh-out this thermometerÕs calibration. High-temperature
experiments, perhaps using hydrothermal and/or piston-
cylinder apparatus, are needed to define the temperature
sensitivity of
13
C–
18
O bond formation above 50 °C. Exper-
iments on carbonates other than calcite and aragonite are
needed at all tempe ratures; calibration data for dolomi te
will be particularly useful for studies of ancient carbonate
sediments. Additional constraints on the kinetics of
13
C–
18
O ordering during diagen esis, low-grade metamor-
phism and cooling of high-temperature rocks will be neces-
sary before the carbonate clumped-isotope thermometer
can be confidently applied to these important upper-cr ustal
environments.
Acknowledgments
This study was conducted in response to Michael Bend-
erÕs good-natured prodding of J.M.E. and J.F.A.; we thank
him for his insightful instincts and persistence. We grateful-
ly acknowledge the help of Lisa Welp, who measured the
d
18
O values of water from which we grew inorganic cal-
cites, Ma Chi, who helped with XRD analyses of synthetic
carbonates, and Dr. Willi Brand, who provided aliquots of
MAR-J1 carbonate standard. We also thank the Smithso-
nian Institute for lending us deep-sea coral samples. This
work made use of an instrument purchased with the help
of NSF Grant EAR-0220066 and the Packard Foundation,
and benefited from salary support provided by NSF Grant
EAR-0345905.
Associate editor: Miryam Bar-Matthews
References
Abram, N.J., Gagan, M.K., McCulloch, M.T., Chappell, J., Hantoro,
W.S., 2003. Coral reef death during the 1997 Indian Ocean Dipole
Linked to Indonesian Wildfires. Science 301, 952–955.
Adkins, J.F., McIntyre, K., Schrag, D.P., 2002. The salinity, temper-
ature, and delta O-18 of the glacial deep ocean. Science 298, 1769–
1773.
Adkins, J.F., Boyle, E.A., Curry, W.B., Lutringer, A., 2003. Stable
isotopes in deep sea corals and a new mechanism for ‘‘vital effect’’.
Geochim. Cosmochim. Acta 67, 1129–1143.
Affek, H., Eiler, J., 2006. Abundance of mass 47 CO
2
in Urban air, car
exhaust and human breath. Geochim. Cosmochim. Acta. 70, 1–12.
Bigeleisen, J., Mayer, M.G., 1947. Calculation of equilibrium constants
for isotopic exchange reactions. J. Chem. Phys. 15, 261–267.
Billups, K., Rickaby, R.E.M., Schrag, D.P., 2004. Cenozoic pelagic Sr/Ca
records: exploring a link to paleoproductivity. Paleocenography 19,
Art. No. PA3005.
Bohm, F., Joachimski, M.M., Dullo, W.C., Eisenhauer, A., Lehnert, H.,
Reitner, J., Worheide, G., 2000. Oxygen isotope fractionation in
marine aragonite of coralline sponges. Geochim. Cosmochim. Acta 64,
1695–1703.
Dansgaard, W., Tauber, H., 1969. Glacier oxygen-18 content and
Pleistocene ocean temperatures. Science 166, 499.
Eiler, J.M., Schauble, E., 2004.
18
O
13
C
16
O in earthÕs atmosphere. Geochim.
Cosmochim. Acta 68, 4767–4777.
Emiliani, C., 1955. Pleistocene temperature. J. Geol. 63, 538–578.
Emiliani, C., 1966a. Isotopic paleotemperature. Science 154, 851–857.
Emiliani, C., 1966b. Paleotemperature analysis of Caribbean cores P6304-
8 and P6304-9 and a generalized temperature curve for past 425000
Years. J. Geol. 74, 109.
Epstein, S., Buchsbaum, R., Lowenstam, H., Urey, H.C., 1953. Revised
carbonate water isotopic temperature scale. Bull. Geol. Soc. Amer. 64,
1315–1326.
Felis, T., Patzold, J., Loya, Y., Fine, M., Nawar, A.H., Wefer, G., 2000. A
coral oxygen isotope record from the Northern Red sea documenting
NAO, ENSO, and North Pacific teleconnections on the Middle East
climate variability since the year 1750. Palaeoceanography 15, 679–694.
Felis, T., Lohmann, G., Kuhnert, H., Lorenz, S.J., Scholz, D., Patzold, J.,
Al-Rousan, S.A., Al-Moghrabi, S.M., 2004. Increased seasonality in
Middle East temperatures during the last interglacial period. Nature
429, 164–168.
Friedman, I., OÕNeil, J.R., Cebula, G., 1982. Two new carbonate stable
isotope standards. Geostandard Newslett. 6, 11–12.
Genin, A., Lazar, B., Brenner, S., 1995. Vertical mixing and coral death in
the Red Sea following the eruption of Mount Pinatubo. Nature 377,
507–510.
Ghosh, P., Patecki, M., Rothe, M., Brand, W.A., 2005. Calcite-CO
2
mixed
into CO
2
free air: a new CO
2
-in-air stable isotope reference material for
the VPDB Scale. Rapid Commun. Mass Spectrom. 19, 1097–1119.
Kim, S.T., OÕNeil, J.R., 1997. Equilibrium and non-equilibrium oxygen
isotope effects in synthetic carbonates. Geochim. Cosmochim. Acta 61,
3461–3475.
Leiss, B., Molli, G., 2003. High temperature texture in naturally deformed
Carrara marblefrom theAlpi Apuane,Italy. J. Struct. Geol. 25, 649–658.
Marshall, J.F., McCulloch, M.T., 2002. An assessment of the Sr/Ca ratio
in shallow water hermatypic corals as a proxy for sea surface
temperature. Geochim. Cosmochim. Acta. 66, 3263–3280.
McCrea, J.M., 1950. On the isotopic chemistry of carbonates and a
paleotemperature scale. J. Chem. Phys. 18, 849–857.
Molli, G., Conti, P., Giorgetti, G., Meccheri, M., Oesterling, N., 2000.
Microfabric study on the deformational and thermal history of the
Alpi Aquane marble (Carrara marbles), Italy. J. Struct. Geol. 22, 1809–
1825.
Myers, E.R., Heine, V., Dove, M.T., 1998. Thermodynamics of Al/Al
avoidance in the ordering of Al/Si tetrahedral framework structures.
Phys. Chem. Miner. 25, 457–464.
Natawidjaja, D.H., Sieh, K., Ward, S.N., Cheng, H., Edwards, R.L.,
Galetzka, J., Suwargadi, B.W., 2004. Paleogeodetic records of seismic
and aseismic subduction from central Sumatran microatolls, Indone-
sia. J. Geophys. Res. 109, B04306.
Natawidjaja, D.H., 2003. Neotectonics of the Sumatran Fault and
paleogeodesy of the Sumatran subduction zone: Ph.D. thesis, Calif.
Inst. of Technology; Pasadena.
OÕNeil, J.R., Clayton, R.N., Mayeda, T.K., 1969. Oxygen isotope fraction-
ation in divalent metal carbonates. J. Chem. Phys. 51, 5547–5558.
Rayner, N.A., Horton, E.B., Parker, D.E., Folland, C.K., Hackett, R.B.,
1996. Version 2.2 of the Global Sea Ice and Sea Surface Temperature
Data Set, 1903–1994. Clim. Res. Tech. Note. 74, Hadley Centre, U.K.
Meteorol. Off. Bracknell, England.
Schauble, E.A., Eiler, J.M., 2004. Theoretical estimates of equilibrium
13
C–
18
O clumping in carbonates and organic acids [abstract]. EOS,
Trans. AGU. 85 (47), Fall Meeting Supplement.
13
C–
18
O bonds in carbonate minerals:A new kind of paleothermometer 1455
Shackleton, N.J., 1967. Oxygen isotope analyses and Pleistocene temper-
atures re-assessed. Nature 215, 5096.
Sharma, T., Clayton, R.N., 1965. Measurement of
18
O/
16
O ratios of total
oxygen of carbonates. Geochim. Cosmochim. Acta 29, 1347–1353.
Schrag, D.P.,Hampt, G.,Murray, D.W.,1996. Thetemperature and oxygen
isotopic composition of the glacial ocean. Science 272, 1930–1932.
Schrag, D.P., Adkins, J.F., McIntyre, K., Alexander, J.L., Hodell, D.A.,
Charles,C.D., McManus, J.F.,2002.Theoxygenisotopiccomposition of
seawaterduring the LastGlacialMaximum.QuaternarySci. Rev. 21, 331.
Spero, H.J., Bijma, J., Lea, D.W., Bemis, B.E., 1997. Effect of seawater
carbonate concentration on foraminiferal carbon and oxygen isotopes.
Nature 390, 497–500.
Swart, P.K., Burns, S.J., Leder, J.J., 1991. Fractionation of the stable
isotopes of oxygen and carbon in carbon dioxide during the reaction of
calcite with phosphoric acid as a function of temperature and
technique. Chem. Geol. (Isot. Geosci. Sec.) 86, 89–96.
Urey, H.C., 1947. The thermodynamic properties of isotopic substances.
J. Chem. Soc. London 1947, 561–581.
Wang, Z., Schauble, E.A., Eiler, J.M., 2004. Equilibrium thermodynamics
of multiply substituted isotopologues of molecular gases. Geochim.
Cosmochim. Acta 68, 4779–4797.
Zeebe, R.E., Wolf-Gladrow, D.A., Jansen, H., 1999. On the time required
to establish chemical and isotopic equilibrium in the carbon dioxide
system in seawater. Mar. Chem. 65, 135–153.
1456 P. Ghosh et al. 70 (2006) 1439–1456