The Effect of the 2001 Tax Cut on Low- and Middle-Income Families and Children pdf
Bạn đang xem bản rút gọn của tài liệu. Xem và tải ngay bản đầy đủ của tài liệu tại đây (1.9 MB, 49 trang )
The Effect of the 2001 Tax Cut on
Low- and Middle-Income Families and Children
Len Burman, Elaine Maag, and Jeff Rohaly *
April 2002
* Len Burman is a senior fellow and Elaine Maag and Jeff Rohaly are research associates at the
Urban Institute. We gratefully acknowledge the helpful comments of Bill Gale, Eric Toder, and
Sheila Zedlewski and the financial support of both the Ford Foundation and the George Gund
Foundation. The historical analysis of tax rates in tables 6–8 was conducted by Dr. Toder before
he left the Urban Institute, supported by a grant from the Smith Richardson Foundation. John
O’Hare and Frank Sammartino developed the first version of the Urban-Brookings Tax Policy
Center Microsimulation Model. Deborah Kobes provided expert research assistance. The views
expressed are those of the authors and do not necessarily reflect those of the Urban Institute, its
board, or its funders.
The Tax Policy Center (TPC) aims to clarify and analyze the nation’s tax policy choices by
providing timely and accessible facts, analyses, and commentary to policymakers, journalists,
citizens and researchers. TPC’s nationally recognized experts in tax, budget and social policy
carry out an integrated program of research and communication on four overarching issues: fair,
simple and efficient taxation; long-term implications of tax policy choices; social policy in the
tax code; and state tax issues.
A joint venture of the Urban Institute and the Brookings Institution, support for the TPC comes
from a generous consortium of funders, including the Ford Foundation, the Annie E. Casey
Foundation, and the George Gund Foundation.
Views expressed do not necessarily reflect those of the Urban Institute, the Brookings Institution,
their board of trustees or their funders.
ABSTRACT
The 2001 tax cut has been roundly criticized because so much of the benefit goes to the rich, but
the bill also did much to help low- and middle-income families. Most notably, it increased the
child tax credit and made it refundable—that is, available to families with incomes too low to
owe income tax. The legislation also simplified the EITC and increased it for some married
couples. It increased the maximum child care tax credit, created a new 10 percent tax bracket,
and raised the standard deduction for married couples, all of which will provide substantial
benefit to middle-income families. Like the rest of the tax bill, many of these provisions phase in
very slowly, and inflation erodes away much of the value of the advertised increases.
Nonetheless, when fully phased in, the tax cuts will be worth over $1,700 per year in tax savings
for a family of four at or near the poverty line, and over $1,000 for a family at twice the poverty
level. Families with children do better than those without at almost every income level. The
exception is upper-middle income families whose benefits are curtailed or eliminated by the
alternative minimum tax. And, not surprisingly, the largest overall tax cuts by far will accrue to
those with incomes over $200,000.
CONTENTS
Introduction 1
Prior Tax Treatment of Low- and Moderate-Income Families 3
The New Bill's Effect on the Taxation of Families 5
Child Tax Credit 6
Child and Dependent Care Tax Credit 9
Marriage-Penalty Relief 10
Reduced Marginal Tax Rates 14
Effect of EGTRRA on Low- and Moderate-Income Families 15
Distributional Effects of the Legislation 24
Effects on Taxpayers with Children 30
Unresolved Concerns 35
Introduction
With astonishing speed, Congress passed the Economic Growth and Tax Relief
Reconciliation Act of 2001 (EGTRRA), legislation based loosely on the blueprint put forward by
President Bush in March. This extraordinary act contains several notable features. First, it
constitutes the largest tax cut in 20 years and will cost the government $1.35 trillion over 10
years. Second, some provisions do not become fully effective until 2010. Third, the entire tax bill
expires in 2011, in theory returning the tax system to its initial state after an experimental ten-
year period. Fourth, EGTRRA will eventually repeal the estate tax, an important element of the
federal tax system since the enactment of the modern income tax. Fifth, the act substantially
expands federal tax assistance for working families with children.
Although all elements of EGTRRA warrant scrutiny, this paper focuses on how the
income tax cuts will affect low- and middle-income families with children.
1
Increasingly, lower-
income families, in particular, rely on the income tax system for support. For example, the
earned income tax credit (EITC), the largest cash assistance program for poor families, has been
expanding at a time when direct cash assistance through traditional welfare programs has been
contracting. Thus, policymakers and researchers interested in the well-being of people at the
bottom rungs of the economic ladder must monitor the tax system to gauge the level of public
support.
Unfortunately, the new tax law does not resolve how lower-income families—or anybody
else, for that matter—will be taxed in the years to come. As passed, the tax cut phases in
gradually and then disappears after 10 years. Although the “sunsetting” of the tax law is a clever
budget gimmick, it is very unlikely to remain intact. Indeed, President Bush proposed in his very
1
For a more comprehensive discussion of EGTRRA, see Gale and Potter (forthcoming).
1
next budget to make all EGTRRA changes permanent. Furthermore, both the President and some
members of Congress have proposed accelerating the high-income tax rate cuts in EGTRRA on
the theory that this measure could boost the sagging economy. Accelerating some tax cuts in the
package, however, would put more pressure on the remaining provisions, some of which are
most likely to help low- and middle-income families. And given the strains on the budget arising
from the recession and the aftermath of the September terrorist attacks, every provision in
EGTRRA could find its way to the chopping block.
In summary, the main provisions of EGTRRA that will help low- and middle-income
families are the following:
• The child tax credit eventually doubles from $500 to $1,000 and becomes
refundable for millions of low-income families;
• The amount of child care expenses eligible for the child and dependent care tax
credit increases from $2,400 to $3,000, and the credit rate for low-income
families increases;
• The earned income tax credit is simplified and increased for many married
couples;
• Other “marriage-penalty” relief provisions increase the standard deduction and
expand the size of the 15 percent tax bracket for married couples;
• A new 10 percent tax bracket applies to low-income taxpayers.
2
This paper outlines the main elements of prior tax law that helped low-income families,
explains the impact of EGTRRA’s changes on low- and moderate-income families, and explores
some of the unresolved issues Congress will have to grapple with in the years to come.
Prior Tax Treatment of Low- and Moderate-Income Families
Several long-standing provisions of tax law aid lower-income families. First, the standard
deduction and personal exemptions automatically exempt a minimum amount of income that
increases with the size of the family. For example, in 2000, a married couple with two children
could earn $18,550 before owing any tax (i.e., a standard deduction of $7,350 and four personal
exemptions of $2,800 each); a family with four children could earn $24,150 tax-free.
Many individuals with positive taxable income—that is, income above the exempt
level—benefit from tax credits such as the child tax credit (CTC) and the child and dependent
care tax credit (CDCTC). The $500 per child tax credit exempted another $3,333 per child from
tax.
2
For most families, the CDCTC was equal to 20 percent of child care expenses up to $2,400
for one child or up to $4,800 for two or more children.
3
A family with two children and the
maximum qualifying expenses could thus shelter another $6,400 of income from tax.
Accordingly, including these two tax credits, the family of four could earn over $31,000 before it
owed income tax.
4
2
At the 15 percent tax rate that applies to lower-income taxpayers, $3,333 of income would be subject to $500 of
tax (15 percent of $3,333).
3
Very-low-income families (under $10,000 in 2000) qualified for tax credits at rates of up to 30 percent, but that
credit rate is largely theoretical since few families with such low incomes would owe income tax, even without the
CDCTC.
4
Note that the EITC did not affect the tax-free level of income for a family with the maximum child care expenses,
because the EITC was fully phased out at $31,152 of income in 2000—less than the $31,617 that could be sheltered
from tax by the CTC and CDCTC alone. The EITC did, however, raise the tax-free threshold for families that spent
less than the maximum amount of child care expenses. See table 5 and discussion below.
3
Of course, lower-income working families do pay other taxes, including payroll taxes for
Social Security and Medicare, excise taxes, and state and local taxes such as sales, income, and
property taxes. Recognizing these other burdens, as well as the fact that taxes can discourage
low-income people from working in the arduous, nonremunerative occupations available to
them, the tax law provides so-called refundable tax credits to families that do not have income
tax liability.
The largest, best-known refundable credit is the earned income tax credit (EITC).
Established in 1975, the federal EITC was designed to encourage work by providing a cash
benefit to offset payroll taxes for working-poor families. Congress has enacted several
expansions since then, resulting in substantial assistance for working-poor families; for very low-
income families, the EITC now exceeds payroll taxes. Low-income taxpayers receive a tax credit
for their earnings up to a maximum amount. In 2000, the tax credit rate for families with two or
more children was 40 percent of earnings up to $9,720. Smaller credits are available for families
with one or no children. The credits phase out as income increases above a certain amount. That
phaseout is tantamount to a surtax at the phaseout rate and was one of the motivations for raising
the credit under the new tax law.
5
The CTC also has a refundable component for certain families with three or more
children, affectionately known as FRED—for "full refundability for excess dependents"—–
among tax wonks. The CTC is refundable to the extent that the employee share of Social
Security taxes plus individual income taxes exceeds his or her EITC.
5
For example, the phaseout rate for taxpayers with two or more qualifying children is 21.06 percent. That is, for
every $100 earned, taxpayers lose $21.06 of EITC. This is equivalent to a surtax of 21.06 percent in the phaseout
range.
4
Finally, the progressive tax rate schedule benefits low- and middle-income families by
taxing them at lower rates than higher-income households. About three-quarters of all
households are taxed at rates of 15 percent or less, and 95 percent are taxed at rates of 28 percent
or less (House Committee on Ways and Means 2000). Single parents (called "heads of
household" in the tax law) and married couples pay lower taxes on the same amount of income
than do single people without children. This provides a subsidy, or “marriage bonus,” for one-
earner families with children.
Not all couples, however, see tax benefits because of marriage. Many two-earner married
couples are penalized by the tax code. Despite the lower rates that generally apply to joint
returns, couples with both spouses earning about the same income often pay much more in taxes
than if they had not married. This so-called marriage penalty may discourage marriage and
prevent potential second earners from entering the workforce.
The New Bill's Effect on the Taxation of Families
EGTRRA made fundamental changes in almost all of the provisions geared
toward families. On net, the family-related provisions will cost almost $660 billion, taking into
account both decreased revenues and increased outlays on refundable credits (table 1a). The most
costly of the provisions, the creation of a 10 percent bracket, benefits higher-income taxpayers
the most. The increase of the standard deduction for married couples and the expansion of the 15
percent bracket for married couples also disproportionately benefit higher-income taxpayers
(table 1b). Only the expanded CTC and CDTC and the increase in the EITC provide about the
same or more benefits to the lower half of the income distribution (roughly those below 300
percent of the poverty level) than to the upper half.
5
Table 1a. Revenue Cost of Family-Related EGTRRA Provisions
Provision
Fully phased in Cost of
Provision (in FY 2010)
($ Millions)
10 Year Cost of Provision
through FY 2011
($ Millions)
Child tax credit provisions 25,200 171,782
Child and dependent care credit provisions 296 2,991
Increase standard deduction for married couples 2,932 14,918
Expand 15% bracket for married couples 4,001 32,734
Simplify EITC and increase for some couples 2,240 15,643
Create 10% bracket 46,034 421,321
Total cost 80,703 659,389
Source: Joint Committee on Taxation (2001).
Table 1b. Share of Benefits Going to Low- and Moderate-Income Families, Calendar Year
2010
Source: Urban-Brookings Tax Policy Center Microsimulation Model.
* Less than 0.5 percent.
Notes: The federal poverty levels for 2010 are estimated using the 2001 values from the U.S. Census Bureau and
forecasts and projections for inflation from the Congressional Budget Office. The cost of the child tax credit and
EITC includes the outlay component (increase in refundable tax credits). Estimated costs do not account for
interactions between provisions.
Share of Tax Cut to Taxpayers with Income
Below:
Provision
100% of
Poverty
200% of
Poverty
300% of
Poverty
Share to
Taxpayers
With Higher
Incomes
Child tax credit provisions 6% 34% 54% 46%
Child and dependent care credit provisions * 27% 57% 43%
Increase standard deduction for married couples * 13% 29% 71%
Expand 15% bracket for married couples * * * 100%
Increase EITC for some couples 23% 98% 100% 0%
Create 10% bracket 2% 18% 38% 62%
Share of Tax Filing Population 22.1% 40.9% 55.0% 45.0%
Child Tax Credit
The most significant change affecting most families was the doubling of the child tax
credit from $500 to $1,000. Like most provisions in the new law, this change phases in very
slowly, though an initial jump to $600 occurred in 2001. The credit amount then remains
unchanged until 2005, when it increases to $700. The credit does not reach the advertised
6
maximum of $1,000 until 2010 (table 2). The maximum is fleeting under the law as it sunsets
along with the other provisions, returning to the 2000 level of $500 after just one year.
What's more, because EGTRRA does not adjust the credit amount for inflation, the
ultimate value of the credit will be less than advertised. The $700 credit in 2008 will be worth
less than the $600 credit effective in 2001 owing to inflation.
6
The fully phased-in credit of
$1,000 in 2010 is projected to be worth only $772 in 2000 dollars. Thus, what appears to be a
doubling of the credit amounts to only a 54 percent increase over the level that would apply if the
$500 credit were simply indexed for inflation starting in 2001.
In addition to raising the amount of the CTC, the new law also made the credit available
to millions of low-income families who were ineligible under prior law because they did not owe
income tax. To extend the credit to these families, lawmakers added a refundable component,
available for up to 10 percent of earnings over $10,000 (increasing to 15 percent in 2005). Thus,
a family with one child and earnings of $16,000 in 2001 could take the full $600 child tax credit,
even if the head had no income tax liability.
7
In 2001, refundability benefited more than 14
million children who would have been excluded under the old rules governing refundability; the
number of additional beneficiaries rises to 18 million by 2010.
The new provisions did not address calls to simplify the CTC, but instead introduced
added complexity. Lawmakers passed up the opportunity to eliminate the complicated partial
refundability provision (FRED) under prior law. As a result, low-income taxpayers with three or
6
Inflation assumptions are from the Congressional Budget Office (2001) baseline projections.
7
The taxpayer’s earnings exceed $10,000 by $6,000; 10 percent of $6,000 equals $600. See Greenstein (2001) for
an excellent discussion of the issues surrounding the expansion of the CTC and EITC.
7
Table 2. Child-Related Tax Credits Modified by EGTRRA
Year
Credit
2000 2001 2002 2003 2004 2005 2006 2007 2008 2009 2010
Child Tax Credit
Maximum credit $500 $600 $700 $800 $1,000
In 2000$ $500 $581 $566 $551 $537 $612 $597 $582 $568 $633 $772
Refundable? No
i
Refundable up to 10 percent of
earnings over $10,000 (indexed for
inflation after 2002).
Credit refund rate increases to 15 percent.
Child and Dependent Care Tax Credit
Max Expenses per
child
$2,400 ($4,800 max) $3,000 ($6,000 max)
In 2000$ $2,400 $2,323 $2,262 $2,753 $2,686 $2,621 $2,557 $2,495 $2,434 $2,374 $2,316
Max Credit Rate 30% (income < $10,000) 35% (income < $15,000)
Min Credit Rate
ii
20% (income > $28,000) 20% (income > $43,000)
8
Source: Committee on Ways and Means, June 6, 2001.
i
Generally, the credit is nonrefundable. However, a family with three or more children gets a refundable child credit to the extent that the employee share of
Social Security taxes plus individual income taxes exceeds its earned income tax credit up to the amount of the full child credit.
ii
The phaseout range is not indexed for inflation, so it effectively applies to lower and lower levels of real income over time. For example, by 2010, the nominal
phaseout range of $15,000 to $43,000 is eroded by inflation to the equivalent of $11,672 to $33,461, not that much higher than current levels. In consequence,
fewer and fewer households will be able to take advantage of the higher credit rates over time.
8
more children will need to compare the refundable credit they qualify for under FRED with the
refundable credit they are eligible for under the new law and take the larger credit. Congress
could have merged the two provisions to make the benefit clearer and easier to calculate, a
straightforward simplification measure that should be considered in future legislative debates.
Congress did address one significant aspect of complexity and unfairness. The new law
made the child credit available to upper-middle-income families that would otherwise have had
their credits reduced by the alternative minimum tax. This move appears particularly relevant
because under the new law many more taxpayers will be affected by the alternative minimum
tax.
8
Child and Dependent Care Tax Credit
The CDCTC offsets some of the costs of paying for child care to work or study.
9
The law
increased the maximum expenses eligible for this nonrefundable credit from $2,400 to $3,000
per child (and a maximum of $6,000) for a family. However, lawmakers chose not to adjust the
amount of eligible expenses for inflation. As a result, the credit will actually be worth less in real
terms in 2010 than in 2000.
EGTRRA also increased the maximum credit rate for low-income families—raising it
from 30 percent to 35 percent for families with incomes below $15,000. The significance of this
change, however, is limited, because people at that income level do not have enough tax liability
8
The Joint Committee on Taxation estimates that 35.5 million taxpayers will be affected by the AMT in 2010, up
from 1.4 million in 2001. Many of these taxpayers do not technically owe AMT, because their ordinary income tax
before credits is greater than their “tentative alternative minimum tax” (TAMT). However, if their tax after credits is
less than their TAMT, then the tax credits are trimmed to eliminate the difference. Although these taxpayers are not
technically subject to the AMT, the result is the same as if they were. The new provisions passed as part of
EGTRRA stipulate that this rule does not apply to the child tax credit. Taxpayers can use the full child tax credit
even if it causes their ordinary income tax to fall below their TAMT. This exception will spare many upper-middle-
income families from a complicated worksheet.
9
The CDCTC may also be used to pay for the costs of care for a disabled or elderly dependent.
9
to use the full tax credit, and unlike the CTC, the CDCTC is not refundable. Moreover, the
income levels at which the credit rate is reduced are not indexed for inflation. Thus, over time,
the higher credit rates apply at lower and lower levels of real income. Also, most families with
very low incomes cannot afford to pay thousands of dollars for child care, even with a tax credit,
so the increase in the maximum expense will not help them.
In addition, as mentioned above, the apparent increase in the maximum eligible expenses
is illusory. In inflation-adjusted terms, the tax credit will be worth slightly less in 2010 than it
was in 2000. Nonetheless, this slight decrease reverses the longstanding practice of allowing this
tax credit's real value to erode over time. Were it not for the new law, by 2010 the credit would
have declined in real value by more than 20 percent owing to inflation.
Marriage-Penalty Relief
Three provisions are aimed at reducing the tendency of two-earner couples to pay more
income taxes when married than if they remained single. The EITC was revised to reduce
marriage penalties for low-income families. Another provision increased the standard deduction
for married couples, primarily benefiting middle-income families. A third provision increased
the size of the 15 percent tax bracket for couples benefiting upper-income households (table 1b).
Low-income couples can face hefty marriage penalties because of the EITC.
10
For
example, consider a couple with two children in which each parent earns $16,000. If unmarried,
the head of household could have qualified for an EITC of $3,186 in 2000. If they married,
though, their combined income of $32,000 would have disqualified them from receiving the
10
Wheaton (1998) discusses EITC marriage penalties and some options to mitigate them.
10
EITC. By virtue of being married, this modest-income couple would have lost $3,186 in tax
credits about 10 percent of their combined incomes.
11
The EITC provides a tax credit as a percentage of earnings up to a certain level of
income. Within a specified income range, dubbed "the plateau," the credit remains a set
percentage. Once earnings exceed that range, the size of the credit decreases until it is phased
out. Both the credit rates and the phaseout rates vary with the number of children in the home;
they are highest for two-child families. Under pre-EGTRRA law, the income ranges of the EITC
were the same for married couples as for single parents.
EGTRRA mitigates the marriage penalty by increasing the income levels at which the
EITC begins to phase out for married couples. Under EGTRRA, the income point at which the
EITC begins to phase out rises in $1,000 increments for couples, ultimately reaching $3,000.
Similar to other parts of the law, the provision phases in slowly and will not become fully
effective until 2008. Taking into account inflation, the $3,000 increase will be equivalent to
$2,434 (in 2000 dollars) (table 3). Nonetheless, the change creates a significant increase in the
EITC for some married couples who would have lost credits under the old phaseout schedule. In
2000, for families with two or more children, the credit began to phase out once income reached
$12,690; by 2008, the phaseout will not begin until income reaches $15,124 (in 2000 dollars). In
addition, because both the start and end point of the phaseout have increased, families with
incomes up to $33,586 (in 2000 dollars) will still be eligible for some EITC. Before the new law,
only families with incomes up to $31,152 were eligible.
11
They would also owe more tax before credits by virtue of being married, so that their total marriage penalty would
exceed $3,186.
11
Table 3. Marriage Penalty Relief Provisions
Year
Provision
2000
2001 2002 2003 2004 2005 2006
2007
2008 2009 2010
Phase in Increase in Standard Deduction and 15 percent Bracket for Married Couples to Twice Level for Singles
Joint Standard Deduction as Percent of
Single
167% 174% 184% 187% 190% 200%
Size of 15% Bracket as Percent of
Singles
167% 180% 187% 193% 200%
Phase in $3,000 Increase in EITC Phaseout Range for Married Couples
i
$5,770 $6,713 $7,517 $8,204
$12,690 $13,634 $14,437 $15,124
Earnings level at
which EITC starts to
phase out (2000$)
0 children
1 child
2 or more
children
$12,690 $13,634 $14,437 $15,124
$10,380 $11,323 $12,127 $12,814
$27,413 $28,356 $29,127 $29,847
End of phaseout
(2000$)
0 children
1 child
2 or more
children $31,152 $32,095 $32,899 $33,586
12
Source: Committee on Ways and Means, June 6, 2001 and authors’ calculations.
i
Parameters for singles remain unchanged at 2000 levels. In 2000, the EITC equals 7.65 percent of earnings up to $4,610 for workers without children; 34
percent of earnings up to $6,920 for those with one child; and 40 percent of earnings up to $9,720 for those with two children. The EITC phases out at rates of
7.65 percent, 15.98 percent, and 21.06 percent for workers with 0, 1, and 2 or more children, respectively. The phase-in and phaseout ranges are indexed for
inflation. The credit rates, phase-in region, and phaseout rates are not affected by the legislation.
12
The EITC provisions also simplify eligibility for low-income workers in a number of
ways. Namely, the new rules make the definition of qualifying child more consistent with that
used elsewhere in the tax code; use adjusted gross income rather than a confusing "modified
adjusted gross income" to calculate benefits; allow parents living with their children first rights
to claim them for credit purposes; and allow foster parents to claim the credit if they live with
their children for 6 months of the year (down from 12 months). EGTRRA also makes it easier for
the IRS to identify ineligible noncustodial parents trying to claim a tax credit. These changes will
help to reduce the incidence of both honest mistakes and fraudulent EITC claims, strengthening
the integrity of the program.
12
The new rules went into effect as of 2002.
The other provisions designed to offer marriage-penalty relief do not take effect until
2005. Eventually, EGTRRA makes the standard deduction for couples double the deduction for
singles, and will make the 15 percent tax bracket for joint returns twice the size of the bracket on
single returns. These provisions will eliminate marriage penalties for most middle-income
couples, but they will also increase marriage bonuses. In other words, couples that currently pay
less tax by virtue of being married will pay an even smaller amount after these new provisions
are phased in.
Although the increase in the amount of income taxed at the 15 percent rate may sound
like a tax cut for modest-income couples, only couples who would otherwise be taxed at higher
rates benefit from this change. Less than 40 percent of all joint filers were in the 28 percent or
higher tax brackets in 2000.
12
See Greenstein (2001) for a more detailed discussion.
13
Reduced Marginal Tax Rates
EGTRRA creates a new 10 percent tax bracket for lower-income taxpayers and cuts rates
for people in the 28 percent and higher tax brackets (table 4). Only the 10 percent bracket,
applicable to the first $6,000 of income for singles and $12,000 for joint returns, aids lower-
income households. In a departure from the practice of the past 20 years, lawmakers did not
index the bracket for inflation for the first seven years. As a consequence, low-income people
will see more and more of their income taxed at the 15 percent rate (so-called bracket creep
owing to inflation) until 2008, when the thresholds will increase by $1,000 for singles and
$2,000 for couples. The adjustment will nearly offset the erosion resulting from inflation.
Beginning in 2009, the 10 percent bracket will be indexed for inflation.
Table 4. Marginal Tax Rate Brackets by Year, 2000-10
New Tax Brackets under EGTRRA by Year
Maximum 2010 Taxable Income
Taxed at Rate (2000$)
2000
Tax
Rate
2001
i
2002 2003 2004 2005 2006 2007 2008 2009 2010 Single Married
HOH
ii
15% New 10% bracket for first $6,000 of income for single,
$12,000 for married.
Raise bracket thresholds to
$7,000 and $14,000.
Indexed beginning in 2009. $5,679 $11,357 $8,112
15%
iii
15% $26,250 $52,500 $35,150
28% 27% 26% 25% $63,550 $105,950 $90,800
31% 30% 29% 28% $132,600 $161,450 $147,050
36% 35% 34% 33% $288,350 $288,350 $288,350
39.6% 38.6% 37.6% 35%
∞ ∞ ∞
Source: Committee on Ways and Means, June 6, 2001.
___________________
i
The top four rates are effective July 1, 2001 resulting in rates of 27.5%, 30.5%, 35.5%, and 39.1% for calendar year
2001.
ii
HOH = Head of Household.
iii
While the 15 percent marginal rate does not change, the amount of income taxed at that rate does. In addition to
part of the present 15 percent bracket being taxed at 10 percent in 2001 and beyond, the size of the bracket for
married filers is ultimately expanded to be twice the size of the single bracket.
14
Effect of EGTRRA on Low- and Moderate-Income Families
The wide scope of tax provisions addressed in EGTRRA make assessing the overall
effect on low- and moderate-income families difficult. For example, the higher standard
deduction for married couples and the 10 percent bracket reduce the value of the CDCTC for
low-income families because they are less likely to owe tax against which to apply the
nonrefundable credits. Of course, the complicated phase-ins also make it hard to tell how the
different provisions will affect families at different points in time.
The level of income that is tax-free provides a simple metric of how the tax system
affects low-income people. Table 5a shows the “income tax entry threshold,” the level of income
at which income tax liability occurs before considering the effect of tax credits. This threshold
comprises a standard deduction, which depends on filing status and personal exemptions,
determined by the number of people in the filing unit. The threshold increases with family size,
and it is higher for married couples than for singles and heads of household. Absent other credits,
in 2000, a single person with no children had positive tax liability starting at $7,200 of income; a
single head of household with one child owed tax starting at $12,050. A married couple,
qualifying for a higher standard deduction, began to owe tax at a higher level of income. A
married couple with two children could earn $18,550 tax-free; with four children, the tax-entry
threshold was $24,150.
None of the provisions of EGTRRA affect the tax-entry point for single people—either
with or without children. In contrast, tax-entry thresholds increase for married couples in 2005,
when the increase in their standard deduction starts to phase in. This phase-in is not complete
until 2009, when the tax-entry threshold for married taxpayers is $1,450 higher (in inflation-
adjusted dollars) than it was in 2000.
15
The CTC and EITC change the picture considerably. In 2000, a married couple with four
children could earn $37,486 before owing any income tax, more than 50 percent over the tax-
entry threshold (table 5b). A single head of household with one child could earn 75 percent more
tax-free than he or she could without the CTC or the EITC. Even a single person without
children could earn 15 percent more than the tax-entry threshold before owing tax because of the
small EITC available to childless workers. A single parent with one child could earn more than
two-and-a-half times the amount that a single childless person could earn before being taxed, a
significantly higher ratio than without the two credits.
The tax-entry threshold increases over time for most households for three reasons. First,
the CTC expansion raises the entry threshold for families with children. Second, for married
couples, the EITC marriage-penalty relief further increases the level of tax-free income. Third,
for all families eligible for an EITC or CTC, tax credits offset tax liability on more income in
2001 than in 2000 because of the reduction in income tax rates from 15 percent to 10 percent on
the first $6,000 of income.
13
Measured in 2000 dollars, the increase in the entry threshold is uneven because of the
complex phase-ins and the failure to index the CTC expansion to inflation. For single taxpayers
without children, the 10 percent bracket increased the entry threshold slightly in 2001; the level
is set to remain constant after that. By contrast, families with children see increases in tax-entry
thresholds phased in over several years. Between 2000 and 2010, a single parent with one child
will see an increase in the tax-free level of income by more than $2,000 (table 5b). For a married
couple with two children, the increase is more than $5,000. For a married couple with four
13
For example, $500 of tax credits in 2000 could offset the income tax liability on $3,333 of taxable income in 2000
($3,333 * 15 percent = $500). In 2001, the same tax credits could offset tax liability on $5,000 of income ($5,000 *
10 percent = $500).
16
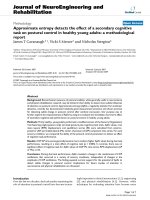
children, the increase is more than $12,000. However, it takes a long time for these increases to
phase in. Indeed, between 2001 and 2007, the tax-free level of income changes very little; in
some years, it actually declines (figure 1).
The increase in the CDCTC will also affect the tax-free threshold, especially among
middle-income households who can afford to pay for child care. Families with the typical
amount of child care expenses at their income level will see a 5–10 percent increase in the tax-
free level of income over the 2000 level owing to the CDCTC (tables 5b and 5c). Expansions in
the credit result in larger differences in the amount of income that is tax-free by 2010. Expressed
in 2000 dollars, a single parent with one child will be able to earn 9 percent more before owing
tax because of the CDCTC. For a married couple with two children, the tax-entry threshold will
increase by 13 percent; a married couple with four children will see an increase of 11 percent.
Thus, married couples with four children and an average amount of child care expenses (for
people taking the credit) can earn $55,440 before owing federal income tax.
The reduced income tax burden on low-income families continues a trend seen through
the 1990s. Taxes declined for poor families throughout the 1990s (see table 6a and b). In 1990, a
family at the poverty level ($17,436 in 2000) would receive a net refund equal to about 5 percent
of income after taking the EITC. A near-poor family (125 percent of poverty), actually owed
some tax (0.4 percent). By 2000, that family would qualify for a net refund of more than 8
percent of income, and the family at the poverty level would receive a net refund of more than 15
percent. Families at twice and three times the poverty threshold continued to owe income tax, but
the size of their liability dropped significantly over the course of the decade.
17
Table 5a. Income Tax Entry Thresholds for Selected Families before Credits, 2000-09
(in 2000$)
Year
Family Type
2000 2001 2003 2005 2006 2007 2008 2009
Single, No Children 7,200 7,200 7,200 7,200 7,200 7,200 7,200 7,200
Single, One Child 12,050 12,050 12,050 12,050 12,050 12,050 12,050 12,050
Married, Two Children 18,550 18,550 18,550 18,860 19,300 19,430 19,560 20,000
Married, Four Children 24,150 24,150 24,150 24,460 24,900 25,030 25,160 25,600
Notes and source: In calculating the year 2000 values of 2001 tax law in subsequent years, we use projections for
inflation from the Congressional Budget Office, August 2001.
Table 5b. Tax-Free Level of Income for Selected Families after the Earned Income Tax
Credit and Child Tax Credit, 2000-10 (in 2000$)
Year
Family Type
2000 2001 2003 2005 2007 2009 2010
Single, No Children 8,275 8,580 8,580 8,580 8,580 8,580 8,580
Single, One Child 21,590 23,465 23,260 23,385 23,220 23,355 23,806
Married, Two Children 28,684 30,795 31,027 31,903 31,840 33,021 34,081
Married, Four Children 37,486 43,639 42,506 44,258 43,715 46,270 49,976
Notes and source: In calculating the year 2000 values of 2001 tax law in subsequent years, we use projections for
inflation from the Congressional Budget Office, August 2001.
Table 5c. Tax-Free Level of Income for Selected Families after the Earned Income Tax
Credit, Child Tax Credit, and Dependent Care Credit, 2000-10 (in 2000$)
Year
Family Type
2000 2001 2003 2005 2007 2009 2010
Single, No Children 8,275 8,580 8,580 8,580 8,580 8,580 8,580
Single, One Child 23,370 25,113 25,811 25,858 25,531 25,551 25,945
Married, Two Children 30,050 33,825 33,834 34,894 34,735 36,582 38,380
Married, Four Children 41,330 48,294 47,040 48,979 48,378 51,328 55,440
Notes and source: In calculating the year 2000 values of 2001 tax law in subsequent years, we use projections for
inflation from the Congressional Budget Office, August 2001. Calculations including dependent care credit use
average expenses for families with incomes shown in table 5b that report child care expenses. Approximately 30
percent of single, one-child households; 27 percent of married, two-child households; and 14 percent of married,
four-child households at those income levels use the child and dependent care tax credit. See Giannarelli and
Barsimantov (2000).
18
Figure 1. Tax-Free Level of Income as EGTRRA Phases In,
Selected Families (in 2000$), 2000-10
26,000
28,000
30,000
32,000
34,000
36,000
38,000
40,000
42,000
44,000
46,000
48,000
50,000
52,000
2000 2001 2003 2005 2007 2009 2010
Year
(2000$)
Married with 4 kids
Married with 2 kids
Source: Authors’ calculations. In calculating the year 2000 values of 2001 tax law in subsequent years, we use
projections for inflation from the Congressional Budget Office, August 2001.
19
Table 6a. Average Income Tax Rates at Selected Income Levels for Married Couple with
Two Children, 1990 – 2010 (Income Tax as % of Pretax Income)
Year
Income
1990 1995 2000 2001 2003 2005 2010
Poverty Level -4.9% -13.6% -15.3% -19.6% -20.6% -23.7% -24.5%
125% of Poverty Level 0.4% -5.3% -8.4% -11.9% -12.5% -13.9% -16.3%
200% of Poverty Level 6.8% 6.4% 3.9% 1.8% 2.1% 1.8% 0.3%
300% of Poverty Level 9.2% 8.9% 7.2% 5.9% 6.0% 5.8% 4.9%
Source: Authors’ calculations.
Notes: Pre-tax income is defined as wages plus the employer’s contribution to social insurance taxes. The poverty
level is $17,463 (in 2000$) for this family.
Table 6b. Total Income Tax Paid at Selected Income Levels for Married Couple with Two
Children, 1990 – 2010 (in 2000$)
Year
Income
1990 1995 2000 2001 2003 2005 2010
Poverty Level -924 -2,563 -2,883 -3,687 -3,880 -4,456 -4,601
125% of Poverty Level 90 -1,236 -1,963 -2,797 -2,930 -3,257 -3,837
200% of Poverty Level 2,541 2,408 1,456 695 804 663 127
300% of Poverty Level 5,160 5,028 4,076 3,314 3,424 3,283 2,746
Source: Authors’ calculations.
Notes: Pretax income is defined as wages plus the employer’s contribution to social insurance taxes. The poverty
level is $17,463 (in 2000$) for this family.
EGTRRA will make a big difference for families at or near the poverty threshold. In
2001, a family at the poverty threshold would receive a net tax refund equal to nearly 20 percent
of income, compared with a 15 percent subsidy the previous year (table 6a). By 2010, when the
act is fully phased in, the net income tax subsidy to poor families will equal almost 25 percent of
income, almost five times the 1990 amount. That is, by 2010, the cash refund of about $4,600
will move the family’s after-tax income to the equivalent of 125 percent of the poverty threshold.
A family earning 25 percent above the poverty level would get a net refund equal to about 16
percent of income (about $3,800). In 1990, the same family would have owed a small amount of
income tax. Even a family at twice the poverty level in 2010 would have almost no tax
liability—about $110 or 0.3 percent of income—compared with a 7 percent net tax rate in 1990.
20
A family at three times the poverty threshold would see its tax rate cut to about one-third its 2000
tax and to almost half its 1990 levy.
Working poor families do pay payroll taxes, a component that changes the picture
dramatically (tables 7a and 7b). Including payroll taxes, a family at the poverty level paid more
than 9 percent of its income in taxes in 1990.
14
In 2000, the EITC eliminated their income tax
bill, and they received a small (1 percent) net subsidy over payroll taxes (Ellwood 2000). By
2010, their net income tax refund will exceed payroll taxes by about 10 percent of income.
15
A
family at 125 percent of the poverty level does not see its overall tax bill eliminated until 2010,
and a family at twice the poverty threshold continues to pay significant tax even after the income
tax cuts are fully phased in. Nonetheless, the new tax law reduces total taxes across the board,
following the same pattern as shown for income taxes (tables 6a and 6b).
The marginal tax rate—the amount of taxes due on an additional dollar of income—is a
measure of a taxpayer’s incentive to work or save. The EITC was designed to encourage work by
augmenting wages. A family with two children and very low income receives a 40 percent
income tax subsidy for every additional dollar earned. The EITC's phaseout schedule, however,
creates an implicit tax of 21 percent for families that move from very low income to higher
income levels. The bulk of the evidence suggests that the EITC encourages work more than the
high marginal tax rates in the phaseout range discourages it (Ellwood 2000). Nonetheless,
analysts were concerned because marginal tax rates can exceed 40 percent in some cases.
16
14
This figure includes both the employer and employee portion of the payroll taxes. Evidence suggests that the tax
that is nominally paid by employers is ultimately paid by employees in the form of lower wages or reduced fringe
benefits (Gruber 1994).
15
Poor families face many other taxes, including federal excise tax, state and local sales tax, income tax, and
property tax.
16
Marginal tax rates exceeded 40 percent when the EITC phaseout was added to the 15 percent income tax rate and
the payroll taxes that are paid by both employers and employees.
21