General concepts in integrated pest and disease management (integrated management of plant pests and diseases, volume 1)
Bạn đang xem bản rút gọn của tài liệu. Xem và tải ngay bản đầy đủ của tài liệu tại đây (6.01 MB, 366 trang )
General Concepts in Integrated Pest and Disease Management
General Concepts in Integrated
Pest and Disease Management
Edited by
A. Ciancio
C.N.R., Bari, Italy
and
K. G. Mukerji
University of Delhi, India
A C.I.P. Catalogue record for this book is available from the Library of Congress.
ISBN 978-1-4020-6060-1 (HB)
ISBN 978-1-4020-6061-8 (e-book)
Published by Springer,
P.O. Box 17, 3300 AA Dordrecht, The Netherlands.
www.springer.com
Printed on acid-free paper
Cover Photo:
Nectarine powdery mildew showing white mycelium growth on the green fruits (by Peter Sholberg,
Pacific Agri-Food Research Centre/Centre de recherches agroalimentaires du Pacifique,
Summerland, BC, Canada).
All Rights Reserved
© 2007 Springer
No part of this work may be reproduced, stored in a retrieval system, or transmitted
in any form or by any means, electronic, mechanical, photocopying, microfilming,
recording or otherwise, without written permission from the Publisher, with the exception
of any material supplied specifically for the purpose of being entered
and executed on a computer system, for exclusive use by the purchaser of the work.
CONTENTS
Contributors
Preface
xiii
xv
Section 1 - Modeling, Management
and Epidemiology
1 - How to Create and Deploy Infection Models for Plant Pathogens
R. D. Magarey and T. B. Sutton
1. Introduction
2. Biological Requirements for Infection
3. Infection Models
4. Disease Forecast
5. Weather Inputs
5.1. Choice of Input Variables
5.2. Source of Weather Data
5.3. Canopy Microclimate
6. Model Validation
7. Information Delivery
References
2 - A Review of Resurgence and Replacement Causing Pest
Outbreaks in IPM
J. D. Dutcher
1. Introduction
2. Primary Pest Resurgence
3. Secondary Pest Resurgence
4. Destruction of Natural Enemies
5. Hormoligosis
6. Detecting and Measuring Pest Resurgence
7. Problems and Solutions
8. Conclusions
References
3 - The Role of Plant Disease Epidemiology in Developing
Successful Integrated Disease Management Programs
F. W. Nutter
1. Introduction
1.1. Importance of Quantitative Informations on yo, r, and t
1.2. The Relationship between Initial Inoculum (yo) and the Rate
of Disease Development (r)
1.3. Reducing yo, r, and/or t for Effective Integrated Disease
Management
1.4. Selecting the Best Model to Estimate yo, r, and t
1.4.1. The Monomolecular Model
1.4.2. The Exponential Model
v
3
3
6
8
12
15
15
16
17
18
21
22
27
27
28
29
30
31
32
34
38
39
45
45
45
46
48
49
50
51
vi
CONTENTS
1.4.3. The Logistic Model
1.4.4. The Gompertz Model
2. Sanitation
2.1. Disease Management Principle I: Exclusion (yo)
2.1.1. Quarantine (yo)
2.1.2. Seed/Plant Certification Programs (yo)
2.2. Disease Management Principle II: Avoidance (t)
2.2.1. Avoidance of Disease Risk in Space (t)
2.2.2. Avoidance of Disease Risk in Time (t)
2.3. Disease Management Principle III: Eradication (yo)
2.3.1. Eradication through Crop Rotation
2.3.2. Removal of Alternate and Alternative Hosts
2.3.3. Roguing of Diseased Plants (yo and r)
2.3.4. Removal and Burial of Crop Residues (Debris), (yo)
2.3.5. Pathogen Eradication Programs (yo)
2.3.6. Flooding (yo)
2.3.7. Soil Solarization (yo)
2.3.8. Eradication/Disinfestation by Heat
Sterilization/Pasteurization (y o)
2.3.9. Soil Fumigation (yo )
3. Protection
3.1. Disease Management Principle IV: Protection (yo and/or r)
3.1.1. Use of Physical Barriers to Protect Crops (yo and r)
3.1.2. Use of Chemical Barriers to Protect Crops (yo and r)
3.1.3. The Use of Organic and Reflective Mulches (yo and r)
3.2. Disease Management Principle V: Host Resistance
3.2.1. Resistance Reducing Initial Inoculum (yo )
3.2.2. Resistance Reducing the Rate of Infection
(Disease Development)
3.2.3. Host Resistance Affecting Time (t)
3.2.4. Molecular Technologies for Disease Resistant Plants
3.3. Disease Management Principle VI: Therapy
(yo and Sometimes r)
3.3.1. Heat Therapy (yo)
3.3.2. Antibiotic and Chemical Therapy (yo)
3.3.3. Therapy Methods that Employ Radiation (yo)
3.3.4. Removal of Infected Plant Parts (yo and r)
4. Integration of IPM Practices at the Disease Components Level
Acknowledgements
References
4 - Concepts for Plant Protection in Changing
Tropical Environments
A. Ciancio and K. G. Mukerji
1. Introduction
2. Environment and Climate Changes
2.1. Climate and Anthropogenic Changes
2.2. Past Climate Changes in the Tropics
52
53
54
54
55
55
56
56
58
59
60
60
62
63
63
64
64
65
65
65
65
65
66
68
69
69
69
71
71
73
73
73
73
73
74
76
76
81
81
83
83
85
CONTENTS
2.3. Present Climates
2.3.1. The Central Andes and South America
2.3.2. The Caribbean and Tropical Pacific
2.3.3. The Asian Monsoon System
2.3.4. Tropical Africa and Sub-Sahara
2.4. Expected Scenarios
2.4.1. Monsoon System
2.4.2.The Tropical Pacific
2.4.3. West Africa
3. Climate Changes and Plant Protection
3.1. Some General Concepts in Plant Protection
3.2. Crop Protection and Anthropogenic Changes
3.2.1. Changes Induced by Climate Variations
3.2.2. Marginal Benefit and Density Thresholds
3.3. Effects of Climate and Environment Changes on Pests
and Diseases
3.3.1. Insects and Mites
3.3.2. Soil Food Webs
3.3.3. Plant Pathogens
3.4. Habitat Changes and Integrated Management
3.4.1. Rainforests
3.4.2. Hydrologic Cycles
3.5. Epidemics and Biological Control Agents
3.6. Plants Reactions to Climate Changes
3.6.1. Reaction to Greenhouse Gases
3.6.2. Reactions to Irradiation
4. Expected Changes in Tropical Regions
4.1. Central Andes and South America
4.2. Caribbean and Tropical Pacific
4.3. Asian Monsoon Region
4.4. Africa and Sub Sahara
5. Adaptive Strategies for Integrated Management
5.1. Adaptive Strategies and Disease Management
5.2. Tools and Technologies
6. Conclusions
References
5 - Management of Postharvest Diseases in Stone and Pome
Fruit Crops
S.-P. Tian
1. Introduction
2. Principal Diseases and Infection Process
2.1. The Major Pathogens
2.2. The Infection Process
2.3. The Penetration Ways
2.3.1. Wound Infection
2.3.2. Direct Infection
vii
88
88
90
91
92
93
93
94
95
95
96
98
98
99
101
101
103
104
107
107
108
109
110
110
111
112
113
114
115
117
119
119
120
122
122
131
131
132
132
132
133
133
134
viii
CONTENTS
3. Conditions Affecting Pathogen Infection and Disease
Development
3.1. Environmental Conditions
3.1.1. Temperature
3.1.2. Humidity
3.1.3. Atmosphere Control
3.2. Fruit Resistance to Fungal Attack
3.2.1. Maturity
3.2.2. Biochemical Defense
3.2.3. Wound Healing
4. Approaches of Postharvest Disease Control
4.1. High-CO2 Treatment
4.2. Heat Treatment
4.3. Chemical Fungicides
4.4. Biological Control
4.5. Induced Resistance
References
6 - Integrated Approaches for Carrot Pests
and Diseases Management
R. M. Davis and J. Nuñez
1. Introduction
2. Diseases Caused by Bacteria
2.1. Bacterial Leaf Blight
2.1.1. Integrated Management of Bacterial Leaf Blight
2.2. Scab
2.2.1. Integrated Management of Scab
2.3. Soft Rot
2.3.1. Integrated Management of Soft Rot
3. Foliar Diseases Caused by Fungi
3.1. Alternaria Leaf Blight
3.1.1. Integrated Management of Alternaria Leaf Blight
3.2. Cercospora Leaf Blight
3.2.1. Integrated Management of Cercospora Leaf Blight
3.3. Downy Mildew
3.3.1. Integrated Management of Downy Mildew
3.4. Powdery Mildew
3.4.1. Integrated Management of Powdery Mildew
3.5. Rust
3.5.1. Integrated Management of Rust
4. Diseases Caused by Soil-Borne Fungi
4.1. Black Rot
4.1.1. Integrated Management of Black Rot
4.2. Cavity Spot
4.2.1. Integrated Management of Cavity Spot
4.3. Cottony Rot
4.3.1. Integrated Management of Cottony Rot
134
134
134
135
135
135
136
136
136
137
137
138
138
138
141
144
149
149
151
151
151
152
153
153
154
154
154
155
156
157
157
158
158
159
160
160
161
161
162
162
163
164
165
CONTENTS
4.4. Crown Rot
4.4.1. Integrated Management of Crown Rot
4.5. Damping-off
4.5.1. Integrated Management of Damping-off
4.6. Itersonilia Canker
4.6.1. Integrated Management of Itersonilia Canker
4.7. Phytophthora Root Rot
4.7.1. Integrated Management of Phytophthora Root Rot
4.8. Root Dieback
4.8.1. Integrated Management of Root Dieback
4.9. Southern Blight
4.9.1. Integrated Management of Southern Blight
4.10. Violet Root Rot
4.10.1. Integrated Management of Violet Root Rot
5. Postharvest Diseases
5.1. Black Root Rot
5.1.1. Integrated Management of Black Root Rot
5.2. Crater Rot
5.2.1. Integrated Management of Crater Rot
5.3. Licorice Rot
5.3.1. Integrated Management of Licorice Rot
6. Diseases Caused by Viruses and Phytoplasmas
6.1. Carrot Motley Dwarf
6.1.1. Integrated Management of Carrot Motley Dwarf
6.2. Carrot Thin-leaf
6.2.1. Integrated Management of Carrot Thin-leaf
6.3. Carrot Virus Y
6.3.1. Integrated Management of Carrot Virus Y
6.4. Aster Yellows and BLTVA (Beet Leafhopper-transmitted
Virescence Agent) Yellows
6.4.1. Integrated Management of Aster Yellows and BLTVA
7. Diseases Caused by Nematodes
7.1. Cyst Nematodes
7.1.1. Integrated Management of Cyst Nematodes
7.2. Root-knot Nematodes
7.2.1. Integrated Management of Root-knot Nematodes
8. Conclusions
References
ix
165
166
166
167
168
168
168
169
169
170
170
171
171
172
172
172
173
174
174
174
175
175
175
177
177
177
178
178
178
180
181
181
181
182
183
184
184
Section 2 - Emerging Technologies in IPM/IDM
7 - Integrated Agricultural Pest Management through Remote
Sensing and Spatial Analyses
M. Kelly and Q. Guo
1. Introduction
2. Remote Sensing
191
191
194
x
CONTENTS
3. Spatial Analysis
4. Remaining Challenges
5. Conclusions
References
8 - Applications of Information Technology in IPM
Y. Xia, R. Magarey, K. Suiter and R. Stinner
1. Introduction
2. IT and Pest Management
3. The World Wide Web and Database Technology: Applications
in Pest Management
3.1. The World Wide Web
3.2. Database Technology
3.3. Applications of the Web and Database in IPM
4. Web Services and their Applications in Pest Management
4.1. The Role of Web Services in Data Sharing
4.2. Web Services and their Role in IPM
4.2.1. Consumer/Provider Interoperability
via Web Services
4.2.2. Web Services Registries and their Impact on IPM
5. The IT Role and Impact on Defence
6. Using IT as IPM Decision Support System
6.1. What is a Decision Support System?
6.1.1. Data Collection
6.1.2. Analysis
6.1.3. Interpretation
6.1.4. Delivery
6.2. Limitations and Future Development
References
9 - Biology and Applications of Bacillus thuringiensis in Integrated
Pest Management
N. Arora, N. Agrawal, V. Yerramilli and R. K. Bhatnagar
1. Introduction
2. Ecology and Prevalence
3. Evolution
4. Classification and Nomenclature
5. Structure and Function
6. PCR Screening
7. Mechanism of Action
8. Applications
8.1. Control of Mosquitoes and Blackflies
8.2. Formulations
8.3. Bt-Transgenics
9. Development of Resistance and its Management
9.1. Resistance Management
198
200
202
203
209
209
209
211
211
212
213
214
214
215
215
216
217
218
218
219
220
221
222
224
225
227
227
228
229
229
230
231
231
232
232
233
234
235
236
CONTENTS
10. Integrated Pest Management (IPM)
11. Conclusions
References
10 - Mycorrhizae in the Integrated Pest and Disease Management
K. G. Mukerji and A. Ciancio
1. Introduction
2. Ectomycorrizae
3. Arbuscular Mycorrhizae
3.1. Mycorrhizosphere
3.2. Impact of Biocontrol Agents on AM Formation and
Disease Control
4. Soil and Root Borne Diseases
5. Leaf Pathogens
6. Plant Parasitic Nematodes
7. Conclusions
References
xi
237
238
239
245
245
246
248
250
252
253
255
256
258
258
Section 3 - Molecular Aspects in IPM/IDM
11 - Integrated Management of Insect Borne Viruses by Means
of Transmission Interference as an Alternative to Pesticides
L. Fernández-Calvino, D. López-Abella and J. J. López-Moya
1. Introduction
2. Modes of Transmission
2.1. Non-circulative Transmission
2.2. Circulative Transmission
3. Practices to Control Vectors and Virus Spread
3.1. Use of Insecticides in Virus Control: Drawbacks
3.2. Alternative Control Strategies
4. Interference with Transmission
4.1. Interference with the Insect
4.2. Virus Specific Receptors in Insects
5. Prospects
6. Conclusions
References
12 - Novel Tensio-active Microbial Compounds
for Biocontrol Application
M. Kulkarni, R. Chaudhari and A. Chaudhari
1. Introduction
2. Biosurfactants
3. Rhamnolipids
3.1. Structure of Rhamnolipids
3.2. Physiological Role of Rhamnolipids
4. Microbial Production of Rhamnolipids
269
269
270
273
275
277
277
278
280
280
283
284
285
286
295
295
295
296
297
298
298
xii
CONTENTS
5. Applications
6. Biological Activities
6.1. Fungicidal Activity
6.2. Antiviral Activity
7. Conclusions
References
13 - Molecular Detection in Integrated Pest
and Disease Management
M. Finetti-Sialer and L. Rosso
1. Introduction
2. Basic Principles of Detection
2.1. Conventional Tools
2.2. Molecular Tools
2.2.1. Immunodetection
2.2.2. Monoclonal Antibodies
2.2.3. Molecular Detection
2.3. Molecular Probes
2.3.1. Fluorescent Probes
2.3.1.1. Molecular Beacons
2.3.1.2. Scorpions™
2.3.1.3. Taqman
2.3.2. Hybridization Techniques
2.4. Immunofluorescence and In-situ Hybridisation
3. Applications in Disease and Pest Management
3.1. Field Detection of Plant Pathogens
3.1.2. Biosensors
3.2. Virus Detection in Vectors
3.3. Soil DNA Extraction and Microbial Detection
3.4. Quarantine Detection of Invasive Species
3.5. Epidemiology and Detection
3.6. Detection of Biological Antagonism
3.6.1. Parasitoids
3.6.2. Biological Control Agents
4. Molecular Markers and Resistance
5. Conclusions
References
Index
299
300
300
301
302
302
305
305
306
306
307
307
309
309
310
310
310
311
312
312
312
313
313
314
315
315
317
318
318
318
319
320
322
322
329
CONTRIBUTORS
James D. Dutcher
Entomology Department,
University of Georgia,
Tifton, GA, USA
Neema Agrawal
International Center for Genetic
Engineering and Biotechnology
(ICGEB), Insect Resistance Group
PO Box 10504,
Aruna Asaf Ali Marg,
New Delhi-67, INDIA
Mariella M. Finetti Sialer
Dipartimento di Protezione delle
Piante e Microbiologia Applicata,
Università degli Studi,
Bari, Italy
Naresh Arora
International Center for Genetic
Engineering
and Biotechnology (ICGEB),
Insect Resistance Group,
PO Box 10504,
Aruna Asaf Ali Marg,
New Delhi-67, INDIA
D. López-Abella
Departamento de Biología de Plantas,
Centro de Investigaciones Biológicas
(CIB, CSIC), Ramiro de Maeztu 9,
28040-Madrid, Spain
Raj K. Bhatnagar
International Center for Genetic
Engineering and Biotechnology
(ICGEB), Insect Resistance Group
PO Box 10504,
Aruna Asaf Ali Marg,
New Delhi-67, INDIA
Qinghua Guo
Geospatial Imaging and Informatics
Facility, Department of
Environmental Sciences, Policy and
Management, University of
California at Berkeley,
Berkeley, CA 9420-3114, USA
Ambalal Chaudhari
School of Life Sciences,
North Maharashtra University,
Jalgaon, India
Ranjana Chaudhari
School of Life Sciences,
North Maharashtra University,
Jalgaon, India
Maggi Kelly
Geospatial Imaging and Informatics
Facility, Department of
Environmental Sciences, Policy and
Management, University of
California at Berkeley, Berkeley, CA
9420-3114, USA
Aurelio Ciancio
Consiglio Nazionale delle Ricerche,
Istituto per la Protezione delle Piante,
70126 Bari, ITALY
Meenal Kulkarni
School of Life Sciences,
North Maharashtra University,
Jalgaon, India
R. Michael Davis
Department of Plant Pathology,
University of California,
Davis 95616, CA, USA
Joe Nuñez
UC Cooperative Extension,
Bakersfield, CA, USA
xiii
xiv
CONTRIBUTORS
L. Fernández-Calvino
Departamento de Biología de Plantas,
Centro de Investigaciones Biológicas
(CIB, CSIC), Ramiro de Maeztu 9,
28040-Madrid, Spain
Roger D. Magarey
North Carolina State University &
Center for Plant Health Science and
Technology, APHIS, Raleigh, NC,
USA
J. J. López-Moya
Laboratorio de Genética Molecular
Vegetal, Consorcio CSIC-IRTA,
Instituto de Biología Molecular de
Barcelona (IBMB, CSIC),
Jordi Girona, 18-26, 08034
Barcelona, Spain
K. G. Mukerji
Department of Botany,
University of Delhi,
Delhi-110007, INDIA
Forrest W. Nutter, Jr.
Department of Plant Pathology,
Iowa State University,
Ames, USA
Laura Rosso
Consiglio Nazionale delle Ricerche,
Istituto per la Protezione delle Piante,
70126 Bari, ITALY
Ronald Stinner
NSF Center for Integrated Pest
Management, North Carolina State
University, Raleigh, NC, USA
Karl Suiter
NSF Center for Integrated Pest
Management, North Carolina State
University, Raleigh, NC, USA
T. B. Sutton
CPHST/ APHIS
North Carolina State University,
Raleigh, NC, USA
Shi-Ping Tian
Institute of Botany,
The Chinese Academy of Sciences,
Beijing 100093, P. R. China
Yulu Xia
NSF Center for Integrated Pest
Management,
North Carolina State University,
Raleigh, NC, USA
Vimala Yerramilli
Department of Botany,
Ch. Charan Singh University,
Meerut-250005, UP, INDIA
PREFACE
The proposal for this series originated during a short term visit of Professor Mukerji
to the Plant Protection Institute of CNR at Bari, Italy, in November 2005. Both
editors agreed on the need to produce a volume focusing on recent advances and
achievements which changed the practice of crop protection in the last decade. The
opera rapidly evolved towards a long term editorial endeavour, yielding a multidisciplinary series of five volumes.
In view of environmental and health concerns, a determined effort is currently
made in almost any agroecosystem in the world, to reduce and rationalize the use of
chemicals (pesticides, fungicides, nematocides etc.) and to manage pests/pathogens
more effectively. This consciousness is not only related to the need of nourishing a
still growing world population, but also derives from the impact of side effects of
farming, like soil, water and environmental contamination, calling for a responsible
conservation of renewable resources. There are increasing expectations at the
producers and consumers levels, concerning low inputs agriculture and residues-free
food. Disciplines like IPM/IDM (integrated pest management / integrated disease
management) are now central to the science and technology of crop protection. In
the classical version of IPM/IDM, a pesticide/fungicide is applied only when the
pathogen population reaches a level that would lead to economic losses in the crop.
In other words, classical IPM/IDM concentrates on reducing the numbers of noxious
organisms through the application of agrochemicals. However, IPM/IDM actually
means “A disease management system that, in the context of the associated
environment and the population dynamics of the pest/pathogen species, utilises all
suitable techniques and methods in a manner as compatible as possible and
maintains the pest/pathogen population at levels below those causing economic
injury”. IPM/IDM in the broad sense has been defined as “the optimization of
pest/pathogen control in an economically and ecologically sound manner,
accomplished by the coordinated use of multiple tactics to assure stable crop
production and to maintain pathogen pest damage below the economic injury level,
while minimizing hazards to humans, animals, plants and the environment”.
Plant health depends on the interaction of a plethora of microorganisms,
including pathogens and pests, which give rise to a complex system based on
multiple food webs and organisms interactions, including the physical and chemical
environment in which plants grow. Thus IPM/IDM moves beyond a one-plant onepathogen/one-pest control view of disease control towards an integrated view of
plant health as a result of complex interactions. Moreover, the basic concern of
IPM/IDM is with designing and implementing pest/disease management practices
that meet the goals of farmers, consumers and governments in reducing pest/disease
losses while at the same time safeguarding against the longer term risks of
environmental pollution, hazard to human health and reduced agricultural
sustainability.
Due to the large amounts of data available in IPM/IDM, the volume is not a
comprehensive manual, because of the wide range of topics and the numerous,
sometimes specific aspects, characterizing this discipline. However, our effort in
compiling the contributions of the first volume of the series attempted to collect
xv
xvi
PREFACE
concepts and achievements which will probably produce popular practices and tools,
available in the next decades for crop protection. A growing number of discoveries,
applications and technologies are available today for farming, gradually re-shaping
worldwide pest and disease management and control. During the last decades,
dramatic changes deriving from the digital and molecular revolutions were
experienced in the way farmers may monitor and control pests and diseases, and
some of them are sought and described in this first volume.
A first section covers modeling, management and environment related issues,
ranging from advances in modeling and monitoring, to potentials of remote sensing
technologies. The section also includes a review of resurgence and replacement
causing pest outbreaks, a chapter describing the role of plant disease epidemiology
in developing successful integrated management programs, a chapter describing the
effects of climate changes on plant protection and two applied reviews, treating
carrot and post-harvest diseases management. In a second section we grouped
emerging technologies including the application of information technology or
remote sensing and of Bacillus thuringiensis or mycorrhizae in IPM. In a third
section, molecular issues in IPM/IDM are grouped, with chapters treating the
management of insect borne viruses through transmission interference as an
alternative to pesticides, the novel microbial compounds suitable for pest/disease
control or the use of molecular diagnostic tools in IPM/IDM.
The volume is a compilation of the thoughts from a wide array of experts in the
areas of plant protection, microbiology, plant pathology, ecology, agricultural
biotechnology, food safety and quality, covering a wide range of problems and
solutions proposed. The chapters are contributed by leading experts with several
research years’ expertise, investigating and applying advanced tools in their work,
and offer several illustrations and graphs, helping the reader in his/her study.
A. Ciancio
K. G. Mukerji
Section 1
Modeling, Management and Epidemiology
R. D. MAGAREY AND T. B. SUTTON
HOW TO CREATE AND DEPLOY INFECTION
MODELS FOR PLANT PATHOGENS
North Carolina State University, Raleigh & Center for Plant Health
and Technology, APHIS, NC,USA
Abstract. This chapter is designed as a practical guide on how to create and deploy infection models for
plant disease forecasting. Although, infection models have been widely and successfully used in plant
pathology for many years, there is a general lack of standards for model development. In part, this is
because most disease forecast models tend to be either complex or specialized. The first part of this guide
is an overview of the biological considerations for infection, including temperature, moisture and splash
dispersal requirements. The second part is a review of the strengths and weaknesses of new and
commonly used infections models. Since weather conditions and infection risk alone does not determine
disease severity, the guide provides some practical suggestions for integrating host, pest and cultural
factors into a disease forecast in the third part of the chapter. The fourth part covers the best methods for
collecting or obtaining the weather inputs used in infection models. The fifth section covers techniques
for model validation both from a biological and commercial perspective. The final section briefly covers
techniques for information delivery focusing on the internet.
1. INTRODUCTION
Plant pathologists, research scientists or agronomists tasked with constructing plant
disease forecast models might realistically hope to go to a publication or an on-line
source and find an encyclopedia-like model building reference. In an ideal world,
these models would be generic such that they would be suitable for use on a many
different diseases. It would be easy to ‘plug and play’ models into a disease
forecasting system since the model inputs and outputs would be standardized. In
addition, each model would contain a number of biologically based parameters and a
reference table would give these parameter values or their ranges for economically
important pathogens. Finally, if the encyclopedic site was on-line, it would be
possible to upload a weather data file and test the model on-line.
Entomologists have an on-line resource available at the UC-Davis IPM web site
(Anonymous, 2006) that meets some but not all of these ideal specifications.
Approximately 90 degree day models are available at this web site. Each model has
almost the same parameters: lower (and in some cases upper) developmental
thresholds and the degree day requirements for each life stage. Another on-line
resource has a library of these developmental requirements for over 500 insects
(Nietschke et al., unpublished data). The consequence of these databases and other
resources is that an entomologist can easily make prediction models for these pests
with one simple model and inputs of daily average temperature.
3
A. Ciancio & K. G. Mukerji (eds.), General Concepts in Integrated Pest and Disease
Management, 3–25.
© 2007 Springer.
4
R. D. MAGAREY AND T. B. SUTTON
Plant pathologists are in a much less favorable position. In contrast to
entomology, the UC Davis IPM web site has forecast models available for only 12
diseases. Although many more than 12 plant diseases have been successfully
modeled, the complexities of the model design and the lack of standardization make
such an encyclopedic task difficult if not impossible. More problematic than the lack
of available models is the lack of standardization among models. Often there may be
many different models for important diseases adding to the confusion. On the UC
Davis site, two diseases have ten or more models each, some of them are quite
different from the others. A quick perusal of the model database reveals a lack of
standardization on almost every facet of model construction including model
description, time steps, inputs, methods of calculating risk and outputs.
This of course does not mean that entomology is a more advanced science.
Although some entomologists might wish to advocate such a position, there are
many more fundamental reasons why it is harder to construct an encyclopedia
resource for plant disease forecast models. The most important reason is that the
insect models discussed above are simply predicting pest phenology based on
temperature accumulation, while many plant disease models are predicting risk.
Even when the model simply estimates the risk of infection it may integrate many
complex biological processes such as sporulation, germination, spore dispersal and
pathogen and host phenology, as will been seen later in the chapter. These biological
complexities make the creation of a generic risk model difficult.
While biological complexity might be the principal reason, there are other
contributing factors. Many plant pathologists work on one or two commodities and
usually one or two diseases on each commodity. This tends to lead towards
specialization in that many models created by scientists may be complex and highly
customized. While this individual approach may help the scientists who create the
models publish original research, it tends to work against standardization. There are
of course some examples of models which have been successfully used generically.
For example the FAST system for Alternaria like diseases on tomato has been
adapted for apple, pear and potato (Madden et al., 1978; Montesinos & Vilardell,
1992; Shuman & Christ, 2005).
An additional factor limiting the ability of scientists to use models generically,
is that many models do not have biologically based parameters which limits the
ability to adapt a model to another pathogen. Since there is no standardization of
model parameters, there is also no incentive for scientists to compile databases of
these parameter values, a classic catch-22 situation. A final problem is that many
models are simply based on statistical relationships between average or summary
weather variables and observed disease incidence for a specific crop and location. It
is unclear if these types of models would provide useful results when used in a
different climate or pathosystem.
Another problem relates to the lack of standardization of environmental inputs.
Some models were developed before automated weather stations were available to
provide hourly weather data and instead use simple daily weather data. Leaf wetness
has been historically difficult to measure (Magarey et al., 2005a), so some disease
INFECTION MODELS FOR PLANT PATHOGENS
5
models have used average relative humidity (RH) or hours above a specific RH
threshold. In addition there might be differences about the canopy location or the
protocol for collecting these weather inputs.
Given all these issues, it is tempting to wonder if an effort to standardize and
catalog plant disease forecast or infection models is even practical. However, some
of the negative points discussed above are possibly exceeded by many of the
positive points about plant disease forecast models including: i) international
experience with the use, application and development of disease forecast models for
well over 50 years (Campbell & Madden, 1990); ii) many plant diseases are highly
weather driven making them perfect candidates for forecasting (Waggoner, 1960);
and iii) a good repository of published data to create infection models albeit not in a
standardized format.
In this chapter, some of the practical issues for creating and using simple
infection models for plant pathogens are examined. Infection models are a small
subset of disease forecast models, however they are quite important because most
plant disease are caused by fungi and most fungi with the exception of powdery
mildews and some ‘wound’ pathogens’ have some sort of environmental
requirements (Huber & Gillespie, 1992; Waggoner, 1960). While many plant
pathogenic processes are temperature driven, infection also requires moisture and
moisture is limiting in most terrestrial environments (Magarey et al., 2005a).
Infection is the process by which a plant pathogen initiates disease in a plant. In this
paper, we use a very broad definition of infection, which may also include
requirements for dispersal, spore germination and sporulation.
In our approach to infection modeling, we lean towards the fundamental
approach rather than an empirical one (Madden & Ellis, 1988). In the fundamental
approach, infection models are created from experiments in the laboratory and
controlled environmental chambers and describe the infection response in relation to
environmental parameters. An alternative is the empirical approach where
qualitative rules or quantitative models are created based on statistical relationships
often between summarized environmental inputs and disease observations in the
field, usually from four of more years of data (Madden & Ellis, 1988). The empirical
approach has the advantage that data from controlled or laboratory tests are usually
not required. They may also have the advantage of being simple and easy to
develop, especially those that are qualitative. However, the empirical approach may
not lead itself well to generic and standardized approach since it likely to be a
unique relationship for each pathosystem. Also the empirical relationship may not
‘hold up’ outside of the specific circumstance in which it is developed. Thirdly, with
modern electronic weather data there is no longer a need for models to be developed
from summary environmental variables. Although the empirical approach continues
to be important in plant pathology, models developed using this approach are
outside of the scope of this chapter.
In the first section of this chapter, we review the biological requirements for
infection. This includes temperature, moisture and splash dispersal requirements of
plant pathogens, factors usually incorporated into the infection model itself. The
6
R. D. MAGAREY AND T. B. SUTTON
second is a review of the strengths and weaknesses of new and commonly used
infection models. Since weather conditions and infection risk alone does not
determine disease severity, the guide provides some practical suggestions for
integrating host, pest and cultural factors into a risk estimation. The fourth section
deals with the best methods to collect or obtain the weather inputs used in infection
models. The fifth section covers techniques for model validation and validation and
in the final section techniques for information delivery are briefly discussed.
2. BIOLOGICAL REQUIREMENTS FOR INFECTION
Pathogens vary in their temperature and moisture requirements for infection (Table 1).
An organism’s temperature requirements for infection can be summarized by the
cardinal temperatures, Tmin, Topt and Tmax. Moisture requirements may be for free
surface moisture or high humidity. In general, there is little practical difference
between these two variables since high humidities measured at a standard weather
station environment may constitute wetness in a canopy. Moisture duration
requirements can be summarized by Wmin, the minimum wetness duration
requirement for infection (Magarey et al., 2005c).
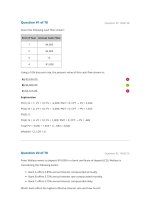
Plant pathogens can have quite different temperature-moisture responses for
infection (Fig. 1), for example web blotch of peanut caused by Didymella
arachidicola has a high Tmin and Wmin, while cucurbit downy mildew caused by
Pseudoperonospora cubensis has a relatively low Tmax and Wmin. Finally, there are
bacteria such as Erwinia amylovora or xerophytic pathogens such as powdery
mildews which may have little or no moisture requirement beyond that of rain for
splash dispersal (Miller et al., 2003; Steiner, 1990).
Figure 1. Comparison of temperature-moisture response for infection for four fungal
pathogens: A) Venturia inaequalis (causal agent of apple scab); B) Pseudoperonospora
cubensis (cucurbit downy mildew); C) Sclerotinia sclerotiorum (white mold of beans); and
D) Didymella arachidicola (peanut web blotch) (Magarey et al., 2005c).
INFECTION MODELS FOR PLANT PATHOGENS
7
Table 1.Example of infection parameters for selected plant pathogens.
Pathogen
Tminr
Tmaxs
Toptt
Wminu
Wmax v
Didymella
arachidicola
13.3
35
18.5
24
210
Subrahmanyam
& Smith, 1989
Pseudoperonospora
cubensis
1
28
20
2
12
Cohen, 1977
Sclerotinia
sclerotiorum
1
30
25
48
144
Weiss et al.,
1980
Venturia
inaequalis
1
35
20
6
40.5
Stensvand et al.,
1997
Sphaerotheca
macularis f. sp.
fragariae
5
24
30
0
NA*
Miller et al.,
2003
References
*NA = not applicable.
Generally the temperature and moisture requirements for infection are
determined in controlled environment studies where plants or plant parts are
incubated in moist environments at various temperatures (Madden & Ellis, 1988;
Rotem, 1988). Presently, there are probably about 100-200 pathogens where this
infection response has been described (Magarey et al., 2005c). In the case where
these data are not available and experiments can not be conducted, the moisture and
temperature requirements for infection must be estimated from scientific reports
such as germination requirements, growth in culture or field observations. Useful
sources of information include the CABI Crop Protection Compendia and the APS
Plant Disease Compendia. Literature searches in abstract databases such as CAB
abstracts, AGRICOLA and BIOSIS are also helpful sources of information. A dated
but extensive review of temperature requirements may be helpful if no other data are
available (Togashi, 1949).
Some pathogens also require continuous moisture for infection while others can
endure dry periods without disruption to the infection process. For example, two
species of Puccinia are sensitive to dry interruptions of 1-2 hours, whereas Venturia
inaequalis and Cersospora carotae are relatively insensitive and can survive for
more than 24 hours (Magarey et al., 2005c). It should be noted that many published
studies of interruption to wetness may not be representative of real world conditions
where spores may be quickly desiccated and should be treated with caution.
Interruptions to wetness can be handled by terminating the infection process or by
reducing the severity of infection.
8
R. D. MAGAREY AND T. B. SUTTON
Infection potential may also be related to other parts of the disease cycle
(Magarey et al., 1991; Xia et al., 2007). Temperature and moisture or high humidity
may also be required for sporulation (Colhoun, 1973). For example grape downy
mildew has a high relative humidity requirement for the formation of sporangia
during secondary infection (Magarey et al., 1991).
Another important moisture requirement is for splash dispersal. Many
pathogens have relatively heavy spores that are not easily liberated and dispersed by
wind or rain splash may be required to liberate spores from a fruiting structure (Fitt
& McCartney, 1986). For this requirement, 2 mm of rain has been used in the case
of ascospores of grape powdery mildew to allow for the splash transport of
ascospores from mature bark to new growth (Gadoury & Pearson, 1990). Only 0.25
mm of rain is required to splash Erwinia amylovora bacteria from overwintering
cankers to the stigma, where it causes infection (Steiner, 1990). Rain 10 mm or more
has been used as a splash requirement for grape downy mildew, because puddling is
required to liberate sporangia from the soil, which must then be splashed up into the
grape canopy (Magarey et al., 1991). The choice of a differences between these
figures (0.25, 2 and 10 mm) may represent the difference in how far the spores must
be splashed from their overwintering location.
Another requirement is light or dark. Plasmopara viticola, causal agent of grape
downy mildew, requires darkness for formation of sporangia (Magarey et al., 1991)
and apple scab ascospores are not released during darkness (Stensvand, et al., 1998).
Puccinia graminis has a requirement for light to complete the infection process
(Pfender, 2003).
3. INFECTION MODELS
After having determined the environmental requirements for infection it is necessary
to have some sort of model to process the weather data into infection potential. The
easiest way to create a model of infection potential is to use a simple rule using daily
weather data. Commonly these combine minimum temperature and rain for
example, the 10 C and 2.5 mm rule for grape powdery mildew ascosporic infection
(Gadoury & Pearson, 1990) and the 10:10:24 rule for grape downy mildew infection
(Magarey et al., 2002). There are also other examples of simple decision aids such
as charts and graphs that use combinations of daily average temperature and hours
of wetness per day (Seem & Russo, 1984). However usually for most pathogens,
hourly weather data are required to capture the infection response and these call for
a more complex model. The model is essentially a biological clock that tracks the
accumulation of favorable conditions usually hour by hour. There may be initiation
conditions to start the clock for example rain splash, daylight or darkness. The
counter of the clock may be reset to zero by dryness or when relative humidity or
temperature falls below a certain threshold or when spores have been liberated and
no more are available.
There are a variety of modeling approaches which are summarized below
(Table 2). The modeling approaches have their strengths and weaknesses and model
selection depends upon a number of factors. These include the quantity of data
INFECTION MODELS FOR PLANT PATHOGENS
9
available for model development and also whether the developer is creating a suite
of models or an individual model. A common approach to modeling is what we call
a matrix. An example of matrix approach is the Wallin potato late blight model
(Krause & Massie, 1975). In this matrix, rows represent the temperature requirement
expressed as average temperature during the wetness period and columns represent
moisture requirement expressed as hours above 90% RH. Lower temperatures and
longer moisture periods yield higher disease severity combinations. Bailey took this
concept one step further by creating an interactive generic matrix based upon
combinations of temperature and relative humidity and the number of hours required
to achieve infection at each combination (Bailey, 1999).
Where the infection response has been observed at multiple temperature and
wetness combinations it is possible to create an infection model using regression
equations, such as those based on polynomials, logistic equations, and complex
three-dimensional response surfaces (Magarey et al., 2001; Pfender, 2003). These
Table 2. Comparison of different infection modeling approaches.
Approach
Strengths
Weaknesses
Matrix
(Krause & Massie, 1975;
Mills, 1944; Windels, et al.,
1998)
Easy: converts
moisture/temperature
combinations into severity
values or risk category. Tried
and true approach.
Data to populate matrix
may not be readily
available.
Used widely in plant pathology
(Pfender, 2003; Magarey et al.,
2005c).
Model already available for
many economically important
plant pathogens.
Parameters not
biologically based.
Three–dimensional response
surface
(Duthie, 1997)
Describes infection response in
detail.
Parameters not
biologically based.
Complex, requires long
processing time and
extensive data set for
model creation.
Degree wet hours
(Pfender, 2003)
Simple, based on degree hours
which is widely used in
entomology. Requires only
Tmin and Tmax.
Simple, based on crop
modeling functions, requires
only Tmin, Topt and Tmax.
Recently developed,
assumes thermal response
is linear.
Regression:
– polynomial
(Evans et al., 1992)
– logistic
(Bulger et al., 1987)
Temperature-moisture
response function (Magarey
et al., 2005c)
Requires data set for
model development.
Recently developed.
10
R. D. MAGAREY AND T. B. SUTTON
models are now widely used in plant pathology, and so infection models are
available for many economically important plant pathogens. The problem with many
of these modeling approaches is that they are not generic and the model parameters
are not biologically based, thus they do not serve as a good template to develop a
suite of disease forecast models using the same general equation. If there are many
observations (>60) of the temperature-moisture response it is also possible to create
a 3-D response surface (Duthie, 1997). The three dimensional response surfaces may
capture the infection response in the most detail but may be too complex and
processing intensive for many operational disease forecasting applications.
A novel approach is the concept of degree hour wetness duration (Pfender,
2003). The beauty of the degree hour wetness duration concept is its simplicity and
the fact that it aligns infection models closely with those used for insect phenology
modeling. The weakness of the degree hour approach is that not all pathogens may
respond in a linear fashion between Tmin and Tmax. Taking this one step further is our
concept of the temperature-moisture response function (TMRF) (Magarey et al.,
2005c). This is a modification of temperature-response function which is commonly
used for crop modeling (Yan & Hunt, 1999). The models inputs are the cardinal
temperatures for growth and the minimum wetness duration requirement. There are
several advantages of TMRF including the fact that it only needs inputs of cardinal
temperatures to model the infection response, thus the TMRF is ideally suited to
creating simple infection models for exotic plant pathogens. Another reason for
using the TMRF approach is that it aligns infection models with those used for crop
modeling, thus potentially making it easier for infection models to be incorporated
into more complex decision support systems.
The TMRF model calculates predicted infection severity values for a given
wetness duration and temperature:
I = W f(T) / Wmin ≥ W/ Wmax
(1)
where, W = wetness duration h, f(T) = temperature response function (Yin, et al.,
1995), and Wmin, max = the minimum and maximum value of the wetness duration
requirement.
For pathogens that require high relative humidity rather than free moisture the
wetness requirement may also be defined as the number of hours above a relative
humidity threshold. The critical disease threshold for the TMRF was defined as 20 %
disease incidence or 5 % disease severity on an infected plant part at non-limiting
inoculum concentration, but it could be a custom defined value. The parameter Wmax
provides an upper boundary on the value of W since temperature is not always a rate
limiting factor. The model uses the temperature response function of Yin et al.
(Yan & Hunt, 1999; Yin et al., 1995) which is a simplified and improved version of
the rice clock model (Gao et al., 1992). The function uses a pathogen’s cardinal
temperatures, to estimate the shape parameter and the temperature response,