Bank Funding Structures and Risk: Evidence from the Global Financial Crisis pptx
Bạn đang xem bản rút gọn của tài liệu. Xem và tải ngay bản đầy đủ của tài liệu tại đây (1.01 MB, 33 trang )
Bank Funding Structures and Risk: Evidence
from the Global Financial Crisis
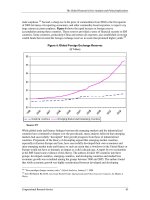
Francisco Vazquez and Pablo Federico
WP/12/29
© 2012 International Monetary Fund WP/12/29
IMF Working Paper
European Department
Bank Funding Structures and Risk: Evidence from the Global Financial Crisis
1
Prepared by Francisco Vazquez and Pablo Federico
Authorized for distribution by Enrica Detragiache
January 2012
Abstract
This paper analyzes the evolution of bank funding structures in the run up to the global financial crisis
and studies the implications for financial stability, exploiting a bank-level dataset that covers about
11,000 banks in the U.S. and Europe during 2001–09. The results show that banks with weaker
structural liquidity and higher leverage in the pre-crisis period were more likely to fail afterward. The
likelihood of bank failure also increases with bank risk-taking. In the cross-section, the smaller
domestically-oriented banks were relatively more vulnerable to liquidity risk, while the large cross-
border banks were more susceptible to solvency risk due to excessive leverage. The results support
the proposed Basel III regulations on structural liquidity and leverage, but suggest that emphasis
should be placed on the latter, particularly for the systemically-important institutions. Macroeconomic
and monetary conditions are also shown to be related with the likelihood of bank failure, providing a
case for the introduction of a macro-prudential approach to banking regulation.
JEL Classification Numbers: G21; G28
Keywords: Bank capital; bank liquidity creation; financial crisis; Basel III; macro-prudential
regulations
Author’s E-Mail Address: ;
1
The authors wish to thank, without implicating, Mark De Broeck, Alexander Hoffmaister, Srobona Mitra,
Ashoka Mody, Cyril Pouvelle, Lev Ratnovski, Carmen Reinhart, Pedro Rodriguez, Rafael Romeu, Thierry Tressel,
Jerome Vandenbussche, Carlos Vegh, Ruud Vermeulen, and comments from seminar participants at the IMF.
This Working Paper should not be reported as representing the views of the IMF.
The views expressed in this Working Paper are those of the author(s) and do not necessarily
represent those of the IMF or IMF policy. Working Papers describe research in progress by the
author(s) and are published to elicit comments and to further debate.
2
Contents Page
Abstract 1
I. Introduction 3
II. Related Literature and Empirical Hypotheses 5
III. Data and Target Variables 7
A. Indicators of Bank Liquidity and Leverage 8
B. Global Banks Versus Domestic Banks 9
C. Bank Failure 10
IV. Empirical Approach and Quantitative Results 10
A. Stylized Facts 11
B. Baseline Regressions 13
C. Are There Threshold Effects at Play? 14
D. Are There Differences Across Bank Types? 15
V. Robustness Check 16
VI. Concluding Remarks 16
VII. References 18
Tables
1. Stylized Balance-Sheet and Weights to Compute the NSFR 23
2. Sample Coverage by Region and Type 24
3. Summary Statistics of Selected Variables, 2001−07 25
4. Pairwise Correlations Between Selected Variables, 2001−07 26
5. Baseline Regressions 27
6. Estimates of the Marginal Impact on the Probabilities of Default 28
7. Probit Regressions by Sub-Samples of Liquidity and Leverage 29
8. Regressions by Bank Types 30
9. Results of Robustness Checks by Alternative Definitions of Liquidity and Capital 31
Table 10. Results of Robustness Checks by Sub-Components of Bank Failure 32
Figures
1. Evolution of Structural Liquidity and Leverage Before the Crisis, 2001−07 20
2. Evolution of Structural Liquidity and Leverage by Failed and Non-Failed Banks 21
3. Distributions of Pre-Crisis Liquidity and Leverage across Failed and Non-Failed 22
3
I. INTRODUCTION
The global financial crisis raised questions on the adequacy of bank risk management
practices and triggered a deep revision of the regulatory and supervisory frameworks
governing bank liquidity risk and capital buffers. Regulatory initiatives at the international
level included, inter alia, the introduction of liquidity standards for internationally-active
banks, binding leverage ratios, and a revision of capital requirements under Basel III (BCBS
2009; and BCBS 2010 a, b).
2
In addition to these micro-prudential measures, academics and
policymakers argued for the introduction of a complementary macro-prudential framework to
help safeguard financial stability at the systemic level (Hanson, Kashyap and Stein, 2010).
This regulatory response was implicitly based on two premises. First, the view that individual
bank decisions regarding the size of their liquidity and capital buffers in the run up to the
crisis were not commensurate with their risk-taking—and were therefore suboptimal from the
social perspective. Second, the perception that the costs of bank failures spanned beyond the
interests of their direct stakeholders due, for example, to supply-side effects in credit
markets, or network externalities in the financial sector (Brunnermeier, 2009).
The widespread bank failures in the U.S. and Europe at the peak of the global financial crisis
provided casual support to the first premise. Still, empirical work on the connection between
bank liquidity and capital buffers and their subsequent probability of failure is incipient.
Background studies carried out in the context of Basel III proposals, which are based on
aggregate data, concluded that stricter regulations on liquidity and leverage were likely to
ameliorate the probability of systemic banking crises (BCBS, 2010b).
3
In turn, studies based
on micro data for U.S. banks also support the notion that banks with higher asset liquidity,
stronger reliance on retail insured deposits, and larger capital buffers were less vulnerable to
failure during the global financial crisis (Berger and Bouwman, 2010; Bologna, 2011).
Broadly consistent results are reported in Ratnovski and Huang (2009), based on data for
large banks from the OECD.
This paper makes two contributions to previous work. First, it measures structural liquidity
and leverage in bank balance sheets in a way consistent with the formulations of the Net
Stable Funding Ratio (
NSFR), and the leverage ratio (EQUITY) proposed in Basel III. Second,
it explores for systematic differences in the relationship between structural liquidity,
2
On liquidity, the proposals comprise two prudential ratios that entail minimum binding standards: a Liquidity
Coverage Ratio (LCR), aimed at promoting banks’ resilience to liquidity risk over the short-term (a 30-day
period); and a Net Stable Funding Ratio (NSFR), aimed at promoting resilience over a one-year horizon. In
addition, a leverage ratio computed as shareholders’ capital over total assets was introduced to ensure a hard
minimum capital level, regardless of the structure of risk-weights in bank balance sheets.
3
This work also found evidence of non-linear effects at play, as the estimated marginal benefits of stricter
regulations seemed to drop with the size of the liquidity and capital buffers.
4
leverage, and subsequent probability of failure across bank types. In particular, we
distinguish between large, internationally-active banks (henceforth Global banks), and
(typically smaller) banks that focus on their domestic retail markets (henceforth Domestic
banks).
This sample partition is suitable from the financial stability perspective. Global banks are
systemically important and extremely challenging to resolve, due to the complexity of their
business and legal structures, and because their operations span across borders, entailing
differences in bank insolvency frameworks and difficult fiscal considerations. Furthermore,
the relative role of liquidity and capital buffers for bank financial soundness is likely to differ
systematically across these two types of banks. All else equal, Global banks benefit from the
imperfect co-movement macroeconomic and monetary conditions across geographic regions
(Griffith-Jones, Segoviano, and Spratt, 2002; Garcia-Herrero and Vazquez, 2007) and may
exploit their internal capital markets to reshuffle liquidity and capital between business units.
In addition, Global banks tend to enjoy a more stable funding base than Domestic banks due
to flight to safety, particularly during times of market distress. To the extent that these factors
are incorporated in bank risk management decisions, optimal choices on structural liquidity
and leverage are likely to differ across these two types of banks.
The paper exploits a bank-level dataset that covers about 11,000 U.S. and European banks
during 2001−09. This sample coverage allows us to study bank dynamics leading to, and
during, the global financial crisis. As a by-product, we document the evolution of structural
liquidity and leverage in the pre-crisis period, and highlight some patterns across bank types
to motivate further research. Contrary to expectations, the average structural liquidity in bank
balance sheets in the run up to the global financial crisis (as measured by a proxy of the
NSFR) was close to the target values proposed in Basel III recommendations.
4
However, we
find a wide dispersion in structural liquidity across banks. A mild (albeit sustained) increase
in structural liquidity mismatches in the run up to the crisis was driven by banks located at
the lower extreme of the distribution. Pre-crisis leverage was also widely uneven across
banks, with the Global banks displaying thinner capital buffers and wider gaps between
leverage ratios and Basel capital to risk-weighted assets.
In line with alleged deficiencies in bank risk management practices, we find that banks with
weaker structural liquidity and banks with higher leverage ratios in the run up to the crisis
were more vulnerable to failure, after controlling for their pre-crisis risk-taking. However,
the average effects of stronger structural liquidity and capital buffers on the likelihood of
bank failure are not large. On the other hand, there is evidence of substantial threshold
effects, and the benefits of stronger buffers appear substantial for the banks located at the
lower extremes of the distributions. In addition, we find systematic differences in the relative
importance of liquidity and leverage for financial fragility across groups of banks. Global
4
Structural liquidity was measured by the ratio of long-term stable funding sources to structural asset positions.
5
banks were more susceptible to failure on excessive leverage, while Domestic banks were
more susceptible to failure on weak structural liquidity (i.e., excessive liquidity
transformation) and overreliance on short-term wholesale funding.
In the estimations, we include bank-level controls for pre-crisis risk taking, and for country-
specific macroeconomic conditions (i.e., common to all banks incorporated in a given
country). The use of controls for pre-crisis risk-taking is critical to this study. To the extent
that banks perform active risk management, higher risk-taking would tend to be associated
with stronger liquidity and capital buffers, introducing a bias to the results. In fact, we find
that banks engaging in more aggressive risk taking in the run-up to the crisis—as measured
by the rate of growth of their credit portfolios and by their pre-crisis distance to default—
were more likely to fail afterward. Macroeconomic conditions in the pre-crisis period are also
found to affect bank probabilities of default, suggesting that banks may have failed to
internalize risks stemming from overheated economic activity and exuberant asset prices.
All in all, these results provide support to the proposed regulations on liquidity and capital, as
well as to the introduction of a macro-prudential approach to bank regulation. From the
financial stability perspective, however, the evidence indicates that regulations on capital—
particularly for the larger banking groups—are likely to be more relevant.
The reminder of the paper is as follows. Section II places the paper in the context of the
literature. Section III presents the dataset, discusses the criteria for the partition of the
sample, and describes some stylized facts on the evolution of liquidity and leverage across
groups of banks. Section IV describes the quantitative results of baseline regressions and a
parallel set of exercises with alternative partitions of the sample to assess the extent of cross-
sectional differences and non-linear effects. Section V presents various robustness checks.
Section VI concludes.
II. RELATED LITERATURE AND EMPIRICAL HYPOTHESES
The theory of financial intermediation shows that liquidity creation is an essential role of
banks and establishes a strong connection between liquidity creation and financial stability
(Bryant, 1980; Diamond and Dybvig, 1983). Banks create liquidity on both sides of their
balance sheets, by financing long-term projects with relatively liquid liabilities such as
transaction deposits and short-term funding.
5
The associated exposure to liquidity risk is an
intrinsic characteristic of banks that operates as a discipline device and supports efficiency in
financial intermediation (Diamond and Rajan, 2000). In this set up, bank capital (i.e., lower
leverage) entails a cost in terms of liquidity creation but provides a buffer against changes in
5
Banks can also create liquidity via off-balance sheet operations, for example, by issuing commitments and
guarantees (see for example Kayshap, Rajan, and Stein, 2002).
6
the value of bank assets, increasing bank survival probabilities under distressed market
conditions (Diamond and Rajan 2001).
The notion of bank liquidity creation in the literature is closely related with the regulatory
concept of structural liquidity mismatches in bank balance sheets. The latter reflects the
portion of long-term, illiquid assets (i.e., structural positions) that are financed with short-
term funding and non-core deposits. Thus, a bank with larger structural liquidity mismatches
would create more liquidity. Bank liquidity creation is also related with the leverage ratio,
which measures equity capital relative to total assets. To the extent that (the book value of)
equity entails a stable funding component, a bank with a higher leverage ratio would also
create more liquidity.
The role of bank liquidity in the global financial crisis has been subject to substantial
attention. In particular, the reliance of banks on short-term wholesale funding to finance the
expansion of their balance sheets in the run-up to the crisis, together with excessive leverage,
have been highlighted as key factors in the buildup of systemic risks and the propagation
mechanism.
6
Empirical studies show that banking crises in the U.S. have been preceded by
periods of abnormal liquidity creation (Berger and Bouwman, 2008, 2009). There is also
evidence that banks’ reliance on wholesale funding had a negative effect on the performance
of their stock prices after the outbreak of the crisis (Raddatz, 2010) and resulted in increased
financial fragility, as measured by distance to default and the volatility of bank stock returns
(Demirgüç-Kunt and Huizinga, 2009), or by the likelihood of receiving public assistance
(Ratnovski and Huang, 2009). In addition, U.S. banks with more stable funding structures
continued to lend relative to other banks during the global financial crisis (Cornett et al.,
2010), and were less likely to fail (Bologna, 2011).
A related strand of literature has focused on the role of capital in the capacity of banks to
withstand financial crises. The evidence indicates that banks with larger capital cushions
fared better during the global financial crisis in terms of stock returns (Demirgüç-Kunt,
Detragiache, and Merrouche, 2010). Related work by Berger and Bouwman (2010) analyzed
the survival probabilities of banks in the U.S. during two banking crises and three market-
related crises (i.e., those originated by events in the capital markets), and concluded that
small banks with higher capital were more likely to survive both types of crises. In contrast,
higher capital cushions improved the survival probabilities of medium-size and large banks
only during banking crises. Previous studies based on bank-level data also showed that
6
From the theoretical point of view, however, there are competing views on the effects of bank reliance on
wholesale funding on their vulnerability to liquidity risk as well as on market discipline. On the one hand,
sophisticated institutional investors may exercise stronger monitoring, enhancing market discipline and offering
an alternative to offset unexpected deposit withdrawals (Calomiris, 1999). On the other, in an environment of
costless but noisy public signals, short-term wholesale financiers may face lower incentives to monitor,
choosing to withdraw in response to negative public signals and triggering inefficient liquidations (Huang and
Ratnovski, 2010).
7
capital ratios had a strong informative content in explaining subsequent bank failure and
pointed to the presence of non-linear effects (Estrella, Park, and Peristaki, 2000;
Gomez-Gonzalez and Kiefer, 2007).
The combined role of structural liquidity and capital cushions on bank fragility was
addressed in the context of Basel III proposals (BCBS, 2010). This work concluded that
stronger capital buffers were associated with lower probability of banking crises and also
with less severe costs. Evidence on the role of liquidity buffers was somewhat less
conclusive possibly due to data limitations, since the analysis was based on aggregate data.
In this paper, we use a bank-level dataset to study the connection between structural liquidity
and leverage in bank balance sheets in the run-up to the global financial crisis, and the
likelihood of subsequent failure. We also explore for potential differences in the relative
importance of liquidity and capital buffers on the likelihood of failure across bank types,
distinguishing between large globally-active banks, and domestic retail-oriented institutions.
In particular, we try to answer the following questions: (i) are there any connections between
structural liquidity and leverage in bank balance sheets during the pre-crisis period and the
probability of subsequent failure?, and (ii) is there evidence of systematic differences across
bank types? In answering these questions, we also explore the relationship between bank
risk-taking and macroeconomic and financial factors in the run up to the crisis and the
likelihood of subsequent bank failure.
To guide the analysis, we build upon the theories mentioned above, which imply a direct
connection between structural liquidity mismatches in bank balance sheets, leverage, and
financial fragility. We note, however, that active implementation of risk management and
controls by banks may tend to weaken, or even completely dissipate, this connection. In fact,
under the hypothesis that bank decisions regarding their risk-taking and the size of the
associated liquidity and capital buffers were optimal, we should find a positive relationship
between pre-crisis risk-taking and the size of liquidity and capital buffers, but a weak
connection whatsoever between the latter and the probability of failure. Following the same
reasoning, proper risk-taking and management by banks would tend to weaken the
connections between the macroeconomic environment in the run-up to the crisis and the
likelihood of subsequent bank failure. These hypotheses are taken to the data in the next
sections.
III. D
ATA AND TARGET VARIABLES
We obtain bank-level financial statements from the Bankscope database. Using this source
has two major advantages. First, the coverage is fairly comprehensive, with sampled banks
accounting for about 90 percent of total assets in each country, according to the source.
Second, the information at the bank level is presented in standardized formats, after adjusting
for differences in accounting and reporting standards across countries. On the other hand, the
use of publicly available data has some limitations, in particular the lack of sufficient
8
granularity in some of the balance sheet accounts. For example, detailed breakdown of loan
portfolios by categories, maturity, or currency, is not generally available. Similarly, securities
portfolios are not segregated by asset classes, or by maturity. On the other hand, relatively
richer information is available on the liabilities’ side, as deposits are classified by type, and
non-deposit funding is classified in short-term (i.e., residual maturity shorter than one year)
versus long-term (i.e., residual maturity longer than one year).
The sample covers about 11,000 banks incorporated in the U.S. and Europe, which were the
regions more severely affected by the global financial crisis. Series are yearly, spanning
2001–09. Therefore, we are able to capture the evolution of bank financial conditions in the
run up to the crisis (2001–07) as well as throughout the crisis (2008–09). For the purpose of
the analysis, we split the sample according to two alternative criteria. First, we distinguish
between large internationally active banks versus domestically-oriented banks, and further
split the latter in commercial banks, savings banks, and cooperatives. In parallel, we split the
sample by target levels of structural liquidity and leverage to explore for potential threshold
effects.
Balance sheets and income statements are taken in U.S. dollar terms, using the market rate at
the closing dates of the bank-specific accounting exercises. While in many cases BankScope
reports both consolidated and unconsolidated financial statements, we use consolidated
figures to the extent possible, to reflect the overall liquidity and leverage positions of
individual banking groups. Outliers are identified and removed by filtering-out observations
with either liquidity or leverage below the 0.5 percentile and above the 99.5 percentile.
A. Indicators of Bank Liquidity and Leverage
To measure structural liquidity and leverage, we use two novel international regulatory
standards: the Net Stable Funding Ratio, NSFR, and the leverage ratio, measured by dividing
equity capital to assets,
EQUITY, (BCBS, 2009, 2010). The NSFR reflects the proportion of
long-term illiquid assets that are funded with liabilities that are either long-term or deemed to
be stable (such as core deposits). In turn, EQUITY reflects the proportion of shareholders’
equity to assets and thus provides a measure of bank leverage. All else equal, a higher
NSFR
and a higher
EQUITY imply lower bank liquidity creation.
Specifically, the
NSFR is a ratio between the weighted sum of various types of bank liabilities
(L
i
) and assets (A
j
):
ii
i
j
j
j
wL
NSFR
wA
[1]
The weights w are bounded between zero and one, but do not add up to one. They reflect the
relative stability of balance sheet components. In the case of assets, larger weights are
assigned to less liquid positions. In the case of liabilities, larger weights are assigned to more
9
stable sources of funding. A higher NSFR is therefore associated with lower liquidity risk. The
proposed regulations require banks to maintain a NSFR higher than one.
As noted above, the granularity of bank assets and liabilities required to replicate the NSFR is
not publicly available. However, we can still approximate the ratio reasonably well using
Bankscope data. A stylized bank balance sheet, together with the weights used in the
calculation of the
NSFR, is presented in Table 1. Some departures from the NSFR proposed in
Basel III are worth noting. First, we cannot split the loan portfolios according to their type or
residual maturity, which under Basel III entail different weights (ranging from 0.50 to 1.00).
Following a conservative approach, we assume that the total loan portfolio requires stable
funding and use an overall weight of 1.00. For other earning assets, which tend to be more
liquid, we use an average weight of 0.35, which is within the range proposed in Basel III.
Fixed assets and non-earning assets (except for cash and due from banks) receive a weight of
1.00, also following conservative criteria. On the liabilities side, we split customer deposits
by type and other liabilities according to their maturity. The weights assigned reflect the
assumption that core retail deposits are more stable than other short-term funding sources.
Accordingly, the latter are given a weight of zero. Long-term liabilities and equity are
considered to be stable at the one-year horizon.
As for leverage, we use the ratio between shareholder’s equity to assets, which is broadly
used and in line with Basel III proposals.
Robustness checks are performed using alternative indicators of bank liquidity and leverage.
For liquidity, we use the Short-Term Funding Ratio (STFR), measured by dividing the
liabilities maturing within one-year over total liabilities. For capitalization we use the Basel
CAR definition, measured by the ratio of regulatory capital to risk-weighted assets.
B. Global Banks Versus Domestic Banks
As noted before, we classify banks in two categories, namely Global banks and Domestic
banks, using information on their size, geographic presence, and ownership. The group of
Global banks encompasses internationally-active institutions with consolidated assets
surpassing US$10 billion at end-2009. To select only the parent banking groups, we identify
banks owing majority stakes in foreign subsidiaries, with no financial institutions listed as
their ultimate owners. In turn, the group of Domestic banks encompasses domestically-
owned institutions with no majority stakes in subsidiaries abroad. The coverage of the sample
is uneven (Table 2). For Domestic banks, it tracks 10,805 institutions during 2001−09, with
more than eight years of time coverage for about 57 percent of the banks in the sub-sample.
As for Global banks, the sample covers 91 institutions, with more than six years of
information for 60 percent of the banks in the sub-sample. Looking closely into the data,
there is apparent break in the subsample of European banks in 2005, which is mainly
attributable to changes in the accounting information after the adoption of IFRS. We check
for potential noise associated with this break by computing the pre-crisis variables according
10
to three alternative criteria: (i) computing their means over the entire available data for each
bank; (ii) computing their means over 2004−07; and (iii) using their values as of end-2007.
Not surprisingly, since the target variables are stocks, the results obtained under these three
criteria are broadly consistent.
C. Bank Failure
We identify the group of banks that failed during the crisis by using several complementary
sources. First, we exploit the information on the ongoing status of each bank contained in
BankScope, and single out the banks that changed status from “active” to either: “under
receivership”, “bankruptcy”, “dissolved”, “dissolved by merger”, or “in liquidation”. Second,
we track the evolution of the Basel capital (CAR) for each bank and single out the banks with
CAR dropping below the 8 percent threshold between 2008−09. Third, we exploit information
on Moody’s bank financial strength ratings and single out banks downgraded to ratings E+ or
E (in distress). These criteria are useful to identify the banks that were allowed to fail and
subject to resolution procedures, which were typically the smaller non-systemically
important institutions. On the other hand, the failing Global banks were generally assisted by
their governments and therefore not properly captured by these criteria. To deal with this
issue, we use the information on failing banks from Laeven and Valencia (2010).
7
IV. EMPIRICAL APPROACH AND QUANTITATIVE RESULTS
To gauge the relationship between bank structural liquidity, leverage, and their subsequent
probability of failure, we compute a probit model exploiting the cross-sectional distribution
of bank-level state variables prior to the crisis. In particular, we formulate the empirical
model:
Pr( 1| ) ( )
ii i
F
xx
[1]
Where F
i
is a dummy variable that takes the value of one if bank i failed during the crisis
(i.e., between 2008−09) and zero otherwise. The vector
X
i
contains the two target variables,
namely, the
NSFR and the EQUITY ratio, both measured prior to the crisis. The vector also
contains a set of bank-level controls, aimed at capturing differences in bank risk profiles in
the run-up to the crisis. These include: (i) the yearly average of credit growth,
CREDIT
GROWTH
, (ii) the ratio of non-interest income to total income, NON-INTEREST INCOME, and
(iii) the distance to default or
Z-SCORE, which conveys the number of standard deviations that
bank return on assets has to drop to trigger insolvency. The inclusion of non-interest income
follows from the conjecture that bank risk profiles increased with their reliance on trading or
7
The authors provide a summary of the most relevant banks that failed, or were assisted by their home
governments during the global financial crisis, starting from end-2007. This captures banks that received direct
assistance from the government (equity injections, bond purchases) as opposed to indirect assistance (general
asset purchase programs, reductions in discount rates, and other support measures).
11
investment banking activities in the run up to the crisis (Demirguҫ-Kunt and Huizinga,
2009). The vector also contains two country-specific variables (i.e., common to the banks
incorporated in a given country) which are aimed at capturing macroeconomic and monetary
conditions in the run-up to the crisis. These are the yearly average rate of GDP growth, GDP
GROWTH
, and the MONEY MARKET RATES. The use of pre-crisis averages for the explanatory
variables ameliorates potential endogeneity problems, which comes at the cost of neglecting
dynamics along the time dimension. Thus, the specification is purely cross-sectional and does
not include bank-level fixed effects.
As noted before, under the premise that banks manage their liquidity and capitalization in a
sound way, one should expect to find a positive correlation between their ex-ante risk taking
and their capital and liquidity ratios, and a weak connection whatsoever between these and
their probabilities of failure. Evidence on the contrary would indicate that banks failed to
properly account for their risk taking in the run-up to the crisis, providing some ground for a
more intrusive prudential framework regarding capital and liquidity buffers. Following a
similar argument, macroeconomic conditions should not play a systematic role in the
probabilities of failure of well-managed banks. Evidence on the contrary would imply a link
between macroeconomic conditions and systemic financial stability (since the former are
common to all banks incorporated in a given country), providing ground for a
complementary macro-prudential approach to banking regulation.
A. Stylized Facts
Summary statistics of the variables are presented in Table 3, splitting the sample across
Global and Domestic banks. The magnitude of the difference in size between these two
groups of banks is striking. The average balance sheet of the Domestic banks was
US$0.7 billion at end-2009, compared with US$527.1 billion for Global banks, and the
institution in the 99 percentile of the distribution had a balance sheet of US$2.9 trillion at
end-2009. The massive size of these banks makes them extremely challenging to resolve, and
their interconnectedness and financial complexity compounds with the breath of their
operations, which span across borders.
Some additional differences between Global and Domestic banks are worth noting. In the
pre-crisis period, Global banks displayed thinner capital cushions than Domestic banks, and
weaker indicators of structural liquidity. The structure of Global bank liabilities was also
more heavily reliant on non-deposit funding, and tilted to the short-term. The statistics also
uncover a wide difference between EQUITY and the Basel CAR, which is mainly attributable to
the effect of risk-weighs in the Basel formula. Furthermore, the gap between these two
measures is larger for Global banks suggesting a negative relationship between bank size and
average risk-weights. For example, Global banks in the first percentile have an EQUITY ratio
of only 1.4 percent compared to a Basel
CAR of 9.2 percent, which is 6.6 times higher. In
turn, Domestic banks have an EQUITY ratio of 2.5 and a Basel CAR of 10.1 percent, which is
12
4.0 times higher. Other risk indicators, such as the Z-score and credit growth are broadly
similar across bank types.
To explore the relationship between the target variables in the pre-crisis period, pair-wise
correlations are presented in Table 4. As before, we split the sample between Global banks
(lower triangle) and Domestic banks (upper triangle) to gauge the extent of potential cross-
sectional differences. Not surprisingly, various measures of liquidity tend to be closely
related for both types of banks. For example, stronger structural liquidity is associated with
lower reliance on short-term funding (and with money market funding) and positively
correlated with deposit funding. Also, the two measures of bank capital seem to convey
similar information, despite gaps stemming from risk weights. It is worth noting that the
correlation between bank capital and credit growth is positive and statistically significant in
both subsamples. This is consistent with the idea that bank governance and risk management
mechanisms were at play (i.e., a more aggressive credit expansion was associated with
stronger capital cushions). On the other hand, some differences between the two bank types
are apparent. In the case of Global banks, higher structural liquidity seems to be associated
with more moderate credit growth and a larger distance to default. In the case of Domestic
banks, the relationship between these variables is not significant. All in all, these correlations
suggest that the expansion of bank balance sheets in the pre-crisis period was associated with
riskier liquidity profiles, particularly for Global banks, but do not suggest an immediate
connection with potential shortages in capital buffers. The next section explores the link
between bank probability of failure with their pre-crisis levels of liquidity and capital in a
more rigorous way.
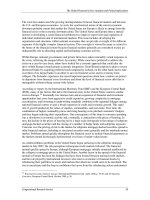
To gauge the time evolution of structural liquidity and leverage across bank types, Figure 1
plots the respective medians together with the 10
th
and 90
th
percentiles. Interestingly, the
average NSFR before the crisis is relatively stable and close to one. However, there is a wide
dispersion across banks, with those located at the lower extreme of the distribution displaying
extremely weak structural liquidity. A similar picture emerges for
EQUITY capital. While the
average bank displayed relatively comfortable equity to asset ratios, those located at the low
end of the distribution were extremely leveraged.
A complementary diagram of the evolution of structural liquidity during the sampled period
is presented in Figure 2, splitting the sample by bank types and across Failed and Non-Failed
banks. The plots reveal interesting cross-sectional patterns. As expected, the failed banks had
lower structural liquidity and higher leverage than the non-failed banks. Furthermore, the
NSFR follows a declining trend in the pre-crisis period, which reverts from 2007 for the
Domestic banks, and from 2008 for the Global banks. In the latter group, there is a sudden
drop at the peak of the crisis, followed by an equally sharp increase that reflects the hoarding
of liquidity for precautionary purposes. Regarding EQUITY, Domestic banks display more
comfortable cushions than Global banks and an upward trend in the pre-crisis period. After
the eruption of the crisis, equity collapses in the group of failed Domestic banks, but
13
increases in the group of failed Global banks, reflecting capital injections and public support
due to their systemic importance.
Before turning to the regression analysis, we compare the distributions of pre-crisis structural
liquidity and leverage across Failed and Non-Failed banks, further distinguishing between
bank types (Figure 3). To facilitate the reading, we exclude banks with NSFR above 1.5 and
banks with
EQUITY above 20 percent. All the distributions have positive skewness and excess
kurtosis, with normality tests rejecting the null in all cases. Comparing across subsamples,
the most striking result is the evidence of substantially lower
EQUITY in the case of Failed
Global banks, with the mean close to 4 percent. The distributions of NSFR for Failed banks
are also displaced to the left, but the differences tend to be lower. In fact, tests of differences
of means (not shown) suggest that insufficient EQUITY was associated with failure in the case
of Global banks while insufficient structural liquidity was a problem associated with the
Domestic banks. In the next section we develop a empirical model to formally test these
conjectures.
B. Baseline Regressions
The results of baseline probit regressions, properly transformed around the mean of the
explanatory variables to show the change in the probability of failure associated with a
change in the explanatory variables, support the notion that banks with higher NSFR and
EQUITY in the years before the crisis were less susceptible to fail during the turmoil (Table 5).
The coefficients associated to the two target variables are negative and statistically
significant at the one percent level in all cases and the results are robust to the inclusion of
the control variables. At the same time, the evidence indicates that banks with higher risk
taking in the pre-crisis period were more likely to fail afterward. In particular, credit growth
is positively associated with the probability of failure, while the Z-score (i.e., distance to
default) operates in the opposite direction. On the other hand, the ratio of non-interest income
to total income is not statistically significant. The latter result contrasts with Demirguc-Kunt
and Huizinga (2010), which is likely due to differences in the construction of the variable.
8
Interestingly, the macroeconomic variables (which are common to all banks incorporated in a
given country) are also highly significant and operate in the expected direction. Banks
incorporated in countries with higher pre-crisis economic growth and with easier monetary
conditions were more likely to fail during the crisis. This is consistent with the notion that
banks failed to fully internalize risks stemming from their external environment. This may
provide justification for the implementation of macro-prudential regulations as a complement
to the traditional micro-prudential approach. At the same time, it is also worth noting that the
8
This paper measures NON-INTEREST INCOME by taking the absolute value of non-interest income to total
income, to account for the fact that trading income may take negative values. Therefore, a bank with either large
non-interest gains or losses relative to total income is assumed to be riskier.
14
pseudo R-square of the regression tends to be low, with the model explaining less than five
percent of the variation in bank probability of failure.
To assess the economic significance of the results, we take the regression coefficients
presented in column [6] and compute the estimated change in the probability of failure
resulting from a 0.5 standard deviation change in the explanatory variables. The results
(Table 6) indicate that a 10.4 percentage point increase in the
NSFR, from 0.99 to 1.09, would
cause a drop 0.46 percentage point drop in the probability of failure of the average bank, all
else equal. Similarly, a 3.1 percentage point increase in
EQUITY, from 10.7 percent to
13.8 percent would cause a drop of 0.64 percentage point drop in bank probability of failure.
Thus, the quantitative importance of these effects appears to be small, which is consistent
with the results obtained in quantitative impact studies (BCBS, 2010). A caveat of this
interpretation is the potential presence of either non-linear or threshold effects operating
more severely for banks in the extremes of the distribution. This possibility is assessed in the
next section.
Turning back to the results, the probability of failure seems to be relatively more influenced
by bank risk profiles, particularly as reflected in the pre-crisis Z-score, and by bank’s
operating environments. Notably, banks incorporated in countries with a pre-crisis GDP
growth 0.5 percentage points higher than the average were 2.2 percentage points more likely
to fail, while tighter monetary conditions operated in the opposite direction. This is consistent
with the presence of unsustainable economic activity and/or potential asset bubbles in the
pre-crisis period.
C. Are There Threshold Effects at Play?
To gauge the extent of threshold effects, we split the sample according to pre-crisis values of
NSFR and EQUITY with the help of dummy variables.
9
In particular, we indentify banks with a
NSFR below one and banks with EQUITY below seven. These values are relevant references
from the regulatory perspective. We then re-estimate the regressions over each subsample
and their combinations. As before, the estimated coefficients are transformed to convey the
marginal impact of each explanatory variable on the probabilities of bank failure (Table 7).
Overall, the results are consistent with the idea that liquidity and capital play a
complementary role in financial stability and that threshold effects are at play. In the leftmost
three columns, which are computed over the subsamples of banks with weak structural
liquidity, the coefficients associated with
EQUITY are two and four times higher than those
obtained in the matching baseline regressions. Furthermore, the relationship between
structural liquidity and the probability of failure reverses sign and becomes statistically
9
We also computed a set of regressions including squared values of the NSFR and EQUITY to allow for non-
linear effects, but the results were not statistically significant.
15
insignificant for the subsample of banks with low liquidity and capital, indicating that capital
shortages were critical for the failing banks in this subsample.
Going back to results, the rightmost three columns display a partition of the sample by levels
of EQUITY. Not surprisingly, the strongest marginal benefits of capital cushions originate
from the subsample of banks operating below the seven percent threshold, as shown in
column [4]. The explanatory variables also account for a more significant proportion of the
probability of failure in the subsamples of banks with lower capital ratios, as indicated by the
pseudo R-squared at the bottom. As for the subsample of banks operating with intermediate
EQUITY levels, both structural liquidity and capital seem to contribute to their capacity to
withstand the crisis. The target coefficients are two and three times larger than those obtained
in the baseline regression. Conversely, the coefficients are not statistically significant for the
subsample of banks with EQUITY above twelve percent, as shown in column [6], which is also
consistent with the existence of threshold effects.
These results, together with those obtained in the previous section indicate that the stability
benefits of tighter regulations on liquidity and capital are moderate for the average bank, but
substantially more relevant for the institutions located at the lower extreme of the
distribution. Furthermore, the results suggest that, from the financial stability perspective,
regulations on capital are likely to play a more critical role than regulations on liquidity. This
poses a question on the extent of potential differences in the target parameters across Global
and Domestic banks, as the former were typically more leveraged than Domestic banks in the
run up to the crisis. The next section explores for this possibility.
D. Are There Differences Across Bank Types?
To assess the extent of differences across bank types, we compute separate regressions for
Global and Domestic banks, and further split the latter by categories, distinguishing between
commercial banks, savings banks, and cooperatives. The results (Table 8) provide strong
evidence that capital shortages played a more important role in the failure of Global banks,
while liquidity was the key factor in the subsample of Domestic banks. It is worth noting the
magnitude of the coefficient associated with EQUITY for the subsample of Global banks,
which is almost 25 times larger than that obtained in the baseline regression. Using this
value, a one percent increase in Global bank capital in the pre-crisis period would cause a
material 4.8 percent drop in their probability of failure. This highlights the importance of
ensuring adequate capital buffers in the systemically-important institutions. In turn, the
coefficient associated with credit growth is also substantially larger for the sub-sample of
Global banks, suggesting that those engaged on a more aggressive expansion in the pre-crisis
period were more likely to fail. Conversely, country-specific macroeconomic conditions do
not play a systematic role in the subsample of Global banks. This is likely due to
diversification effects stemming from their international operations. In fact, as their
operations span many countries, changes in macroeconomic conditions in their home
countries do not have a strong impact on the likelihood of failure of the entire group.
16
In the subgroup of Domestic banks, cross-sectional differences are less stark, as indicated by
the results presented in columns [3] to [5]. Capital shortages appear to be relatively more
important in the segment of savings banks, while commercial banks appear to be more
vulnerable to problems associated to weak structural liquidity. In the segment of credit
cooperatives, those more heavily engaged in non-traditional activities, proxied by the ratio of
non-interest to total income, were more likely to fail during the crisis.
V. ROBUSTNESS CHECK
To gauge the robustness of the results, we estimate a complete set of parallel regressions
using two alternative measures of bank liquidity and capital. As for liquidity, we use the
Short Term Funding Ratio, STFR, computed by dividing liabilities with less than one year
residual maturity to total liabilities. For capital, we use the Basel Tier 1 capital ratio, CAR,
defined as the ratio of Tier 1 regulatory capital to risk-weighted assets. As mentioned before,
this measure of capital is larger than the one used in the baseline regressions due to the
application of risk weights on bank assets.
In addition, we explore with three variations in the definition bank failure. In particular, we
decompose the bank failure dummy according to its components as follows: (i) banks that
ceased their active status during the crisis or that were reclassified to risk categories E and E+
by Moody’s; (ii) banks with regulatory CAR ratios dropping below 8 percent between
2008–09; and (iii) banks included in the failed list of compiled by Laeven and Valencia
(2009).
The full set of results, omitted for brevity, is broadly consistent with those discussed
previously. Summary regressions replicating the baseline specification with combinations of
the alternative measures of liquidity and capital are presented in Table 9. The coefficients
associated with the STFR are positive, indicating that bank reliance on short-term funding
before the crisis was associated with increased financial fragility. The set of regressions that
use variations in the definition of bank failure, presented in Table 10, are also broadly
consistent with the baseline results.
VI. C
ONCLUDING REMARKS
Overall, the findings of this paper provide broad support to Basel III initiatives on structural
liquidity and leverage, and show the complementary nature of these two areas. Banks with
weaker structural liquidity and higher leverage before the global financial crisis were more
vulnerable to subsequent failure. The results are driven by banks in the lower extremes of the
distributions, suggesting the presence of threshold effects. In fact, the marginal stability gains
associated with stronger liquidity and capital cushions do not appear to be large for the
average bank, but seem substantial for the weaker institutions.
At the same time, there is evidence of systematic differences across bank types. The smaller
banks were more susceptible to failure on liquidity problems, while the large cross-border
17
banking groups typically failed on insufficient capital buffers. This difference is crucial from
the financial stability perspective, and implies that regulatory and supervisory emphasis
should be placed on ensuring that the capital buffers of the systemically important banks are
commensurate with their risk-taking.
The evidence also indicates that bank risk-taking in the run-up to the crisis was associated
with increased financial vulnerability, suggesting that bank decisions regarding the
associated liquidity and capital buffers were not commensurate with the underlying risks,
resulting in excessive hazard to their business continuity. Country-specific macroeconomic
conditions also played a role in the likelihood of subsequent bank failure, implying that
banks failed to properly internalize the associated risks in their individual decision-making
processes. Thus, while more intrusive regulations entail efficiency costs, the results point to
associated gains in terms of financial stability that have to be pondered. This also supports
the introduction of a macro-prudential framework as a complement to traditional, micro-
prudential approach. In this regard, further work is needed to deepen the understanding of the
role of the macroeconomic environment on financial stability.
18
VII. REFERENCES
BCBS, 2009. “International Framework for Liquidity Risk Measurement, Standards, and
Monitoring, Consultative Document,” Bank of International Settlements.
BCBS 2010a. “Basel III: International Framework for Liquidity Risk Measurement,
Standards, and Monitoring,” Bank of International Settlements.
BCBS, 2010b. “An Assessment of the Long-Term Economic Impact of Stronger Capital and
Liquidity Requirements,” Bank of International Settlements.
Berger and Bouwman, 2008. “Financial Crises and Bank Liquidity Creation,” Working Paper
08−37, Wharton Financial Institutions Center.
Berger and Bouwman, 2009. “Bank Liquidity Creation,” The Review of Financial Studies 22:
3779–3837.
Berger and Bouwman, 2010. “ How Does Capital Affect Bank Performance During Financial
Crises?,” Working Paper 11−22, Wharton Financial Institutions Center.
Bologna, Pierluigi, 2011, “Is There a Role for Funding in Explaining Recent U.S. Banks’
Failures?” IMF Working Paper WP/11/180.
Brunnermeier, Markus, 2009. “Deciphering the Liquidity and Credit Crunch 2007-2008,”
Journal of Economic Perspectives 23: 77–100.
Bryant, 1980. “A Model of Reserves, Bank Runs, and Deposit Insurance,” Journal of
Banking and Finance, 4: 335−44.
Calomiris, Charles, 1999. “Building and Incentive-Compatible Safety Net,” Journal of
Banking and Finance, 23(10): 1499−1519.
Cornett, Marcia M., Jamie J. McNutt, Philip E. Strahan, and Hassan Tehranian, 2010.
“Liquidity Risk management and Credit Supply in the Financial Crisis,” Working
Paper.
Demirguҫ-Kunt and Huizinga, 2009. “Bank Activity and Funding Strategies: The Impact on
Risk and Returns,” World Bank Working Paper 4837. The World Bank.
Demirgüç-Kunt, Asli, Enrica Detragiache, and Ouarda Merrouche, 2010. “Bank Capital:
Lessons from the Financial Crisis,” World Bank Working Paper 5473. The World
Bank.
Diamond and Dybvig, 1983. “Bank Runs, Deposit Insurance, and Liquidity,” Journal of
Political Economy, 91: 401−19.
19
Diamond and Rajan, 2000. “A Theory of bank capital,” Journal of Finance 55: 2431−2465.
Diamond and Rajan 2001. “Liquidity Risk, Liquidity Creation, and Financial Fragility: A
Theory of Banking,” Journal of Political Economy 109: 287−327.
Estrella, Park, and Peristaki, 2000. “Capital Ratiops as Preduictors of Bank Failure,”
Economic Policy Review, Federal Reserve Bank of New York, (July): 33−52.
ECB, 2009. “EU Banks’ Funding Structures and Policies,” Working Paper (May). European
Central Bank.
Garcia-Herrero and Vazquez, 2007. “International Diversification Gains and Home Bias in
Banking,” IMF Working Paper WP/07/281.
Gomez-Gonzalez and Kiefer, 2007. “ Bank failure: Evidence from the Colombian Financial
Crisis,” Working Paper, Department of Economics Cornell University.
Griffith-Jones, Stephany, Miguel Segoviano, and Stephen Spratt, 2002, “Basel II and
Developing Countries: Diversification and Portfolio Effects,” Working Paper, The
London School of Economics.
Hanson, Kashyap and Stein, 2010. “A Macroprudential Approach to Financial Regulation,”
Chicago Booth Research Paper 10-29.
Huang, Rocco, and Lev Ratnovski, 2010. “The Dark Side of Bank Wholesale Funding,” IMF
Working Paper WP/10/170.
Kayshap, Rajan, and Stein, 2002. “Banks as Liquidity Providers: An Explanation for the
Coexistence of Lending and Deposit-Taking,” Journal of Finance, 57:33−73.
Laeven, Luc and Fabian Valencia, 2010. “Resolution of Banking Crises: The Good, the Bad,
and the Uggly,” IMF Working paper No. 10/146.
Raddatz, 2010. “When the Rivers Run Dry” Liquidity and the Use of Wholesale Funds in the
Transmission of the U.S. Subprime crisis,” Working Paper 5203, The World Bank.
Ratnovski, Lev and Rocco Huang, 2009, “Why Are Canadian Banks More Resilient?” IMF
Working Paper WP/09/152.
20
Figure 1. Evolution of Structural Liquidity and Leverage across Bank Types, 2001−09
This figure presents the evolution of the structural liquidity and leverage for the subsamples of Domestic
and for Global banks during 2001−09. The solid lines correspond to the median and the dotted lines to the
10
th
and 90
th
percentiles of the distributions.
.8
.9
1
1.1
1.2
1.3
2000 2002 2004 2006 2008 2010
NSFR; Domestic Banks
.4
.6
.8
1
1.2
2000 2002 2004 2006 2008 2010
NSFR; Global Banks
.05
.1
.15
.2
2000 2002 2004 2006 2008 2010
Equity; Domestic Banks
0
.05
.1
.15
2000 2002 2004 2006 2008 2010
10th and 90th Percentiles Median
Equity ; Global Banks
21
Figure 2. Evolution of Structural Liquidity and Leverage across Failed and Non-Failed
Banks, 2001−09
This figure presents the evolution of the median structural liquidity and leverage for the subsamples of
Domestic and Global banks, further splitting each group in failed versus Non-Failed institutions.
.85
.9
.95
1
2000 2002 2004 2006 2008 2010
NSFR; Domestic Banks
.04
.06
.08
.1
2000 2002 2004 2006 2008 2010
Equity; Domestic Banks
.75
.8
.85
.9
.95
2000 2002 2004 2006 2008 2010
NSFR; Global Banks
.04
.05
.06
.07
.08
2000 2002 2004 2006 2008 2010
Non Failed Failed
Equity; Global Banks
22
Figure 3. Distributions of Pre-Crisis Liquidity and Leverage across Failed and Non-Failed
Banks
This figure plots the pre-crisis density functions of structural liquidity and leverage for the subsamples of
Domestic and Global banks, further splitting each group in Failed and Non-Failed institutions.
0
1
2
3
4
0 .5 1 1.5
NSFR; Domestic Banks
0
5
10
15
20
0 .05 .1 .15 .2
Equity; Domestic Banks
0
1
2
3
0 .5 1 1.5
NSFR; Global Banks
0
5
10
15
0 .05 .1 .15 .2
Non Failed Failed
Equity; Global Banks
23
Table 1. Stylized Balance Sheet and Weights to Compute the NSFR
This table presents a stylized bank balance sheet, together with the weights assigned to different assets and
liabilities for the computation of the net stable funding ratio.
Wi Wi
1
Total Earning Assets
1
Deposits & Short term funding
1.A
Loans 100%
1.A
Customer Deposits
1.A.1 Total Customer Loans 1.A.1 Customer Deposits - Current 85%
Mortgages
1.A.2
Customer Deposits - Savings 70%
Other Mortgage Loans
1.A.3
Customer Deposits - Term 70%
Other Consumer/ Retail Loans
1.B
Deposits from Banks 0%
Corporate & Commercial Loans 1.C Other Deposits and Short-term Borrowings 0%
Other Loans
1.A.2
Reserves for Impaired Loans/NPLs
2
Other interest bearing lia bilities
1.B
Other Earning Assets 35%
2.A
Derivatives 0%
1.B.1
Loans and Advances to Banks
2.B
Trading Liabilities 0%
1.B.2
Derivatives
2.C
Long term funding 100%
1.B.3
Other Securities
2.C.1
Total Long Term Funding 100%
Trading securities Senior Debt
Investment securities Subordinated Borrowing
1.B.4
Rem a ining ea rning a ssets Other Funding
2
Fixed Assets 100%
2.C.2
Pref. Shares and Hybrid Capital 100%
3 Non-Earning Assets 3 Other (Non-Interest bearing) 100%
3.A
Cash and due from banks 0%
4
Loan Loss Reserves 100%
3.B
Godwill 100%
5
Other Reserves 100%
3.C
Other Intangibles 100%
3.D Other Assets 100% 6 Equity 100%
LIABILITIES + EQUITYASSETS
24
Table 2. Sample Coverage by Bank Types
This table presents the sample coverage, classifying banks by their countries of incorporation and type.
Non-Failed Failed Total Non-Failed Failed Total
Austria 142 0 142 4 3 7
Belarus 202 000
Belgium 808 022
Bosnia-Herzegovina 303 000
Bulgaria 1 0 1 0 0 0
Croatia 505 000
Cyprus 3 0 3 2 0 2
Denmark 56056 213
Finland 000 101
France 40 36 76 1 4 5
Germany 1274 6 1280 5 4 9
Greece 202 044
Hungary 303 101
Iceland 808 000
Ireland 101 101
Italy 27027 235
Latvia 022 000
Lithuania 101 000
Luxembourg 303 000
Macedonia (FYR) 202 000
Malta 101 000
Moldova Rep. O
f
314 000
Montenegro 2 0 2 0 0 0
Netherlands 202 336
Norway 43144 000
Poland 303 000
Portugal 000 202
Romania 202 000
Russian Federation 60 17 77 1 1 2
Serbia 606 000
Slovenia 303 000
Spain 28129 202
Sweden 60 13 73 3 0 3
Switzerland 241 6 247 2 1 3
Turkey 303 101
Ukraine 7613 000
United Kingdom 606 358
U.S. 7950 715 8665 19 5 24
Total 10,001 804 10,805 55 36 91
Domestic Banks Global Banks