Assessing Bank Competition within the East African Community pdf
Bạn đang xem bản rút gọn của tài liệu. Xem và tải ngay bản đầy đủ của tài liệu tại đây (1.07 MB, 25 trang )
Assessing Bank Competition within the East
African Community
Sarah Sanya and Matthew Gaertner
WP/12/32
© 2012 International Monetary Fund WP/12/32
IMF Working Paper
African Department
Competition in the EAC banking system
Prepared by Sarah Sanya and Mathew Gaertner
1
Authorized for distribution by Peter Allum
January, 2012
Abstract
This paper is an empirical analysis of competitiveness in the banking system of four out of the
five East African Community (EAC) countries
2
. The results show that the degree of
competition is low due to a combination of structural and socio-economic factors. By way of
p
review, the analysis ranks the countries in terms of banking sector competitiveness in the
following order: Kenya, Tanzania, Uganda and Rwanda.
JEL Classification Numbers:D4, G15, G21, L11, N20
Keywords: East African Community, Competition, Banking, Financial sector, H-statistic,
Lerner Index
Author’s E-Mail Address: ;
This Working Paper should not be reported as representing the views of the IMF.
The views expressed in this Working Paper are those of the author(s) and do not necessarily
represent those of the IMF or IMF policy. Working Papers describe research in progress by the
author(s) and are published to elicit comments and to further debate.
1
The authors are grateful for the valuable comments and suggestions provided by Peter Allum, Martine
Guerguil, Masafumi Yabara, and the participants of the February 2011 Financial Sector Network Seminar in the
African department of the IMF.
2
Burundi is not included in depth in the paper given the lack of available data in some areas.
2
Contents Page
Abstract 1
I. Introduction 3
II. Measuring the Degree of Competition in the EAC 4
A. Structural Measures of Competition 4
B. Empirical Measures of Competition 8
Data 9
The Lerner Index 10
The Panzar and Rosse H-statistic as an Alternative Measure of Competition in
the EAC 12
III. Determinants of Competition in the EAC Banking System 13
Empirical Analysis 14
IV. Conclusion and Policy Recommendations 19
Tables
1. Bank Regulation of EAC Countries 7
2. Cross-Country Determinants of the Lerner Index 15
3. Comparing the Lerner Index in Large vs. Other Banks 17
4. Comparing the Lerner Index in Foreign vs. Other Banks 18
Figures
1. EAC: Financial Intermediation 5
2. EAC: Indicators of Market Structure and Performance 8
3. Kenya and South Africa: Indicators of Liquidity in the Banking System, 2001–2010 10
4. Measures of Competition in Banking Systems around the world 16
Appendix
Structure of the Banking System 23
References 22
3
EAC: Acess to Financial Services
Formal Informal Excluded Entirely
Kenya 40% 27% 33%
Rwanda 21% 26% 52%
Tanzania 17% 27% 56%
Uganda 28% 42% 30%
South Africa 64% 10% 26%
Source: FINSCOPE, 2010
I. INTRODUCTION
Banking sector reforms introduced at the beginning of the last decade have contributed to a
sharp acceleration in credit to the private sector across the EAC in recent years. Countries
across the region have successfully implemented measures to liberalize state-controlled
banking systems, restructure loss-making institutions, write off nonperforming loans, and
improve governance and financial sector supervision (see Appendix). In turn, banks that had
previously largely held government securities and foreign assets have steadily shifted their
asset allocation toward domestic lending. While this expansion in private sector credit has
taken place from a very low initial volume, the rate of growth during this period has been
impressive. The annual growth in credit to the private sector during 2002–2010 averaged
28 percent in Uganda, 32 percent in Tanzania, and 15 percent in Kenya. As a result, credit to
the private sector as a share of GDP has increased over this period from 8 to 16 percent in
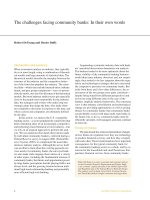
Uganda, 6 to 16 percent in Tanzania, and 25 to 33 percent in Kenya (see Figure 1). There has
also been acceleration in credit growth in both Rwanda and Burundi as stability has been
restored, with credit to the private sector rising by an annual average of 20 percent
since 2005.
Nevertheless, the level of financial intermediation in the region is low and access to financial
services remains limited. As shown in figure 1, the mobilization of deposits by the banking
system and the level of outstanding
credit—especially outside the more developed
Kenyan market—are both well below the levels
in some middle-income emerging market
economies. Furthermore, less than a third of the
population in Rwanda, Tanzania, and Uganda
have access to the formal financial system,
compared with nearly two-thirds of the population in South Africa, while more than half of
the population in Rwanda and Tanzania has no access to financial services at all. Even in
Kenya and Uganda, which compare more favorably to South Africa in terms of the level of
financial inclusion, a large share of this reflects the segment of the population that utilize
informal financial services.
The limited access to finance remains a key constraint on growth across the region, limiting
the scope for smaller, less well-established firms to finance investment through the formal
banking system. How to improve access and increase the level of financial intermediation
remains a key policy challenge. One possible explanation for the high level of financial
exclusion lies in the lack of competition within the banking system; economic literature
typically associates higher levels of bank competition with increased access to a wider range
of financial services, at lower cost, with greater efficiency in production and delivery of these
services. The number of new entrants into the market in recent years show there are no
regulatory barriers per se to competition in the banking system of the EAC countries.
However, in most of the countries across the region, the former state-owned banks retain a
4
very large market share despite steps to reduce regulatory barriers to entry and exit and
attract increased participation from foreign banks. The question remains: why are these new
participants unable to take advantage of the opportunity presented by the large unbanked
segment of the population in each country to compete more effectively with the former state-
owned banks that retain a dominant position in each country?
In order to address this question, this paper seeks to take a closer look at the nature and
determinants of competition within the EAC banking sector. Our main objective is to
empirically estimate the degree of competition in the EAC banking systems. We do this by
estimating two nonstructural measures of bank pricing behavior, the Lerner index and the
Panzar and Rosse H-statistic. The estimates from these behavioral models enable us to go
beyond commonly used indicators of performance and structure, allowing a direct
comparison of competitive conditions across countries and an identification of factors that
determine competition. The results show that the structure of the EAC banking systems can
be most accurately characterized as a monopolistic competition, with the degree of
competition strongly linked to the level of economic development, the contestability of
markets and the quality of institutions.
The rest of the paper is organized as follows: Section II analyses the degree of competition in
the banking systems. Section III details the empirical analysis of the determinants of
competition in the banking sector. Section IV concludes with policy recommendations to
further strengthen competition in the EAC banking systems.
II. MEASURING THE DEGREE OF COMPETITION IN THE EAC
Measures of competition in the banking sector broadly fall under three categories: first,
market structure and performance indicators; second, regulatory indicators of formal barriers
to entry into the banking system, as well as the extent of restrictions on bank activities; and
third, empirical measures of competition that gauge the response of output to changes in
input prices. In this paper, we will refer to the first two categories as structural measures of
competition and the third as empirical (nonstructural) measures.
A. Structural Measures of Competition
Concentration ratios are perhaps the most frequently used indicator of banking sector
competitiveness, with a high share of assets controlled by a small number of banks typically
interpreted as indicative of a low level of competition. Bank spreads (the difference between
lending and deposit rates) are also often used as indicators of banking efficiency and
competition, with higher spreads and margins interpreted as an indication of greater
inefficiencies and lack of competition in the banking sector. Measures of bank profitability
have also been used (although to a lesser extent) to assess the degree of market power held
by individual banks, with highly profitable banks reflecting a lack of competition in the
banking system.
5
Figure 1. EAC: Financial Intermediation
Sources: IFS; and Fund staff estimates.
0
5
10
15
20
25
30
35
40
45
50
2001 2002 2003 2004 2005 2006 2007 2008 2009 2010
Credit to private sector
(percent of GDP)
Burundi Uganda
Tanzania Kenya
Rwanda
0
10
20
30
40
50
60
70
80
Rwanda Uganda Tanzania Burundi Kenya Brazil South
Africa
Credit to private sector (2010)
(percent of GDP)
0
20
40
60
80
100
120
Tanzania Burundi Kenya Uganda Rwanda South
Africa
Ratio of loans to deposits (2010)
0
10
20
30
40
50
60
70
80
90
Rwanda Uganda Tanzania Burundi Kenya South
Africa
Brazil
Bank deposits (2010)
percent of GDP
Financial intermediation has increased significantly in recent years, but remains low relative to
comparator countries
6
In practice, there are a number of problems with the use of market structure and regulatory
indicators to measure competitiveness which also apply in the context of the EAC.
3
For one,
market structure is not exogenous since market structure itself can be affected by firms’
performance. Second, interpreting these measures requires some judgment on what should be
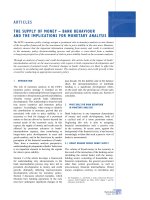
the optimal structure of the banking system. Figure 2 illustrates the problem in the EAC
countries by comparing three frequently used indicators of market structure and
performance—the three-bank concentration ratio, interest rate spread, and the return on
assets (ROA)—for the EAC countries and the more developed South African banking sector.
Regarding market structure, the concentration ratio—the asset shares held by the three largest
banks— in each EAC country compare favorably with South Africa, particularly in the
region’s three largest markets.
This evidence by itself suggests that the level of competition
in the banking sector should be even across these countries. However, bank performance
indicators tell a different story: banks are more profitable in the EAC than in South Africa as
evidenced by the higher spreads and the return on assets (ROA). Lending spreads, in
particular, are about 6 to 8 percent higher in the EAC than in South Africa, while banks’
return to assets is nearly three times as high, suggesting that the level of competition within
the EAC is substantially less than in South Africa. In theory, these attractive rates of return
should attract new participants to compete for market share and push down lending spreads;
however, this does not appear to be happening. A decline in lending spreads would provide
some indication that competition is intensifying within the region.
4
A review of the regulatory framework can also provide some indication of the level of
competition within a country’s banking system. Other things being equal, competition should
be greater when regulatory barriers to entry and exit is low, encouraging new entrants. The
regulatory framework for the EAC region, summarized in Table 1, suggests a relatively open
regime with similar conditions of entry and prudential treatment for all types of banks across
countries. This would be expected to support a healthy level of competition, especially given
the rates of return recorded by existing banks across the region. However, using the
regulatory framework of banks to assess competition can be misleading, simply because
3
Regarding indicators of market structure, there is the lack of clarity as to whether market structure determines
bank behavior (structure-conduct-performance hypothesis); or is the result of bank behavior (efficient structure
hypothesis). In the former, (i) Structure influences conduct (e.g., lower concentration leads to more competitive
the behavior of firms); and (ii) Conduct influences performance (e.g., more competitive behavior leads to better
bank performance). In the latter, structure is not (necessarily) exogenous since market structure itself is affected
by firms’ conduct and hence by performance.
4
This is because a bank that raises its prices above marginal cost and begins to earn abnormal profits, will
attract potential rivals into the market to take advantage of these profits. This process will continue until profits
fall back to the competitive equilibrium. This implies that competitive outcomes are possible even in
concentrated or highly profitable systems (Claessens 2009).
7
Burundi Kenya Rwanda Tanzania Uganda
Supervisor
Bank of the Republic
of Burundi
Central Bank Of
Kenya
National Bank of
Rwanda
Bank of Tanzania Bank of Uganda
Requirement to operate a bank License License License License License
Entry of foreign banks Permitted Permitted Permitted
Permitted except for
through branches
Permitted except for
through branches
Minimum Capital/
2
FBu 10 bil.
(US$ 8.1 mil.)
KShs 0.5 bil.
(US$ 6.2 mil.)
Rwf 5 bil.
(US$ 8.4 mi.)
TShs 6 bil.
(US$ 4.0 mil.)
Ushs 4 bil.
(US$ 1.7 mil.)
For a subsidiary of a foreign bank same as above same as above same as above same as above same as above
For a branch of a foreign bank same as above same as above same as above Not allowed Not allowed
Required Capital Adequacy Ratio Solvency Ratio: 8%
Total: 12%
Core: 8%
Total: 15%
Core: 10%
Total: 12%
Core: 10%
Total 12%
Core: 8%
Required Liquidity Asset
100% of liabilities with
a maturity of over one
month
20% of all deposit
liabilities, matured,
and short-term
liabilities
20% of all deposit
liabilities
20 percent of demand
liabilities
20% of deposit
liabilities
Maximum percentage of capital that can be owned
by a single owner
20% (can be
exceeded subject to
an authorization)
25%
No ceiling (subject to
permission)
20% 49%
Limit in lending to single of related borrowers 20% of equity 25% of core capital 25% of net worth 25% of core capital 25% of total capital
Securities Activities
3
Unrestricted Restricted Unrestricted Unrestricted Restricted
Insurance Activities
3
Prohibited Prohibited Unrestricted Permitted Prohibited
Real Estate Activities
3
Prohibited Prohibited Prohibited Prohibited Restricted
Shareholdings of nonfinancial firms
3
Restricted Permitted Permitted Permitted Permitted
Obligatory external audit by qualified auditors Yes Yes Yes Yes Yes
Supervisory power to declare insolvency of a bank No Yes Yes Yes Yes
Explicit Deposit Guarantee No Yes No Yes Yes
Sources: World Bank; Bank Regulation and Supervision Database; and Central Bank websites.
1
Definitions of technical concepts such as core capital and liquidity differ among the countries.
2
KShs 1 bil. (US$ 12.9 mil.) from 2012.
Bank Re
g
ulation of EAC Countries
1
3
Unrestricted - A full range of activities in the given category can be conducted directly in the bank; Permitted - A full range of activities can be conducted, but all or some
must be conducted in subsidiaries; Restricted - Less than a full range of activities can be conducted in the bank or subsidiaries; Prohibited - The activity cannot be
conducted in either the bank or subsidiaries.
Table 1
8
other (informal) barriers—such as population size and volatile macroeconomic conditions—
can also be important determinants of competitive pressures in the banking system even
when regulatory barriers have been eliminated (Bikker and Spierdijk, 2009).
B. Empirical Measures of Competition
By estimating bank-pricing behavior, nonstructural measures such as the Lerner index and
the Panzar Rosse H-statistic are better able to gauge market contestability. These formal
empirical tests for competition have been applied to banking systems in individual countries
Figure 2. EAC: Indicators of Market Structure and Performance
•Sources: IFS; and Fund staff estimates.
0
10
20
30
40
50
60
70
80
90
100
Burundi Rwanda Tanzania Uganda Kenya South
Africa
Asset share of three largest banks
0
2
4
6
8
10
12
14
South
Africa
Kenya Rwanda Burundi Uganda Tanzania
Spread between lending and deposit rates (end-2010)
basis points
0
0.5
1
1.5
2
2.5
3
3.5
4
Kenya Uganda Tanzania Rwanda South Africa
Return on Assets, percent (2010)
0
5
10
15
20
25
30
Kenya Uganda Tanzania Rwanda South Africa
Return on Equity, percent (2010)
9
((Schaeck et al. (2009), Mathews et al. (2007), and Berger et al. (2009). Nevertheless,
evidence from these more sophisticated models of bank behavior is scarce for the EAC
region. The international evidence on competitiveness presented in studies such as Claessen
and Laeven (2004) and Ariss (2010) include very few SSA countries, and only Kenya from
the EAC sub-region.
We estimate both the Lerner index and the H-statistic although the Lerner index is our
preferred indicator of competition in the banking sector for two main reasons: First, it is the
only measure of competition computed at bank level, thus giving more degrees of freedom in
the regression analysis of the determinants of competition. Second, unlike the H-statistic, the
accuracy of the Lerner index does not depend on equilibrium in the banking system.
5
The H-
statistic is nonetheless still useful when we compare the degree of competition in the EAC as
an aggregated unit with other countries.
Data
We retrieve bank-level consolidated financial data for the years 2001–2008 from the
Bankscope database provided by Fitch-IBCA. We apply a number of filtering rules to
eliminate nonrepresentative data. For example, we exclude banks with missing key variables
from the sample. We are also careful to drop banks as opposed to bank-year observations in
order to sustain and benefit from the panel dimension of the data. This reduced our final
sample to 65 banks operating in Kenya (29), Tanzania (17), Rwanda (7), and Uganda (12).
However, the banks in the final sample still represent over 75 percent of total assets in the
banking system of each country.
Table 2 provides a summary of the characteristics of banks sampled across countries. With
the exception of bank size (total assets in US$) there is a noticeable similarity in bank
characteristics across the EAC countries. The banking systems across the countries appear to
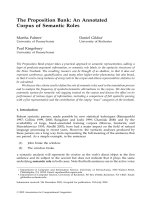
have similar cost revenue and profit structures. Figure 3 indicates a high preference for
liquidity in banks in EAC countries, as evidenced by the somewhat low ratio of net loans to
assets (on average between 40 and 60 percent), and reflected in the comparatively low level
of financial intermediation. The Kenyan banking system with the highest ratio of loans to
total assets has a higher ratio of liquid assets and correspondingly lower loans to total assets
when compared with South Africa. Surprisingly this preference for liquidity has not impaired
on the profitability of banks in EAC countries even after adjusting for risks as evidenced by
the risk-adjusted return on assets. Some of the causes for liquidity preference is discussed in
more detail in the next section. The cost structure of banks, personnel costs, financing costs,
and the cost of fixed capital are broadly comparable across the four countries.
5
The empirical test for equilibrium is rejected for Rwanda.
10
Table 2
The Lerner Index
The Lerner index of market power captures pricing power by measuring a bank’s ability to
set price above its marginal cost. In a perfectly competitive system, the price a bank charges
for its services should be equal to its marginal cost and therefore, such a bank will have no
market power. The greater the deviation, the less competitive the banking system is
interpreted to be. By construction, the index ranges from a high of 1 to a low of 0, with
higher numbers implying greater market power. The Lerner index is calculated as:
/
1
Kenya Rwanda Tanzania Uganda
Net loans to total asset 0.56 0.51 0.46 0.43
Total deposits to total liabilities 0.92 0.93 0.78 0.63
Total equity capital to total asset 0.15 0.14 0.12 0.14
Total revenue to assets 0.12 0.12 0.12 0.14
Cost of labor (personel costs/total assets) 0.03 0.03 0.02 0.03
Finance (interest expense/ total deposit+money market funding) 0.04 0.03 0.03 0.03
Fixed capital (Other operating and administrative expenses/ total assets) 0.03 0.04 0.05 0.03
Return on assets (risk adjusted) (roa/std deviation of roa) 2.60 2.86 2.78 3.53
Return on equity (risk adjusted) (roe/std deviation of roe) 2.48 1.74 3.30 2.42
No of commercial banks 29 7 17 12
Memorandum item:
Total assets (US$ million) 282.79 76.15 269.96 152.45
Sources: Bankscope; and Authors Own Calculation.
Summary Statistics (averaged over all banks during the period 2000–2007)
Banks in the sample represents over 90 percent of total assets in the banking system
Figure 3. Kenya and South Africa: Indicators of Liquidity in the Banking system, 2001–2010)
(Liquid Assets and Loans, percentage of total assets)
Source:
0
10
20
30
40
50
60
70
80
90
100
2001 2002 2003 2004 2005 2006 2007 2008 2009 2010
Kenya
LIQUID ASSETS
LOANS
0
10
20
30
40
50
60
70
80
90
100
2001 2002 2003 2004 2005 2006 2007 2008 2009 2010
South Africa
LIQUID ASSETS
LOANS
Sources: IFS; and Fund staff estimates.
11
2001 2008 Period average
Kenya 0.29 0.28 0.29
Rwanda 0.36 0.41 0.37
Tanzania 0.34 0.37 0.32
Uganda 0.39 0.36 0.36
Lerner Index Over Time
The subscript denotes bank , and the subscript denotes year . Price
is the ratio of total
revenues (interest and noninterest income) to total assets for bank i at time t, and
is the
marginal cost for bank i at time t.
To derive marginal cost MC, the translog cost function (Equation 2) for each country is
estimated in order to extract the elasticity of total cost to the price of the bank’s main inputs.
∑
,
∑
,
∑∑
,
,
2
is the total operating cost plus interest expenses for bank i at time t.
, total assets is
a proxy for the banks output.
,
is the price of a bank’s three main inputs( labor, funds,
and fixed capital). Input prices for labor, funds, and fixed capital are calculated as the ratios
of personnel expenses to total assets, interest expenses to total deposits, and other operating
and administrative expenses to total asset respectively. Year fixed effects are also introduced
with robust standard errors by bank.
Marginal cost is then computed as:
∑
,
3
The estimated Lerner index ranks the EAC countries in terms of competitiveness in the
following manner; Kenya, Tanzania,
Uganda, and Rwanda. The average value of
the Lerner Index for the EAC countries is
between 29 and 36 percent, implying that
banks price between 29 and 36 percent
above marginal costs. However, the results
show competition has not improved over
time in Rwanda, Tanzania, and in Uganda.
The Lerner index- the difference between price and marginal cost (Lerner index) seem to
have increased over time in these countries. Higher values of the index imply less
competition.
Finally, the Lerner index is averaged over time for each bank i for inclusion in the regression
in Section 3.
12
The Panzar and Rosse H-statistic as an Alternative Measure of Competition in the EAC
The H-statistic measures the degree of competition as the extent to which a change in factor
input prices is reflected in revenues earned by a specific bank in equilibrium. Under perfect
competition, an increase in input prices raises both marginal costs and total revenues by the
same amount as the rise in costs. Under a monopoly, an increase in input prices will increase
marginal costs, reduce equilibrium output and consequently reduce total revenues
(Claessens 2009). The H-statistic is estimated from a reduced form bank revenue equation as
the sum of the elasticity of the total revenue of the banks with respect to the bank’s input
prices. The H-statistic varies between 0 and 1, with less than 0 being monopoly, less than 1
being monopolistic competition and 1 being perfect competition.
Similar to several cross-country studies such as Claessens and Laeven (2004) and Bikker et
al. (2007), we use the following reduced form log-linear revenue equation which is a
variation of the Panzar and Rosse (1987) methodology:
ln
,
ln
,
ln
,
ln
,
ln
,
ln
,
(4)
We include three variables to control for bank portfolio characteristics. Specifically,
,
the
ratio of equity to total assets controls for the possibility that banks with lower capital (higher
bank risk potential) face higher input costs, in particular, the cost of funds (
,
.
,
the
ratio of net loans to total assets is a proxy for the banks’ portfolio mix or credit exposure and
,
the logarithm of total assets for bank size. This is because larger banks benefiting from
economies of scale may face lower costs of production and vice versa. D is a vector of year
dummies for the years 2001–2008 that controls for year specific effects. We estimate
Equation (4) using three methods: bank-specific fixed effect regressions, the generalized least
square (GLS) regressions, and the GLS adjusted for panel heteroskedasticity. The H-statistic
equals
. In what follows we refer to the H-statistic as the average of the H-
statistic estimates from the three models across countries.
The interpretation of the H-statistic
if H ≤ 0 Monopoly
if H = 1 Perfect competition or natural monopoly
in a perfectly contestable market
0 < H < 1 Monopolistic competition
13
The H-statistic for the EAC countries, varies between 0.24 (Rwanda) and 0.60 (Kenya),
implies a monopolistic competition is what best describes the degree of competition in the
EAC. A monopolistic competition (MC) is
between the two extremes of a monopoly
and perfect competition. This type of
market structure is different from a pure
monopoly in that there are no regulatory
barriers to entry. However, some banks still
exert monopoly power on product pricing,
particularly since economies of scale
enjoyed by the dominant players—to some
extent—serve as an implicit barrier to
entry.
6
III. D
ETERMINANTS OF COMPETITION IN THE EAC BANKING SYSTEM
In this section, we regress the Lerner index (the preferred measure of competitiveness) on a
number of country characteristics in the model below using weighted least squares
regressions with heteroskedasticity robust standard errors and controls for year-specific
effects:
,
,
(5)
Where
is the average Lerner index for bank i over the sample period.
the vector of
explanatory variables falls into five categories: market structure, contestability, level of
economic development and the quality of the institutional framework, bank specific
conditions and the liquidity preference of banks. To account for variations in the structure of
the banking system, we use the asset concentration ratios in the largest 3 banks and
population—a proxy for market size. For contestability of the respective markets, we include
a variable that measures the proportion of banks that are foreign owned in each country and
the index of banking freedom from the Heritage foundation’s database. By construction, the
banking freedom index measures the degree of regulatory restrictions, government
involvement in financial markets through owning shares in banks, as well as the extent of
financial and capital market development. A higher value of the index represents greater
bank freedom. Per capita income, inflation, and the property rights enforcement indicator are
included in all regressions as a measure for variations in the level of economic development
and the quality of institutions. We use the 91-day Treasury bill, the main instrument of open
market operations in the EAC countries, as a proxy for the liquidity preference of banks. We
acknowledge that monetary policy is not intended to target competition in the banking
6
Monopolistic competitions may also involve some tactical collusion between the dominant banks in the
system that results in these banks having a similar output and pricing patterns, although this should not be
confused with explicit and mostly illegal collusive agreements.
H-statistic in the EAC (2001–2008)
Kenya 0.60
Rwanda 0.24
Tanzania 0.56
Uganda 0.55
EAC 0.61
Source: Authors calculation using bankscope data and
the methodology outlined in section 2. In Rwanda the
test of long-run market equilibrium is rejected.
N.B: Interpretation of the h-stat:if H ≤ 0 Monopoly
if H = 1 Perfect competition or natural monopoly
in a contestable market. 0 < H < 1 Monopolistic competition.
14
0
10
20
30
40
50
60
Burundi Kenya Rwanda Tanzania Uganda South Africa
Index of property rights protection (2010)
Index ranges from 0-100, higher scores represent greater protection
system. However, the reliance on treasury bills as the main instrument of open market
operations in the EAC can affect bank competition if it impacts the liquidity preference of
banks. We also control for variations in bank specific characteristics such as bank size (total
assets), performance (risk-adjusted return on assets) and lending (ratio of loans to assets) in
each set of regressions. Other studies in the literature have used most of these measures while
undertaking similar analysis.
Empirical Analysis
All regressions include the three variables that measure economic and institutional
development. The results in table 3 are presented in columns depending on the categories of
additional independent variables used. The regression results show some natural and
regulatory-induced barriers to competition exist in the EAC. Our results consistently link
socio-economic factors such as the level of economic development and population size to the
degree of competition.
Our results show the level of
economic and institutional
development matter for
banking sector
competitiveness. Specifically,
banks are less competitive in
an environment of higher
inflation, perhaps due to the
fact that interest rates become
an unreliable benchmark to
price financial services.
Furthermore, the positive
relationship between GDP per
capita and competition is as
expected. Overall economic
growth combines a number of aspects—efficiency of the financial system, access to financial
services, availability of credit to the private sector, and systemic stability.
In addition, we find that the index of property rights enforcement—a proxy for institutional
development— increases competition in the banking system. The statutory protection and
enforcement of property rights is lowest in Burundi compared to other EAC countries.
However, all EAC countries have much lower property right protection compared to the
more developed South African banking system. The positive association between all
indicators of economic and institution development and competition persist in all regressions.
15
Table 3
Results from the regression model explain the determinants of bank competition in the EAC countries.
Heteroskedasticity adjusted standard errors are in parentheses. *, **, *** represents significance at the 10, 5 and
1% significance levels respectively. The degree of bank competition is proxied by the Lerner index which is the
difference between price and marginal cost with higher values indicating a higher degree of market power and
lower competitiveness. Per Capita GDP, Inflation, and Property Rights account for differences in the level of
economic development and the macroeconomic conditions across countries. Concentration is the share of
assets of the three largest banks in the total banking system assets. Population is a proxy for market size.
Foreign Banks is the proportion of banks that are foreign owned as identified by Bankscope. Bank freedom
measures the degree of regulatory restrictions and government involvement in the banking system. Higher
values of the Banking freedom index represent greater freedom. Bank size is the natural logarithm of total
assets, Loan size is the ratio of loans to assets and accounts for variations in the portfolio mix of banks. The risk
adjusted ROA is the banks average return on assets divided by the standard deviation of the ROA. The 91 day t-
bill rate is the period average of the monthly rates.
Broadly speaking, banks in the EAC appear less competitive than in countries with a higher
level of financial and economic development (see Figure 4). H-statistic in these countries
tends to be upwards of 0.7 and the Lerner index below 0.25.
Market Structure Contestability Bank condition Liquidity preference
Per capita GDP -0.053*** -0.083*** -0.167*** -0.152***
(0.008) (0.004) (0.001) (0.006)
Inflation -0.020*** 0.007*** 0.019*** 0.024***
(0.002) (0.002) (0.003) (0.003)
Property Rights -0.113*** -0.168*** -0.225*** -0.213***
(0.011) (0.004) (0.008) (0.007)
Concentration 0.146***
(0.012)
Population (market size) -0.014***
(0.005)
Foreign Banks 0.342***
(0.010)
Banking freedom -0.017***
(0.006)
Bank size 0.000
(0.000)
Loan size (ratio of loans to assets) -0.027**
(0.012)
Performance (risk adjusted ROA) 0.001**
(0.000)
T-bill rate (91 days) 0.015***
(0.003)
Number of Banks 65 65 64 65
Number of observations 501 501 379 501
Cross-Country Determinants of the Lerner Index
16
Regarding bank specific indicators, we find higher bank lending (loan-to-asset ratio)
increases competition as banks compete to offer the best rates to the most creditworthy
clients. Boyd et al. (2009) report a similar result in their study of banking systems around the
world. The high profitability of EAC banks against a backdrop of lending to a small segment
of the population is damaging to competition. This result underscores the need to improve the
availability of credit information and the enforcement of contracts in order for banks to start
lending to smaller businesses and households. The measure of bank size although positive is
not significant; suggesting that the dominance of large banks may reduce the degree of
competition in the EAC countries. Table 4 below shows that large banks in the EAC
countries on average are less competitive (higher Lerner index). This higher margin between
price and marginal costs also reflects the higher profits these banks earn.
Figure 4. Measures of competition in Banking Systems around the World
(lower ranking on charts reflects less competitive banking systems)
Source: Authors calculation for EAC countries for using bankscope data during the period 2001–2008. Estimates of Lerner index for
other countries is taken from Ariss (2010 ) using bankscope data for the period 1999
–2005. Estimates of H-statistic is taken from
Claessens and Laeven (2004) using bankscope data for the period 1994
–2001.
0.37
0.36
0.3578
0.32
0.3035
0.3007
0.29
0.2895
0.2685
0.258
0.253
0.2496
0.246
0.2334
0.23
0.2235
0.2179
0.2071
0.1998
0.1956
0.1953
Rwanda
Uganda
Zambia
Tanzania
Latvia
Senegal
Kenya
Venezuela
Ghana
Tunisia
Czech Republic
Ind ia
Hungary
Poland
Brazil
Peru
Bangladesh
Chile
Honduras
Mauritius
Costa Rica
Lerner Index (EAC vs. other countries)
0.241307733
0.53
0.5499017
0.564820567
0.6031288
0.66
0.66
0.68
0.69
0.72
0.73
0.74
0.75
0.77
0.78
0.81
0.83
0.85
0.92
Rwanda
Ind ia
Uganda
Tanzania
Kenya
Chile
Latvia
Malaysia
Bangladesh
Peru
Czech Republic
Venezuela
Hungary
Poland
Mexico
Honduras
Brazil
South Af rica
Costa Rica
H-statistics (EAC vs. other countries)
17
Table 4: Comparing the Lerner Index in Large vs. Other Banks.
Ratio of
Loan to Total
Asset
Ratio of
Liquid to
Total Asset
Performance
(risk- adjusted
ROA)
Lerner
Index
Kenya Top 3 largest banks 0.60 0.29 3.27 0.34
Other Banks 0.55 0.34 2.58 0.29
Rwanda Top 3 largest banks 0.50 0.30 4.91 0.45
Other Banks 0.52 0.37 1.35 0.28
Tanzania Top 3 largest banks 0.30 0.60 6.44 0.38
Other Banks 0.47 0.41 1.99 0.32
Uganda Top 3 largest banks 0.52 0.37 2.89 0.42
Other Banks 0.40 0.42 3.82 0.34
Sources: Bankscope; and authors' definition.
We find that both market structure and other market contestability indicators affect the
degree of competition. There is a positive and statistically significant relationship between
the measure of concentration (3-bank concentration ratio) and the Lerner index—suggesting
that concentration reduces competition in the EAC banking systems. The average three-bank
concentration ratio in the EAC is 61 percent although this masks significant differences
between countries like Kenya with less than 40 percent and Burundi with ratio over
90 percent. If at all, bank concentration measures competition then competitive pressures are
clearly uneven across countries which may affect results in a pooled sample of this nature.
However, one should note that the absence of well-developed institutions and economic
freedoms makes it likely that banks in concentrated systems will be more collusive resulting
in higher interest margins. This result is similar to what is reported in Demirgüç-Kunt,
Laeven, and Levine (2004) in the less developed countries in their sample. We also find that
the size of the market (population) influences competition since banks are willing to take
smaller profit margins if spread over a higher volume of transactions to gain market power.
Also, financial systems in large countries are less likely to suffer from diseconomies of scale
at the infrastructure or regulatory level.
Regarding the indicators of market contestability, we find the presence of foreign banks in
the EAC is not associated with greater competition in the host country’s’ banking system.
Foreign-owned banks have a strong presence in the EAC controlling more than half the total
assets of the banking sectors in Uganda, Rwanda, and Tanzania (79 percent, 54 percent, and
51 percent, respectively). In Kenya and Burundi, these ratios are 45 percent and 41 percent,
respectively. The impact of this on market segmentation is obvious. This dominant position
makes it difficult for local banks to compete with foreign banks that typically have access to
lower cost financing and more superior technology from parent banks in home countries.
18
Table 5 shows foreign-owned banks in the EAC are less competitive, particularly in Kenya
and Uganda where the foreign banks tend to be large. Foreign banks in the EAC typically
have also higher liquidity ratios (and, accordingly, lower shares of loans) in their portfolios
than local banks.
Table 5: Comparing the Lerner Index in Foreign vs. Other Banks.
Sources: Bankscope; and authors’ calculation.
Bankscope defines a foreign bank as a bank that is at least 51 percent owned by a foreign entity.
According to this definition, all the Ugandan banks in the sample would be foreign-owned according.
Therefore, for the case of Uganda alone we modify the threshold and define a foreign bank to be a
bank that is 100 percent owned by a foreign entity.
The negative impact of foreign bank presence on competition is echoed in the literature
particularly in developing countries where these banks concentrate on large corporations,
leaving out SMEs and credit worthy individuals. For example, World Bank (2007) states that
the presence of foreign banks has not led to a substantial improvement in access to financial
services in African countries although foreign bank presence is beneficial along various other
dimensions such as increasing cross-border capital flows and risk diversification. Poghosyan
(2010) shows foreign bank presence does not improve competition in emerging economies,
while, Jeon et al. (2011) were only able to find a positive influence of foreign bank presence
and competition in less concentrated financial systems.
We also show that banking systems with government interference on banking activities are
less competitive. This suggests that there is still room to further reduce the dominance of
state-owned banks in the EAC countries. In Kenya, Rwanda and Burundi the government
controls majority shareholdings in the largest bank although this is less the case for Tanzania
and Uganda.
Ratio of Loan to
Total Asset
Ratio of Liquid
toTotal Asset
Performance (risk-
adjusted ROA)
Lerner
Index
Kenya Foreign banks 0.54 0.34 4.40 0.32
Other Banks 0.57 0.33 1.76 0.28
Rwanda Foreign banks 0.50 0.39 0.28 0.28
Other Banks 0.51 0.32 4.62 0.40
Tanzania Foreign banks 0.40 0.50 3.63 0.32
Other Banks 0.51 0.33 1.47 0.40
Uganda Foreign banks 0.45 0.40 4.64 0.38
Other Banks 0.41 0.41 4.30 0.35
19
Finally, our results suggest a negative relationship between the liquidity preference of banks,
as measured by the t-bill rates, and competition in the EAC banking system. We do not
interpret this as an indictment on the conduct of monetary policy but rather an unintended
consequence of high t-bill rates, on both lending rates and the liquidity preference of banks
which subsequently affects competition amongst banks. This result—in line with Beck and
Hesse (2009) in their study of the determinants of interest rate spreads in Uganda and
Khemraj’s (2010) study of the determinants of bank liquidity in a sample of countries that
also include Tanzania and Uganda—underscore the need for a more diverse range of policy
instruments used by the EAC monetary authorities.
IV. CONCLUSION AND POLICY RECOMMENDATIONS
Competition in the banking sector is extremely important given the pivotal role that banks
play in the provision of credit, the transmission of monetary policy and the maintenance of
systemic stability. Nonetheless, research on banking sector competitiveness includes very
few SSA countries and only Kenya from the EAC sub-region.
Against this backdrop, we estimate two price-setting (nonstructural) measures of the degree
of competitiveness in the banking systems within the EAC—the Lerner index and H-statistic.
We also identify factors that determine competitiveness in the EAC banking sector, and
suggest policy recommendations to shape the design of competition policies.
The Lerner index and the H-statistic ranks the countries in terms of the degree of banking
system competitiveness in the following order: Kenya, Tanzania, Uganda, and Rwanda.
Furthermore, the H-statistic show the banking system in the EAC as an aggregated unit can
be categorized as monopolistic competition. This implies that although there are no formal
regulatory barriers to entry as in a monopoly, there are structural impediments that enable
some banks to continue to enjoy a degree of monopoly power. Broadly speaking, banks in
the EAC are less competitive than other countries with a higher level of financial and
economic development.
Regarding the determinants of competition, empirical results from panel data regressions
indicate the following:
Higher levels of economic and institutional development increase banking sector
competitiveness.
Greater market concentration reduces competition.
Banks in larger markets (proxy by population) are more competitive perhaps, because
of the economies of scale in transactions.
Stronger market contestability—lower degree of state intervention in the financial
sector through ownership of financial institutions, as opposed to greater foreign
ownership of banks—matters for competition in the host country.
20
Increased lending to the private sector fosters competition, while high bank
profitability has the opposite effect.
To further strengthen bank competition and increase access to financial services, policy
makers will need to aggressively pursue reforms aimed at eliminating the structural barriers
to contestable banking systems in the region. Specific policies would strengthen the
protection of property rights as inefficient property registration and enforcement systems
serve to increase lending risk and raise the cost of borrowing. In addition, other policies
would aim to:
Modernize the legal infrastructure, particularly the laws governing collateral,
foreclosure and bankruptcy, to allow borrowers to pledge relevant assets as security
for credit. Contractual enforcement procedures are extremely difficult to navigate in
the EAC countries, while the administration of company and insolvency laws is
costly, inefficient, and subject to abuse.
Provide accessible financial infrastructure such as credit bureaus and payment
systems to support the safe expansion of retail credit. The development of these
services is critical to increasing competition in the loan market. A number of
countries in the region have already started the process of payment system
modernization.
Adopt comprehensive microfinance policies that safely increase access to financial
services for lower-income households and SME’s. A more inclusive financial system
will increase the demand for bank credit and minimize the cost of financial
transactions. The mobile-banking revolution and the introduction of agency banking
is an example of a microfinance initiative that is already accelerating financial
deepening. Mobile-banking has advanced particularly rapidly in Kenya, but is also
quickly gaining popularity in the other EAC countries.
7
In addition, bank regulations should continue to promote contestable markets by
leveling the playing field across the different types of banks and the products they
offer. One way of doing this is to address market segmentation due to large state and
foreign bank presence by privatizing the few remaining government owned banks in
favor of domestic participation.
Following the period surveyed in this paper, the EAC countries have made significant
progress toward regional integration that can mitigate, at least in part, diseconomies from
small scale of financial markets in the EAC and deepen competition within and across
7
Launched in 2007, M-Pesa (Pesa is Swahili for money) is an innovative payment service that enable
customers to transfer money quickly and cheaply within Kenya via mobile phone without the need to have a
bank account.
21
national boundaries
8
By establishing a common market, the EAC countries expect to promote
cross border liberalization of flows, expand the credit industry, and consequently increase
investment and economic growth. The common market officially launched in June 2010, is
awaiting full implementation by end 2015.
9
The prioritization of the critical mass of policy reforms discussed above at the national level
is essential at this juncture in support of economic integration and progress toward the
establishment of the monetary union as envisaged by the EAC countries. Only when
domestic markets become better regulated, and more efficient as a result of increased
competition would it be easier to reap the benefits from integration. In addition, more
competitive banking systems will help to ensure efficient policy transmission in a monetary
union since bank lending is more likely to respond to changes in monetary policy if banks do
not possess market power in the loan market.
8
Kenya, Tanzania, and Uganda agreed on establishing the East African Community in 1999 with an aim of
deepening cooperation among member states, including establishment of a customs union, common market,
monetary union and ultimately political federation of East African States (More precisely, they agreed on
“re”establishing the East African Community, as the organization previously existed from 1967 to 1977 and
collapsed due to intraregional discord). Burundi and Rwanda later joined the community in 2007.
9
Financial markets are integrated when the law of one price holds; that is, when securities with identical cash
flows command the same price, firms or household should be able to access finance on the same terms within
and across national boundaries
22
References
Ariss, R, T., (2010), On the implications of market power in banking: evidence from
developing countries, Journal of Banking and Finance 34 (4), 765–775
Beck, T., and Hesse, H., (2009), why are interest spreads so high in Uganda?, Journal of
Development Economics, 88(2), 192–204
Berger, A., Klapper, Leora, F., and Turk-Ariss, R., (2009), Bank competition and financial
stability, Journal of Financial Services Research, 35(2), 99–118
Bikker, Jacob A., and Laura Spierdijk, (2009), “Measuring and Explaining Competition in
the Financial Sector,” Discussion paper series / Tjalling C. Koopmans Research
Institute, Vol. 09–01
Bikker, J. A., Spierdijk, L., and Finnie, P., (2007), “The impact of Market Structure,
Contestability and Institutional Environment on Banking Competition,” DNB
Working Paper No.156, De Nederlandsche Bank, Amsterdam.
Boyd, J. H., De Nicoló, G., and Jalal, A.M., (2009), Bank Competition, Risk and Asset
Allocations, IMF Working Paper 09/143, International Monetary Fund,
Washington D.C
Claessens, S., (2009), competition in the financial sector: overview of competition policies,
IMF Working Paper, 09/45, Washington DC: International Monetary Fund
Claessens, S., and Laeven, L., (2004), What drives bank competition? Some international
evidence, Journal of Money Credit and Banking, 36 (3), pp 563–583
Demirgüç-Kunt, Asli, Luc Laeven, and Ross Levine, 2004, “Regulations, Market Structure,
Institutions, and the Cost of Financial Intermediation.” Journal of Money, Credit, and
Jeon, B.N., Olivero, M. P., Wu, J., (2011), Do foreign banks increase competition? Evidence
from emerging Asian and Latin American banking markets, Journal of Banking and
Finance,Vol. 35(4), pp. 856–875
Matthews, K., Murinde, V., and Zhao, T., (2007) Competitive conditions among the major
British banks, Journal of Banking and Finance 31 (7), pp. 2025–2042
Panzar, J, C., and Rosse, J.N., (1987), “Testing for ‘Monopoly’ Equilibrium,” Journal of
Industrial Economics, Vol. 35, pp. 443–56.
23
Poghosyan, T., (2010), Re-examining the impact of foreign bank participation on interest
margins in emerging markets, Emerging Markets Review, 11, pp390–403
Schaeck, K., Cihak,M., Wolfe, S., (2009). Are competitive banking systems more stable?
Journal of Money Credit and Banking 41, Vol 4, pp.711–734.
Khemraj, T., (2010), what does excess liquidity say about the loan market in less developed
countries? Oxford Economic Papers, 62, 86–113
World Bank (2007), Financial integration in two regions of sub-Saharan Africa: How
Creating Scale in Financial Markets can Support Growth and Development,
Washington DC
24
Appendix: Structure of the Banking System
Kenya:
The commercial banking industry in Kenya is the fourth largest in the region behind South Africa,
Nigeria, and Mauritius. The banking sector includes 43 commercial banks, including 12 foreign
banks. Cross-border linkages are an important feature; seven Kenyan banks have established
14 subsidiaries in neighboring countries.
Tanzania:
The banking system in Tanzania has grown significantly since 2003, but remains relatively small
and dominated by a top tier of larger domestic legacy and foreign banks. There are 33 commercial
banks in Tanzania, including 16 foreign banks. Government ownership is limited to four smaller
fully-owned banks and minority stakes in the three largest domestic banks. The top tier mainly
caters to a small group of large corporate, which often represent up to 70 percent of banks’ loan
portfolios.
Uganda:
The sector has expanded significantly since a moratorium on licensing new banks was lifted in
2005. Eight new banks have been licensed since 2005, bringing the total to 22 commercial banks,
including 14 foreign banks, operating in Uganda. In addition, the total network of bank branches has
more than tripled over that time to 390.
Rwanda:
There are 12 commercial banks operating in Rwanda, including three foreign banks.
Burundi:
There are seven commercial banks and two financial establishments in Burundi with total assets
representing 54 percent of GDP. Privately owned banks account for 73 percent of assets and 80
percent of deposits; the government remains the majority shareholder in two banks, and in two
financial establishments specializing in housing and development