09 - personalized email prioritization based on content and social network analysis
Bạn đang xem bản rút gọn của tài liệu. Xem và tải ngay bản đầy đủ của tài liệu tại đây (626.19 KB, 7 trang )
12 1541-1672/10/$26.00 © 2010 IEEE IEEE INTELLIGENT SYSTEMS
Published by the IEEE Computer Society
S O C I A L L E A R N I N G
Personalized Email
Prioritization Based
on Content and Social
Network Analysis
Yiming Yang, Shinjae Yoo, and Frank Lin, Carnegie Mellon University
Il-Chul Moon, Korea Advanced Institute of Science and Technology
The proposed
system combines
unsupervised
clustering, social
network analysis,
semisupervised
feature induction,
and supervised
classication to
model user priorities
among incoming
email messages.
interest, and a single sender can ood multi-
ple receivers. As a result, users must process
a large volume of email messages of differ-
ent importance levels.
1
Research recently es-
timated that businesses lose US$650 billion
annually in productivity due to unnecessary
email interruptions (
2008/10/15/cio-email-manage-tech-cio-cx_
rm_1015email.html). There is an urgent
need to solve this information overload
problem by developing systems that can
learn personal priorities from data and iden-
tify important messages for each user.
Personalized email prioritization (PEP)
has been underexplored. Unlike spam lter-
ing, where people are less concerned with
sharing individually labeled spam messages,
PEP research looks at collecting nonspam
email messages with personally assigned
importance labels. Few people are will-
ing to share their personal messages due to
privacy concerns, however, and companies
such as Google, Yahoo, and Microsoft, that
have access to customers’ email messages,
cannot share private data with academic
institutions for the same reason. Publicly
available email data, such as the Enron cor-
pus, are insufcient for training and testing
of PEP systems because they lack personal
importance judgments. This leaves research-
ers no choice but to collect private data un-
der strict Institutional Review Board (IRB)
guidelines. Such data-collection processes
are costly, time consuming, and tedious,
making it difcult to acquire a large number
of users with diverse criteria in judging the
importance of email messages.
This article presents the rst study on
PEP with a fully personalized method-
ology,
2
where only each user’s personal
email data (textual content and social
network information) is available for the
system during the system’s training and
testing. This is an important assumption
for the generality of PEP methods—that
is, we cannot rely on the availability of
E
mail is one of the most prevalent personal and business communica-
tion tools today, but it exhibits some signicant drawbacks. Unlike tele-
phone conversations or face-to-face meetings, email messages are received
(after some spam ltering) in the same way regardless of a user’s level of
IS-25-04-Yang.indd 12 12/07/10 1:47 PM
JULY/AUGUST 2010 www.computer.org/intelligent 13
centralized access to customer pri-
vate data in the development cycle
or evaluation phase, and we can-
not take the liberty of using a par-
ticular user’s private data to build
models for other users because of the
potential leak of private information.
Such strictly separate data makes
our work fundamentally different
from research in spam ltering and
other previous work on email-based
prediction. (See the “Related Work
in Personalized Email Prioritization”
sidebar for other approaches.)
We propose a novel approach that
combines unsupervised clustering, so-
cial network analysis, semisupervised
feature induction, and supervised
classication to model user priori-
ties among incoming email messages.
We treat the priority prediction task
as a supervised classication problem
and use standard support vector ma-
chines (SVMs) as the classiers. The
novel part of our approach is the en-
riched representations of email mes-
sages and users, with automatically
extracted features.
We constructed a data set of ano-
nymized email messages with user-
annotated importance levels (from 1
to 5) for this study. We use personal
email data to induce such enriched
features. A personal social network
(PSN) is automatically constructed
for each user based on the messages
he or she receives. The PSN is a graph
with nodes that represent email con-
tacts (senders plus recipients in the
CC lists) and links that indicate pair-
wise email interactions among the
contacts. We constructed a PSN for
two reasons:
• We do not want our method to rely
on the unrealistic assumption that
multiuser private data are always
available for system development
and model optimization.
• A PSN better represents a user’s
social activity than a global so-
cial network, which might include
noisy features and de-emphasize
personalization in the inductive
learning of important features
through the network.
By analyzing each user’s PSN graph
structure, our system can capture
social groups of senders and recipi-
ents who have similar email interac-
tion patterns or similar social roles
and possibly share similar priority
judgments over email messages. Our
system can also propagate priority
scores through a personal email net-
work, from user-labeled messages
(training instances) to other messages
that do not have user-assigned impor-
tance scores.
Social Clustering
To predict the importance of email
messages, the sender information
would be highly informative. For ex-
ample, we might have multiple project
teams or social activity groups, and
members in each group might natu-
rally share corecipient lists and have
similar judgments on message priority
levels. Thus, capturing such groups
would help us predict the importance
of email message senders or recipients.
When we have a limited amount of
training data, we will likely encounter
E
ric Horvitz and his colleagues built an email alerting
system that used support vector machines to classify
newly arrived email messages into two categories—
that is, high or low in terms of utility.
1
However, their task
did not consider personalization or investigate social net-
work analysis.
Joshua Tyler and his colleagues used the Newman Cluster-
ing algorithm to discover social structures from email mes-
sages.
2
They found that the automatically discovered social
structures (such as social leaders) are consistent with human
interpretation of organizational structures. However, they
did not focus on the email prioritization problem.
Carman Neustaedter and her colleagues defined metrics
for measuring the social importance of individuals based on
the From, To, and CC fields in email messages and recorded
user actions in replying and reading email.
3
They used these
metrics for retrieving old email messages rather than priori-
tization of new messages.
Lisa Johansen and her colleagues used social clustering to
predict the importance of email messages.
4
The major dif-
ference between their method and ours is that their clus-
ters were induced from a community social network, not
based on personal social networks or the content informa-
tion in email messages.
Lastly, Fei-Yue Wang and his colleagues discussed the the-
oretical, methodological, and technological underpinnings
of social computing in general and reviewed the major
application areas.
5
With this article, we leverage the good ideas in these pre-
vious works and develop new techniques for personalized
email prioritization.
References
1. E. Horvitz, A. Jacobs, and D. Hovel, “Attention-Sensitive
Alerting,” Proc. Conf. Uncertainty and Artificial Intelligence,
Morgan Kaufmann, 1999, pp. 305–313.
2. J R. Tyler, D.M. Wilkinson, and B.A. Huberman, “Email as Spec-
troscopy: Automated Discovery of Community Structure within
Organizations,” Communities and Technologies, M. Huysman,
E. Wenger, and V. Wulf, eds., Kluwer, 2003, pp. 81–96.
3. C. Neustaedter et al., “The Social Network and Relationship
Finder: Social Sorting for Email Triage,” Proc. Conf. E-mail and
Anti-Spam, 2005; /> 4. L. Johansen, M. Rowell, and P. McDaniel, “Email Communi-
ties of Interest,” Proc. 4th Conf. E-mail and Anti-Spam, 2007;
/> 5. F.Y. Wang et al., “Social Computing: From Social Informatics
to Social Intelligence,” IEEE Intelligent Systems, vol. 22, no. 2,
2007, pp. 79–83.
Related Work in Personalized Email Prioritization
IS-25-04-Yang.indd 13 12/07/10 1:47 PM
14 www.computer.org/intelligent IEEE INTELLIGENT SYSTEMS
S O C I A L L E A R N I N G
senders who have no labeled mes-
sages in the training set during the
testing phase. If we can identify such
users as members of groups based on
unsupervised clustering, we can in-
fer each user’s priorities for messages
from other group members. That is,
we can cluster users based on their in-
teraction patterns in a personal email
data set. The cluster membership of
the sender of each email message can
be treated as the message’s features
(in addition to a standard bag-of-
word representation) when inferring
its importance. The importance of
each sender group can be automati-
cally learned by SVM classiers.
We chose the Newman Clustering
(NC) algorithm, which researchers
have used to successfully nd social
structures in large organizations.
3
It
denes the edge-betweenness (which
we discuss in detail later) as a measure
of the shortest path(s) going through
a specic link among all-pairs short-
est paths. A link with a high edge-
betweenness score is crucial for con-
necting two highly connected compo-
nent clusters. By deleting links with high
edge-betweenness scores and removing
those edges from the graph, we obtain
disconnected component clusters.
One way to control the granular-
ity level of clusters is to prespecify
the number of desired clusters, which
might be based on domain knowl-
edge about the social networks in
email or automatically determined
by algorithms with a certain opti-
mization criterion or heuristic mea-
sure. For example, the NC method
can pick the number that yields the
largest decrease in the sum of edge-
betweenness per cluster.
4
We use this
method in our work.
Unsupervised Learning of
Social Importance Features
We measure the social importance
levels of contacts without relying on
the availability of labeled training
data. We examine multiple graph-
based metrics to characterize the so-
cial centrality of each contact in a
PSN. Most of these metrics have been
used in social network analysis (SNA)
or link structure analysis but have
not been studied in any depth with
respect to PEP.
Let us dene graph G = (V, E) for
a PSN, where vertices V correspond
to the contacts and edges E reect the
email interactions: E
ij
= 1 if there is
(at least) one message from contact i
to contact j; otherwise E
ij
= 0.
We have dened seven metrics to
describe email message features:
• in-degree centrality,
• out-degree centrality,
• total-degree centrality,
• clustering coefcient,
• clique count,
• betweenness centrality, and
• PageRank score.
In-degree centrality is a normal-
ized measure for the in-degree of each
contact (i):
InDegreeCent( )i E
ji
j
=
=
∑
1
1
| |
| |
V
V
where |V| is the total number of con-
tacts in the PSN. A high score indi-
cates a popular receiver in the PSN.
Out-degree centrality is a normal-
ized measure for the out-degree of
each contact (i). It might imply some
degree of importance, for example,
as an announcement sender or a
mailing-list organizer.
OutDegreeCent( )i E
ij
j
=
=
∑
1
1
| |
| |
V
V
Total-degree centrality is a nor-
malized measure for the number of
unique senders and recipients who
had links with node i. That is, it is the
simple average of the node’s in-degree
and out-degree:
TotalDegreeCent( )i
E E
ij ji
j
=
+
=
1
2
1
| |
|
V
VV|
∑
The clustering coefcient measures
the connectivity among the neighbors
of node i:
ClusterCoef( )i
Z
E
j Nbr i
k Nbr i j k jk
=
∈
∈ ≠
∑
∑
1
( )
( )
where Nbr(i) − {x : (E
xi
≠ 0) ∨ (E
ix
≠ 0)}
is the node’s neighborhood and
Z = |Nbr(i)| ⋅ (|Nbr(i)| − 1) is the
normalization denominator. Previ-
ous research used this metric to dis-
criminate spam from nonspam email
messages.
5
A clique is generally dened
as a fully connected subgraph in
an undirected graph. The clique
count of node i in our case is de-
ned as
ClqCnt( )i I c i I c
c G
= × ≥
( )
∈
∑
( , ) | | 3
where G is a PSN graph, c ∈ G is a
clique, I(c, i) ∈ {0, 1} is the binary in-
dicator of whether clique c contains
node i, and I(|c| ≥ 3) ∈ {0, 1} is a bi-
nary indicator of whether the size of
clique c is at least three. This met-
ric reects the node’s centrality in its
local neighborhood, taking all the re-
lated nontrivial cliques (including the
nested ones) into account. We follow
the convention in clique-based social
network analyses of ignoring cliques
of size one or two.
The betweenness centrality is the
percentage of shortest paths going
through node i out of all possible
paths. A high score in this measure
means that the corresponding person
IS-25-04-Yang.indd 14 12/07/10 1:47 PM
JULY/AUGUST 2010 www.computer.org/intelligent 15
is a contact point between different
social groups.
BetCent( )i
j j i
k k
=
− −
= ≠
= ≠
∑
1
1 2
1
1
( )( )
,
,
| | | |
| |
V V
V
jj k i
jk
jk
i
,
( )
≠
∑
| |V
σ
σ
where s
jk
is the number of all-
pairs shortest paths going through j
and k (from j to k), and s
jk
(i) is the
number of all-pairs shortest paths
going through j and k via i. This met-
ric has been used in social network
analysis.
3
PageRank is a popular method
in link-analysis research. We use
it to induce a global measure of im-
portance for email contacts. It is
recursively de ned, taking the tran-
sitivity of popularity into account.
Let us use an N-by-N matrix X
to represent email connections
among N contacts in a personal
email data set and de ne the matrix
elements as
X
ij
ij
j
n
ij
n
n
=
′
=
′
∑
1
where n
ij
is the count of messages
from i to j. Let U be a matrix with el-
ements that have an identical score of
1/N and de ne a linear combination
of X and U as E = (1 − a) X + aU)
T
0 < a < 1.
Use an N × 1 vector r (the Page-
Rank vector) to store the impor-
tance scores of the N contacts, and
set the initial values of its elements to
be 1/N. Then update this vector iter-
atively: r
(k+1)
= Er
(k)
. The vector con-
verges to the principal eigenvector of
matrix E when k is suf ciently large.
The stationary vector contains one
Page Rank score per contact in a per-
sonal email data set.
We call all these metrics the so-
cial importance (SI) features of email
messages. That is, we represent the
sender of each message in a personal
email data set using the automati-
cally extracted SI features, in addi-
tion to the sender ID. The enriched
sender representation is a part of
the message representation. These
features (together with other mes-
sage features) are weighted by SVM
classi ers, based on how informa-
tive they are in making priority
predictions.
Semisupervised Learning of
Social Importance Features
Semisupervised SI features are those
we induce based on both the user-
assigned importance labels (in ve
levels) of training instances (mes-
sages) and the graphical structure of
email interactions in a personal email
data set. Typically, only a small sub-
set of the messages has importance
labels. We propose the Level-Sensitive
PageRank (LSPR) approach to propa-
gate labeled importance of the train-
ing examples to other messages and
connected users.
We de ne V as an N-by-5 matrix,
where rows represent users (indexed
by i = 1, 2, …, N), columns are for
importance levels (labeled as k = 1, 2,
3, 4, 5), and each cell is the number
of messages received by a user and at
the corresponding level. We further
normalize each column vector of the
matrix using the sum of all elements
in each column as the denominator to
normalize each column element. The
normalized column vector v
k
shows
the proportions of the labels at level
k over users. Vector v
k
is sparse when
the user only labels a few instances at
level k in the training set.
Treating v
k
as the initial label dis-
tribution at level k over all users and
assuming labels are transitive from
user to user through their email
connections, we de ne the iterative
update of an LSPR vector as
p X p p
k
t
T
k
t
k
a a
( ) ( ) ( )
( )
+
= − +
1 1
1
(1)
In the rst term in the formula, ma-
trix X is the same as we de ned
earlier for PageRank. It represents
the transitional probabilities among
users based on unlabeled email inter-
actions. The second term in the for-
mula represents the supervised label
bias over users. Constant a ∈ [1, 0]
controls the balance between the two
terms in the iterative updating of the
LSPR vector. The vector converges to
the principal eigenvector of matrix
E
k
= (1 − a)X
T
+ a v
k
1
T
when t is suf-
ciently large.
6
The stationary LSPR
vector is denoted as p
k
, with elements
that sum to one, representing the ex-
pected proportion for each node to
have the importance labels at level k.
Applying this calculation to impor-
tance level k = 1, 2, 3, 4, and 5, we
obtain ve stationary vectors in ma-
trix P = (p
1
, p
2
, p
3
, p
4
, p
5
). The row
vectors of matrix P provide a 5D rep-
resentation. We use the LSPR row
vectors as additional features to rep-
resent each message, as the semisu-
pervised LSPR features of its sender.
The elements in matrix P are typi-
cally small when the number of
Our method leverages
the frequencies and
importance of messages,
while conventional link-
analysis methods use only
one type of directed link.
IS-25-04-Yang.indd 15 12/07/10 1:47 PM
16 www.computer.org/intelligent IEEE INTELLIGENT SYSTEMS
S O C I A L L E A R N I N G
users (N) in the personal email net-
work is large. To make the values of
LSPR features in a range comparable
with those of other features (such as
term weights and the values of unsu-
pervised SI features) in the enriched
vector representation of email mes-
sages, we renormalize each LSPR sub-
vector (5D) into a unit vector. That is,
we use the sum of the ve elements as
the denominator of each element in
the normalization.
Our formulae for LSPR are
algorithmically similar to those in
Topic Sensitive PageRank (TSPR) and
Personalized PageRank (PPR) meth-
ods, where a topic distribution is used
to represent the interest of each user
over webpages. In fact, the LSPR
method is inspired by the TSPR and
PPR work. However, in our method,
the graph structure is constructed us-
ing two types of objects (people and
messages), whereas the graph struc-
tures in TSPR and PPR (and in Page-
Rank) have only one type of node
(webpages). Our method also lever-
ages both the frequencies and impor-
tance of messages, while conventional
link-analysis methods use only one type
of directed link. More importantly, we
focus on effectively using a partially
labeled personal email network and
assume the transitivity of importance
among users is sensitive to the impor-
tance levels of messages exchanged
among these users.
Experiments
We recruited a set of subjects, mostly
from the Language Technologies In-
stitute at Carnegie Mellon University,
including faculty members, staff, and
graduate students. Each subject was
asked to label at least 400 nonspam
messages during a one-month period
using a ve-level scale. Only seven us-
ers actually labeled more than 200
messages, which we used as the col-
lected data for our experiments.
In each personal data collection,
we sorted the email messages tempo-
rally and split the sorted list into 70
and 30 percent portions. We used the
70 percent portion for training and
parameter tuning and the remaining
30 percent for testing. The full set of
training examples was used to induce
the NC and SI features. For LSPR,
we used all the messages in the train-
ing set to propagate 30, 60, 90, 120,
and 150 labels in the training set, re-
spectively. The average number of
training messages per user was 395
(with the maximum of 1,225 and the
minimum of 164); the average num-
ber of test messages per user was 169
(with the maximum of 525 and the
minimum of 70).
Preprocessing
We applied a multipass preprocess-
ing to the email messages. First, we
applied email address canonicaliza-
tion. Because each person might have
multiple email accounts, it is neces-
sary to unify them before applying
social network analysis. For instance,
“John Smith”
edu, “John” , and
“John Smith”
might be the email addresses of the
same person. We used regular ex-
pression patterns and longest string
matching algorithms to identify email
addresses that might belong to the
same user. We then manually checked
all the groups and corrected the er-
rors in the process. We also applied
word tokenization and stemming us-
ing the Porter stemmer; we did not
remove stop words from the title and
body text.
Features
The basic features (BF) are the tokens
in the From, To, CC, Title, and Body
Text sections in email messages. We
used a vector to represent those fea-
tures for each email message with a
dimension v, the vocabulary size,
which we call the BF subvector.
We used an m-dimensional subvec-
tor to represent the NC features for
each email message’s sender, where m
is the number of clusters produced by
the clustering algorithm based on the
user’s personal social network. An el-
ement of the subvector is 1 if the user
belongs to the corresponding cluster
and 0 otherwise; each user can be-
long to only one cluster. If the sender
of a message in the test set is not in
the training set, he or she is assigned
to a default cluster. We calculated the
sum of the importance values of mes-
sages in each cluster and used it as the
cluster’s importance value. The clus-
ter with the median importance value
is the default cluster.
We also used another 7D subvec-
tor to represent the SI features per
user, with real-valued elements, and a
5D subvector to represent each user’s
LSPR features, with elements that are
the mixture weights of the user at the
ve importance levels. If the sender of
a message in the test set was not in
the training set, the LSPR subvector
of this message was assigned to the
mean of LSPR vectors by default.
The concatenation of all these sub-
vectors yields a synthetic vector per
email message as its full representation.
Classifiers
We used ve linear SVM classiers
to predict the importance level per
email message. Each classier takes
each message’s vector representation
as its input and produces a score with
respect to a specic importance level.
The importance level with the highest
score is taken as the predicted impor-
tance level by our system for the cor-
responding input message. We used
the standard SVM
light
software pack-
age ().
We ran the SVM classiers with
messages represented using the BFs
IS-25-04-Yang.indd 16 12/07/10 1:47 PM
JULY/AUGUST 2010 www.computer.org/intelligent 17
only as the performance
baseline. We also ran
the SVM classiers with
additional features, in-
cluding the unsupervised
SI features, the NC fea-
tures, and the semisu-
pervised LSPR features.
We named the baseline
system SVM.BF and the
system using the combi-
nation of all the feature
types SVM.BF+. We var-
ied the number of labeled
messages used in train-
ing the SVM classiers
from 30 to 150 labeled
messages per user and
measured the system per-
formance under these con-
ditions. All the training-
set sizes are relatively
small, compared to large
data collections used in
benchmark evaluations
for text categorization—
for example, the RCV1
news story collection has
780,000 training exam-
ples for 103 categories.
This is part of the dif-
culty we must deal with
for PEP.
Metrics
We used mean absolute error (MAE)
as the main evaluation metric, which
is standard in evaluating systems that
produce multilevel discrete predic-
tions. MAE is dened as
MAE = −
=
∑
1
1
/ | |N y y
i
N
i i
ˆ
where N is the number of messages in
the test set, y
i
is the true importance
level of message i, and
ˆ
y
i
is the pre-
dicted importance level for that mes-
sage. Because we have ve levels of im-
portance, the MAE scores range from
0 (best) to 4 (worst).
There are two conventional ways
to compute the performance average
over multiple users. The rst, micro-
averaged MAE, involves pooling the
test instances from all users to ob-
tain a joint test set and computing
the MAE on the pool. The other way,
macro-averaged MAE, is to com-
pute the MAE on the test instances
of each user and then take the aver-
age of the per-user MAE values. The
former gives each instance an equal
weight and tends to be dominated by
the system’s performance on the data
of users who have the largest test sets.
The latter gives each user an equal
weight. Both methods can be infor-
mative, so we present the evaluation
results in both variants of
the metric.
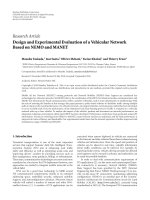
Results
Figure 1 shows the per-
formance of SVM.BF and
SVM.BF+ conditioned on
varying training-set sizes
of 30 to 150 labeled mes-
sages. Adding the social-
network based features
(SI, NC, and LSPR) sig-
nicantly reduced the im-
portance prediction errors
in both micro- and macro-
averaged MAE. We con-
ducted Wilcoxon signed-
rank tests to compare the
results of SVMs using only
BF features versus using the
additional features. The p-
values in these conditions
are below 1 percent except
in one case, when the train-
ing-set size is 60 and the
p-value is 5 percent. These
results strongly support
the advantage of leveraging
the social-network features
in combination with con-
tent-based features over the
baseline approach.
Parameter Tuning
We tuned two parameters per user on
held-out validation data: the margin
parameter C in SVM, which controls
the balance between training-set er-
rors and model complexity, and the
parameter a in LSPR, which balances
the two terms in Equation 1. We split
each user’s training set into 10 sub-
sets and repeated a 10-fold cross vali-
dation procedure: using one subset
for validation and the union of the re-
maining subsets for training the SVM
with a specic value of C, or running
LSPR with a specic value of a.
We repeated this procedure on 10
validation subsets, with the C values
Figure 1. Performance of support vector machines (SVMs) in
(a) micro-averaged mean absolute error (MAE) and (b) macro-
averaged MAE. The MAE ranges from 0 to 4, where a lower value
means better performance. Results from the baseline system
(SVM.BF) and the system using the combination of all the feature
types (SVM.BF+) strongly support the advantage of leveraging
the social-network features in combination with content-based
features over the baseline approach.
30 60 90 120 150
0.65
0.70
0.75
0.80
0.85
0.90
0.95
Macro-averaged MAE
30 60 90
No. of labeled examples used to train the SVMs
No. of labeled examples used to train the SVMs
120 150
0.65
0.70
0.75
0.80
0.85
0.90
(a)
(b)
Micro-averaged MAE
SVM.BF+
SVM.BF
SVM.BF+
SVM.BF
IS-25-04-Yang.indd 17 12/07/10 1:47 PM
18 www.computer.org/intelligent IEEE INTELLIGENT SYSTEMS
S O C I A L L E A R N I N G
in the range from 10
−3
to 10
3
, and
the values in the range from 0.05 to
0.25. The value of each parameter
that yielded the best average perfor-
mance on the 10 validation sets was
selected for evaluation on the test set
of each user. We found the system’s
performance relatively stable (with
small variance) with the settings of
a ∈ [0.05, 0.25] and C ∈ [1, 1,000].
Computational Efficiency
The computational cost consists of
several parts:
1. unsupervised NC clustering and
SI-feature induction,
2. semi-supervised induction of LSPR
features,
3. supervised training of SVM clas-
siers (5 per user), and
4. online construction of NC, SI,
and LSPR features for new send-
ers in the test set but not in the
training set, and priority predic-
tion on test messages.
Parts 1 through 3 belong to the off-
line training and validation phase,
and part 4 belongs to the online
testing phase performed for each in-
stance. We measured the CPU time
on an Intel Xeon 3.16-GHz proces-
sor in training and testing over the
data set of one user (who has the larg-
est data set). Part 1 took 12 seconds,
part 2 took 6.7 seconds, and parts 3
and 4 took under a second each.
Because the data sets were rela-
tively small, computational cost was
not an issue in our experiments. In
future applications of our method,
the training data from some users
could grow much larger; in that case,
sampling from the available training
data is a potential solution for ef-
cient computation. For example, we
could use the most recent few hun-
dred (or thousands) of messages for
updating the features and classiers
periodically ofine (once a day or
once a week as needed).
O
ur experiments demonstrate
the effectiveness of our pro-
posed approach on personal email
data from multiple users. Future
work would include collecting more
data and comparative studies on dif-
ferent clustering, graph mining, and
classication algorithms with respect
to PEP.
Acknowledgments
This work is supported, in part, by DARPA
under contract NBCHD030010; the US
National Science Foundation (NSF) under
grant IIS_0704689; and the Brain Korea 21
Project, the School of Information Technol-
ogy, KAIST. Any opinions, ndings, conclu-
sions, or recommendations expressed in this
material are those of the authors and do not
necessarily reect the views of the sponsors.
This article is an extended version of an
earlier report published in ACM SIGKDD
2009.
2
References
1. L.A. Dabbish and R.E. Kraut, “Email
Overload at Work: An Analysis of
Factors Associated with Email Strain,”
Proc. 20th Anniversary Conf. Computer
Supported Cooperative Work, ACM
Press, 2006, pp. 431–440.
2. S. Yoo et al., “Mining Social Networks
for Personalized Email Prioritization,”
Proc. 15th ACM SIGKDD Conf.
Knowledge Discovery and Data Min-
ing, ACM Press, 2009, pp. 967–976.
3. J.R. Tyler, D.M. Wilkinson, and B.A.
Huberman, “Email as Spectroscopy:
Automated Discovery of Community
Structure within Organizations,”
Communities and Technologies,
M. Huysman, E. Wenger, and V. Wulf,
eds., Kluwer, 2003, pp. 81–96.
4. A. Clauset, M.E.J. Newman, and C.
Moore, “Finding Community Structure
in Very Large Networks,” Physical
Rev. E, vol. 70, no. 6, 2004,
pp. 066111-1–066111-6.
5. P.O. Boykin and V.P. Roychowdhury,
“Leveraging Social Networks to Fight
Spam,” Computer, vol. 38, no. 4, 2005,
pp. 61–68.
6. T. Haveliwala, S. Kamvar, and G. Jeh,
An Analytical Comparison of Ap-
proaches to Personalizing Pagerank,
tech. report, Stanford Univ., 2003.
T H E A U T H O R S
Yiming Yang is a professor in the Language Technologies Institute and the Machine
Learning Department in the School of Computer Science at Carnegie Mellon Univer-
sity (CMU). Her research centers on statistical learning methods for a range of prob-
lems, including large-scale text categorization, relevance- and novelty-based retrieval
and adaptive ltering, personalization and active learning for recommendation systems,
and personalized email prioritization. Yang has a PhD in computer science from Kyoto
University. Contact her at
Shinjae Yoo is a research associate at the Brookhaven National Laboratory. His current
research interests include statistical learning approaches to personalized email prioritiza-
tion, text mining, and heterogeneous network analysis. Yoo has a PhD in language tech-
nologies from the School of Computer Science at Carnegie Mellon University. Contact
him at
Frank Lin is a PhD student in the Language Technologies Institute at CMU. His current
research interests include graph-based clustering and semisupervised learning and how
these methods can be efciently applied to general large-scale data. Lin has an MS in lan-
guage technologies from the School of Computer Science at Carnegie Mellon University.
Contact him at
Il-Chul Moon is a postdoctoral researcher in the Department of Electrical Engineering at
the Korea Advanced Institute of Science and Technology. His research interests include
social-network analysis, agent-based simulation and counterterrorism, defense model-
ing, and simulation. Moon has a PhD in computation, organization, and society from
Carnegie Mellon University. Contact him at
IS-25-04-Yang.indd 18 12/07/10 1:47 PM