The Relationship Between Bank and Interbank Interest Rates during the Financial Crisis: Empirical Results for the Euro Area pptx
Bạn đang xem bản rút gọn của tài liệu. Xem và tải ngay bản đầy đủ của tài liệu tại đây (1.42 MB, 36 trang )
The Relationship Between Bank and Interbank Interest Rates
during the Financial Crisis: Empirical Results for the Euro Area
David Aristei
and Manuela Gallo
1
Abstract
In this paper we use a Markov-switching vector autoregressive model to analyse the
interest rate pass-through between interbank and retail bank interest rates in the
Euro area during the financial crisis. Empirical results, based on monthly data for
the period 2003(1)-2011(9), show that during periods of financial turmoil all the
rates considered show a reduction of their degree of pass-through from the
interbank rate. Interest rates on loans to non-financial firms are found to be more
affected by changes in the interbank rate than loans to households, both in times of
high volatility and in normal market conditions.
Key Words: Interest rate pass-through, financial crisis, interbank interest rate;
loans interest rate; Regime-switching vector autoregressive models; Euro area.
JEL Classification: C32, E43, E58, G01, G21.
1
David Aristei, Department of Economics, Finance and Statistics, University of Perugia, via Pascoli, 20 – 06123
Perugia (Italy), e-mail:
Manuela Gallo, Department of Legal and Business Disciplines, University of Perugia, via Pascoli, 20 – 06123
Perugia (Italy), e-mail:
2
1. Introduction
The pass-through process from policy-controlled to retail bank rates is important for monetary
policy, both from the point of view of price stability and from the financial stability perspective.
Even if there are additional market and demand factors that affect the definition of bank rates, as for
example banking competition, size of banks, level of development of financial markets, and even
aspects affecting each single customer or credit transaction, interbank interest rates are one of the
main drivers of the rates charged by banks on loans.
The
interest rates set by Central Bank affect the interbank rates, which are the basis of the
process of defining the cost of money lent by banks to their customers, therefore they have effects
on the behaviour of borrowers and consequently on the real economy. On the other hand, prices set
by banks influence their profitability and soundness and thus the financial stability (De Bondt
2005). It is clear that banks play an important role in the transmission of monetary policy, especially
in the Euro area, where borrowers rely more heavily on the banking systems to raise funds (Blot and
Labondance 2011). Borio and Fritz (1995, p. 3) argue that “bank lending rates are a key, if not the
best, indicator of the marginal cost of short-term external funding in an economy”.
The interest rate transmission channel has become particularly important in the context of the
financial crisis. During the current financial turmoil, monetary authorities have repeatedly cut
interest rates charged in order to provide liquidity in the financial system, facilitating the solvency
of banks and supporting the confidence of savers. However, the rigidity of interbank rates has
slowed the process of transfer of monetary policy impulses to the real economy. In fact, while there
has been a substantial reduction in market yields, on the other, at least in the short term, the pricing
of bank loans has not been characterized by an equally evident decrease. The presence of strong
information asymmetries has created a panic in financial markets and reduced the net financial
wealth of the banks and borrowers, reducing the effectiveness of monetary policies. Also
expectations influence significantly the effectiveness of all other channels of monetary policy
transmission to the extent that central bank policy is anticipated by the market and priced into the
yield curve (Gaspar et al., 2001). Several factors, like the degree of central bank credibility,
predictability of central bank actions, and commitment by the central bank to vary its instrument
consistently, can enhance the role of the expectations channel (Stavrev et al., 2009).
During the period from January 2003 to September 2011, the official rates underwent a
considerable fall,
gradually followed by interbank rates, which, nevertheless, continued to
incorporate the manifested distrust among intermediaries.
3
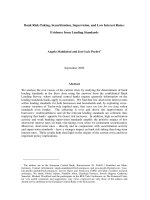
Figure 1 presents the pattern of the key Central Bank interest rates, together with the Euro Over
Night rate (EONIA)
2
. The Figure shows that the interest rate on main refinancing operations
3
has
reached historic lows, surpassing even the minimum of 2% reached in 2003: this fact demonstrates
the will of the Central Bank to provide liquidity at exceptionally low costs, in order to support the
banks and the process of financing of the real economy.
Figure 1 - Euro Over Night rate (EONIA) and Key ECB interest rates (January 2003-September 2011)
!
Notes: EONIA= Euro Over Night interest rate; DF = Deposit Facilities; Mlf = Marginal lending facility;
Mro = Main refinancing operations.
Data Source: European Central Bank
The increase in the cost of borrowing among banks, measured by EURIBOR
4
(Figure 2),
throughout 2007 and much of 2008, led the European intermediaries to demand increasing levels of
liquidity to the Central Bank, while the decrease in interbank interest rate, suffered during the last
months of 2008, has reduced the use of the operations with ECB (Figure 3) for the first six months
of 2009. The deposit facilities and main refinancing operations
5
began to grow again in the summer
of 2009 and, after a short process of reduction, even in the month of June 2010 and October 2011,
2
The EONIA is the benchmark interbank reference value and is derived by the European Central Bank on the basis of
interest rates applied to the overnight transactions in Euros between banks. Usually it ranges in the corridor between the
rate on marginal lending facility and the interest rate on deposits facilities.
3
The European Central Bank, on its own initiative, aims to provide liquidity to the banking system by means of the
main refinancing operations (MRO). The interest rate applied to such operations is therefore the main instrument to
transfer impulses of monetary policy to the financial system.
4
The EURIBOR is calculated daily for interbank deposits with a maturity of one week and one to 12 months as the
average of the daily offer rates of a representative panel of prime banks, rounded to three decimal places.
5
The operations of marginal lending facilities (MLF) and of deposit facilities (DF) are two standing facilities: the first
to obtain overnight liquidity from the central bank, against the presentation of sufficient eligible assets; the second to
make overnight deposits with the central bank. The interest rates paid on these operations feel the effects of the MRO
rate, placing below and above this respectively.
4
in correspondence of economic and political tensions that some countries (Greece, Ireland, Italy)
experienced at these times and also in correspondence of the crisis of some financial intermediaries
(for example Dexia, MF Global). These processes confirm the status of mistrust among the
intermediaries and the perpetuation of the conditions of financial crisis.
Figure 2 - EURIBOR 3 months and EONIA rate (January 2003-September 2011)
!
Data Source: European Central Bank
Figure 3 - Open market operations (Mro) and Standing facilities
(millions of Euros, January 2003-September 2011)
!
Data Source: European Central Bank
5
In September 2008, the bankruptcy of the U.S. investment bank Lehman Brothers has triggered a
growing loss of confidence among the operators, which produced a significant rise in yields on the
interbank money market, demonstrating the increased credit risk in the interbank market.
Figure 2 shows that the 3 months EURIBOR has reached its maximum (5.393%) in October
2008, while the EONIA has scored the highest value (4.469%) a few days after the failure of
Lehman Brothers.
The higher cost of money on the interbank market has triggered a liquidity crisis and an
increasing risk of failure for a number of intermediaries. Immediately, many governments have
tried to avoid that the situation of distrust among depositors could evolve in a systemic crisis, by
offering guarantees to depositors and nationalizing, in some cases, the banks most exposed to the
risk of failure. Because of these choices, in early 2009, the difference between ECB rates and
interbank rates has attenuated; these spreads have started to grow during the last year, driven by a
new phase of the financial crisis, which now begins to affect the sovereign states in UE (Figure 4).
Figure 4 - Spreads Mro-EONIA and Mro-EURIBOR (January 2003-September 2011)
!
Data Source:
The financial crisis has highlighted the importance of the inter-bank market for wholesale
funding, which saw a decline in the volume of lending and an increase in spreads over the implied
official rates at comparable maturities. This shows a changing in the nature of bank funding that
leads us to formulate questions about the relationship between interest rates in wholesale and retail
markets (Banerjee et al., 2010).
In fact, the financial situation has immediate repercussions on the real economy, as it affects
granting and pricing of loans to firms and households. The price of bank loans is a key factor in
6
determining final demand and consequently inflation in an economy (Kwapil and Scharler, 2006,
2010). Figure 5 attests a distinct change in the amount of (new business) loans since the last quarter
of 2008. While the official rates decreased, the cost of financing the real economy continued to rise,
at least until January 2009. These costs have fallen steadily over the following months, until the
autumn of 2009, most significantly for the operations of shorter duration, and slowly began to rise
again since the mid-2010.
So we can se that there has been, and it is still occurring, an impediment or a slowdown in the
transmission process of monetary policies, which must be identified and controlled in order not to
frustrate the attempts of monetary authorities.
Figure 5 - Households loans and Non financial corporations loans
(stocks in millions of Euros, January 2003-September 2011)
!
Data Source: European Central Bank
The aim of this paper is to study how the financial crisis has affected the interest rate
transmission mechanism for the Eurozone between market rates and bank interest rates
and to trace
the features related to the current financial crisis.
The main results of this investigation are that interest rates on loans to non-financial firms are
more affected by changes in the interbank rate, than loans to households, both in times of crisis and
in normal market conditions, even the speed of adjustment in long-term is greater in turmoil
periods. Moreover, during the crisis all rates reduce their responsiveness to the interbank rate.
The remainder of the paper is organized as follows. Section 2 provides a short review on the
literature related to the bank interest pass-through. Section 3 presents the data and Section 4
7
illustrates the econometric methodology. In Section 5 we present the main empirical results,
whereas Section 6 offers some concluding remarks.
!
2. Overview of the literature and research questions
The economic literature on the mechanisms of transmission of monetary policy impulses through
the bank interest rates in the Eurozone is based on different theoretical and methodological
approaches. It is applied to single different countries (Harbo et al., 2011; Ozdemir, 2009; Jobst and
Kwapil, 2008; Gambacorta and Iannotti, 2007; Coffinet, 2005; Humala, 2005; De Graeve et al.,
2004; Horváth et al., 2004; Weth, 2002; Cottarelli and Kourelis, 1994), or to the Eurozone as a
whole (De Bondt, 2005; ECB, 2009; Blot and Labondance, 2011; Antao, 2009; De Bondt, 2002)
and focuses on different periods of time. For the aims of our analysis, we are particularly interested
in studies that dwell on the effects of financial crisis (Blot, Labondance, 2011; Harbo et al., 2011;
Karagiannis et al., 2010; Jobst and Kwapil 2008). Moreover, several econometric approaches are
used to analyse interest rate pass-through
6
:
• Univariate and Vector Autoregressive (VAR) models (De Bondt, 2002 and 2005; Sander and
Kleimeier, 2004);
• Error Correction Models (univariate ECM or Vector Error correction model – VECM) (see
for example: Horváth et al., 2004; De Graeve et al., 2004; De Bondt, 2005; Marotta, 2009);
• Panel Seemingly Unrelated Regression, SUR-ECM (see for example: Sorensen and Werner,
2006; Blot and Labondance, 2011);
• Univariate and multivariate non-linear models (i.e. regime switching), used to account for the
presence of important discrete economic events, that would distort econometric inference if it
not capture in model (Dahlquist and Gray, 2000; Humala, 2005; Hendricks and Kempa, 2008).
All these different elements do not allow to reach a clear conclusion on the degree of pass-through,
but it is always possible to find points of common reflection. In the short run, lending rates are
sticky and so the degree of pass-through is less than one; in the long run the degree of pass-through
is higher and, in some cases it may be complete (Cottarelli and Kourelis, 1994; Borio and Fritz,
1995; Kleimeier and Sander, 2000 and 2002; Donnay and Degryse, 2001; Toolsema et al., 2001;
Gambacorta, 2008). The adjustment of retail rates to changes in money market rates does need
some time and does not occur instantaneously, as the immediate pass-through is smaller than the
long-term pass-through (Kwapil and Scharler, 2006).
6
A complete description of these different econometric techniques is given in Section 4.
8
The heterogeneities in the degree of pass-through are related to the legal and financial structures
(Cottarelli and Kourelis 1994; Cechetti, 1999; Mojon, 2001; Lago-González and Salas-Fumás 2005)
or to the legal and cultural differences (Sander and Kleimeier, 2004).
The transmission of monetary policy is also influenced by banks’ characteristics (Weth, 2002;
Affinito and Fabullini, 2006), by the size of banks and their liability structure (Cottarelli et al.,
1995; Weth 2002, Bistriceanu 2009). The health of banks is one of these characteristic according to
Van den Heuvel (2002), who demonstrates that the effect of monetary policy may be smaller when
banks are constrained by regulatory requirements; even if monetary policy is eased, bank cannot
expand credits since they can hardly raise new equity. The author, by examining how bank capital
and its regulation affect the role of bank lending in the transmission of monetary policy, argued that
an expansionary monetary policy would alleviate the capital constraint by improving bank profits.
The size and the dynamics of the effect are highly dependent on the initial level and distribution of
capital among banks. Intuitively, the reason is that the capital requirement affects bank behaviour
more when bank equity is low. Gambacorta (2008) showed that heterogeneity in the banking rates
pass-through depends on liquidity, capitalization and relationship lending, but it exists only in the
short run.
Adapting to changes in official interest rates may be delayed due to the presence of agency costs
and customer switching costs (Fried and Howitt, 1980; Stiglitz and Weiss, 1981; Berger and Udell,
1992; Klemperer, 1987; Calem et al., 2006)
The heterogeneities in the degree of pass-through are related to the presence of structural breaks
and discrete economic events (Hofmann, 2006; Sander and Kleimeier, 2004; Vajanne, 2007;
Marotta, 2009; Blot and Labondance, 2011). Heterogeneity in adjustments is also found to be linked
to menu costs and key financial ratios under managerial control (Fuertes and Heffernan, 2009).
The presence of several episodes of financial crises alters the speed and degree of response to
shocks in the interbank rate (Humala, 2005; Stavrev et al., 2009; Blot and Labondance, 2011;
Panagopoulos and Spiliotis, 2011). This last aspect is of particular interest for the purposes of our
analysis: it shows that under normal financial conditions short-run stickiness is higher for those
rates on loans with higher credit risk. But when there is a high-volatility scenario, the pass-through
increases considerably for all interest rates (Humala, 2005). Blot and Labondance (2011), in a panel
cointegration analysis, demonstrate that the heterogeneity between the Eurozone countries in the
degree of interest rate pass-through has increased after the financial crisis. Kato et al. (1999) have
shown monetary policy becomes less effective as borrowers' net worth decreases: they find that the
effectiveness of expansionary monetary policy in the 1990s in Japan has been weakened by the
deterioration of borrowers' balance sheets, contributing to the long stagnation of the Japanese
9
economy during the period. Ritz (2010) shows that increased funding uncertainty: can explain a
more intense competition for retail deposits (including deposits turning into a “loss leader”), and
typically dampens the rate of pass-through from changes in the central bank’s policy rate to market
interest rates. These results may help in explaining some elements of commercial banks’ behaviour
and the reduced effectiveness of monetary policy during the 2007-2009 financial crisis. This
analysis also may help explaining why banks with a strong deposit base appear to have done better
throughout the recent financial crisis.
Stavrev et al., (2009) analyse the European Central Bank's (ECB's) response to the global financial
crisis. Their results suggest that even during the crisis, the core part of ECB's monetary policy
transmission -from policy to market rates- has continued to operate, but at a decreased efficiency.
The increase in interest rates on bank loans recorded during the financial crisis (Demyanyk and
Van Hemert, 2011) is connected not only to interest rate changes, but also to the losses suffered by
many banks. In this respect, Santos (2011) writes that banks that have experienced the greatest
losses during the crisis are the same ones that had the greatest difficulty in raising funds on the
interbank markets, and that suffer the most pressure from the market for improving their
performance. Gambacorta and Marques-Ibanez (2011) demonstrate how the 2007-2010 financial
crisis highlighted the central role of financial intermediaries’ stability in reinforcing a smooth
transmission of credit to borrowers. They show that bank-specific characteristics can have a large
impact on the provision of credit: factors, such as changes in banks’ business models and market
funding patterns, modify the monetary transmission mechanism. Banks with weaker core capital
positions, greater dependence on market funding and on non-interest sources of income restricted
the loan supply more strongly during the crisis period.
Our main research questions are therefore: 1) How the financial crisis has affected the
transmission process of monetary policy impulses to the real economy through the bank lending
channel?; 2) Do differences occur in the adjustment of bank rates to changes in interbank rates in
the short and long term?; 3) Have banks shown different behaviours in setting rates of households
and firms? Or in setting rates on loans of different amount?
To these aims, we use a Markov-switching vector autoregressive model to analyse interest the
relationships between bank interest rates and the money market rate (proxied by the three-month
EURIBOR) in the Eurozone for the period 2003(1)-2011(9), allowing for changes in the degree and
speed of pass-through in normal market conditions and during financial turmoil periods.
10
3. Data
Interest rates
7
for new loans on a monthly basis have been selected from the European Central
Bank database. The period considered is from January 2003 to September 2011 and the geographic
area taken into account is the Euro area (changing composition). The banks’ counterpart sectors and
the types of bank loans are:
• Households and non-profit institutions serving households
1. Loans for consumption (excluding revolving loans and overdrafts, convenience and
extended credit card debt); maturity: over 1 and up to 5 years; average of monthly
observations, in per cent per annum.
2. Lending for house purchase (excluding revolving loans and overdrafts, convenience and
extended credit card debt); original maturity: total; average of monthly observations, in per
cent per annum.
• Non-Financial corporations
1. Loans other than revolving loans and overdrafts, convenience and extended credit card debt,
Up to and including EUR 1 million; original maturity: total.
2. Loans other than revolving loans and overdrafts, convenience and extended credit card debt,
over EUR 1 million; original maturity: total.
The selection of the loans described above was performed to take into account the credit granted to
"Households" and "Non-financial Companies" sectors, which are likely to suffer exogenous changes
in interbank rates in a different manner, because of different bargaining power in dealing with banks.
The subdivision of loans to households in the two categories "Consumer credit, with duration between
1 and 5 years" and "Credit for house purchase "(without further distinctions in maturity) has been
done with the aim of combining the need to account for a minimum subdivisions of loans in this sector,
both in terms of maturity and of purpose, with the need not to overcomplicate the econometric analysis.
In addition, the distribution of loans to non-financial corporations was made solely on the basis of
the size of the credit granted, to telling loans to small and medium-sized firms apart from loans to
larger firms.
We use the three-month EURIBOR as a proxy for the policy-controlled rate: the official interest
rate cannot be used directly because of the ECB interest rate on the main refinancing operations
7
Interest rate data types are either the Annualized agreed rate (AAR) or the Narrowly defined effective rate (NDER). The
annualized agreed rate (AAR) is an interest rate for a deposit or loan calculated on an annual basis and quoted as an annual
percentage. The narrowly defined effective rate (NDER) reflects the annual costs of a loan in terms of the size of the loan,
possible disagios, maturity and interest settlements. This makes it possible to compare the costs of loans with identical
periods of interest rate fixation. No other costs related to the loan are taken into account. The NDER is the interest rate
which, on an annual basis, equalizes the present value of all commitments (deposits or loans, payments or repayments,
interest payments), future or existing, agreed between the bank and the household or non-financial corporation.
11
changes only infrequently (De Bondt, 2005; Kwapil and Scharler, 2006; Blot and Labondance,
2011). In the literature some empirical studies support the choice of using the EURIBOR as a proxy
for the official rate, while others studies use the EONIA. De Bondt (2005) demonstrates that EONIA
reflects relatively well official interest rate decisions and closely fluctuates around the ECB main
refinancing rate, so it may be considered as the best indicator of monetary policy, because it is more
related to changes in the expectation of official interest rates and less to liquidity issues. On the
other hand, Bernoth and Von Hagen (2004) find that the three-month EURIBOR is a good indicator
of monetary policy.
Our choice to use the EURIBOR rate instead of the EONIA rate derives from some
considerations that we try to summarize below.
Starting from the definition, the Euro overnight index average (EONIA) is a measure of the
effective interest rate prevailing in the Euro interbank overnight market, while the Euro interbank
offered rate (EURIBOR) is the rate at which a prime bank is willing to lend funds in Euros to
another prime bank. The first is a real interest rate, while the second is an offered rate. The EONIA
is therefore more sensitive to expectations about the ECB's official interest rates, while the
EURIBOR is the cost of interbank funding and depends on the expectations on banks' solvency. In
normal times, EONIA and EURIBOR rates move fairly together but with the financial market
turbulences, this relationship has been impaired (Blot and Labondance, 2011) (in this regard, see
Figure 2). Spread between EONIA and EURIBOR is driven by perceived credit and liquidity risk.
The three-month EURIBOR is the rate applied to most of the floating rate bank loans and so also
the principal element to which the cost of money for the real economy is related. In making our
assessments, we are also aware of the instability that characterizes the evolution of the EURIBOR
rate in recent months. It is due, among other things, to new fears of bank failures and to the decline
in the number of transactions in the interbank market (see Figure 2), which reduces the predictive
power of the rate.
From another point of view, the wholesale bank funding is also affected by the performance of
retail funding: the rising costs that banks are enduring for the short term funding (current accounts,
deposit accounts), but also for the long-term one (bond issues), affect the use of wholesale markets,
in the attempt to obtain the resources needed to manage liquidity.
What we are experiencing is definitely a very special time for making predictions on bank
lending rates: the EURIBOR is heavily influenced by the climate of mistrust among financial
intermediaries and, in turn, bank loan interest rates are also affected by numerous factors, including
a set of managerial determinants that cannot be ignored without risk of being considered superficial.
12
In this work we analyse the mechanism of pass-through from money market interest rate on bank
lending interest rate, investigating how banks adjust their rates in relation to external impulses. It is
not our intention, however, to analyse all the other factors that may exert an influence on the
determination of bank and interbank rates, which may be subject to further investigation. In any
case, the following factors can be considered particularly important for price-setting: the cost of
retail funding, which affects the use of the interbank market for wholesale funding; the level of
banks’ capitalization, which allows the most capitalized banks to be considered more reliable and
enables them to raise funds at lower costs, both in the retail and wholesale market; the liquidity
situation of bank, which affects its solvency and also the conditions for access to credit.
These aspects may affect the use of the interbank market and the formation of interbank interest
rates, limiting and, in some cases, blocking the effects of monetary policies. Such situations, in
which conventional monetary policies become constrained or ineffective despite the need for further
monetary easing, were described as liquidity traps by Keynes (1936).
Graphical analysis of time series shows a similar trend for all interest rates, except that of the
consumer credit, which has a more stable pattern over time and appears to be less influenced by
changes in the EURIBOR.
We may notice at least three critical points in the trend of these time series. The first, during the
first half of 2003, when the European Central Bank has cut official interest rates by 0.25 points on
March and by another 0.5 on June. As a result of these cuts the minimum bid rate on main
refinancing operations is placed at the 2.0%. The decisions were taken in a macroeconomic
environment characterized by a reduction in inflationary pressures, by the stagnation of the
productivity and progressively more uncertain prospects for recovery, in connection with the rising
international political tensions due to the war in Iraq and terrorist acts in Europe and the Middle East.
The second critical point is at the end of 2005 and early 2006, where, after a period of substantial
stability, interest rates go up again. In fact, European Central Bank has kept official interest rates
unchanged, in a context of uncertainty about the strength of economic recovery in the Euro area and
stability of inflation expectations. Since autumn 2005 there were signs of growth prospects and the
higher oil price was reflected in an acceleration in prices and an increase in expectations of inflation
over the medium term. As a result of this, ECB raised its official interest rates by a quarter
percentage point in December and the same rate in March 2006. The two following years were
characterized by continuous increases in official interest rates and consequently in interbank rates.
The last critical point is at the end of 2008, when the current financial crisis has forced Central
Bank to cut repeatedly interest rates. The wide spread uncertainty about possible defaults of
counterparties, after the collapse of the investment bank Lehman Brothers, has sent haywire
13
wholesale markets on which banks do fundraising. Central banks have made up for the block of
national interbank markets with liquidity injections with exceptional high amounts. On 8 October
2008, the ECB, the Federal Reserve, the Bank of England, the Bank of Canada, the Bank of Sweden
and the Swiss National Bank, with the support of the Bank of Japan, have carried out a coordinated
reduction in interest rates: an event never before happened. Further cuts also occurred in the
following months, when it became clear that the Euro area is in recession
8
.
Graphical analysis shows many of the aspects that will be highlighted later in this work: the
greater rigidity of the rate on consumer credit; the largest spreads charged on loans to firms of
smaller amount; the considerable increase in the spread of all rates, but particularly those on loans
to households and small and medium-sized enterprises.
Figure 6 – Evolution of EURIBOR and bank retail rates (January 2003-September 2011)
!
Data Source: European Central Bank
4. Econometric methods: a regime-switching approach to model interest rate pass-through
As discussed in the previous Section, empirical studies on interest rate pass-through have
provided a wide range of theoretical and methodological approaches to model monetary
transmission mechanisms (see Blot and Labondance (2011) for a survey on recent analyses). In
particular, the literature on bank interest rate pass-though has dealt with two issues: i) the analysis
of monetary policy transmission channels, by focusing on the measurement of the pass-through
8
See Bank of Italy (2003-2009).
14
degree from policy-controlled to short-term money market interest rates (first stage of the pass-
through process) and then to retail bank loans and deposits rates (second stage); ii) the analysis of
banks’ price-setting behaviour, mainly concerned with the market condition of the banking system.
Focusing on the transmission mechanism between changes in market interest rates and bank
rates, these two approaches appear to be highly related as they both base banks price setting
behaviour on the following marginal cost pricing model equation (de Bondt, 2002):
br = β
0
+ β
1
mr
(1)
where br is the price set by banks,
β
0
is a constant markup and mr is the marginal cost price proxied
by a comparable market interest rate and
β
1
measures the degree of pass-through. The coefficient
β
1
will be less than one if banks have some degree of market power and demand elasticity of bank
products, with respect to retail rates, is inelastic, resulting from the existence of switching costs and
asymmetric information costs. The choice of the market interest rate depends on the approach
adopted: studies focusing on banks’ price-setting behaviour and competition issues use market rates
at different maturities, with the aim of a better matching between rates (cost-of-funds approach),
while short-term money market rates (like interbank rates) are chosen as a driving rate when the
focus is on the transmission of monetary policy, since they are strongly related with policy-
controlled rates (monetary policy approach).
Based on the simple theoretical framework defined in (1), alternative specifications have been
proposed in the empirical literature. Traditionally, the pass-trough process has been analysed by
means of a simple single equation Autoregressive Distributed Lag (ARDL) model of bank interest
rates (Cottarelli and Kourelis, 1994):
br
t
= v + φ
j
br
t− j
j=1
j*
∑
+ γ
k
mr
t−k
k=0
k*
∑
+ ε
t
(2)
where br and mr are bank and market rates, respectively, and j* and k* indicates optimal lag
lengths. The intercept is represented by v and
γ
0
measures the degree of short-run pass-through: a
value of less than 1 for
γ
0
indicates a sluggish adjustment (i.e. bank rate stickiness). The coefficients
φ
j
and
φ
k
can be used to compute the long-run multiplier as:
β = γ
k
k=0
k*
∑
/ (1− φ
j
j=1
j*
∑
)
(3)
so that the long-run equation can be written as
br
t
= β
0
+ βmr
t
, where
β
0
is a constant term and with
full pass-through in the long run given by
β
0
= 1.
The basic model (1) is only valid if interest rate time series are stationary. When interest rates
series are integrated of degree 1, the model has to be estimated in first differences:
15
Δbr
t
= φ
j
Δbr
t− j
j=1
j*
∑
+ γ
k
Δmr
t−k
k=0
k*
∑
+ ε
t
(4)
This specification avoids spurious regression problems, but leads to a loss of information about
long-run relationships and is appropriate when br and mr are I(1), but not cointegrated. When
interest rates are I(1) and cointegrated, model (4) can be augmented by a lagged error correction
term ECT
t-1
, so that the following error correction (ECM) model can be formulated:
Δbr
t
= φ
j
Δbr
t− j
j=1
j*
∑
+ γ
k
Δmr
t−k
k=0
k*
∑
+ αECT
t−1
+ ε
t
(5)
where ECT measures the deviation from long-run equilibrium and can be obtained from the
estimated error of the cointegration regression:
br
t
= β
0
+ βmr
t
+ u
t
(6)
ECT
t-1
enters model (5) with its coefficient
α
reflecting the speed of adjustment to the long-run
equilibrium. The long-run multiplier either estimated from the cointegration vector (6) or can be
obtained as in (3), based on the coefficients of equations (2) or (4).
Interest rate pass-through can be also analysed in a multi-equation framework. By
simultaneously estimating multivariate autoregression (VAR) models, it is possible to allow for
endogeneity of both interest rates. In fact, the interbank rates, despite being closely influenced by
monetary policy interventions, could also be assumed as endogenous to the extent that central
banks’ actions are influenced by market forces, including the banking sector (Rocha, 2011). In the
single equation approach, as pointed out by Humala (2005), the presence of any possible feedback
into the market rate is completely disregarded and valuable information for the estimation of the
interest rate pass-through model can be lost. For these reason, several authors (de Bond, 2002;
Sander and Kleimer, 2004, 2006) have proposed multivariate generalization of the autoregressive
models so far considered. In particular, focusing on the bivariate extension of the stable model (2), a
stationary VAR of order p model can be formalized as:
y
t
= v + Π
i
i=1
p
∑
y
t−i
+ u
t
(7)
where y
t
is a two-dimensional vector of market and bank interest rates time series,
y
t
= [mr
t
,br
t
]
,
Π
i
are
2×2
matrices of parameters and
u
t
= [u
mr
t
,u
br
t
′
]
is a two-dimensional vector of Gaussian white-
noise processes with covariance matrix
Σ
,
u
t
NID(0,Σ
u
)
.
When the two interest series in y
t
are non-stationary in levels, but first-difference stationary (i.e.
y
t
is I(1)) there may be up to one linearly independent cointegrating relationship, which represents
the long-run equilibrium of the system, with the deviation from the long-run equilibrium (the
16
equilibrium term) measured by the stationary stochastic process
h
t
=
′
β y
t
(Engle and Granger,
1987). If the two series are indeed cointegrated, the VAR implies the following vector error
correction model (VECM):
Δy
t
= v + Γ
i
i=1
p−1
∑
Δy
t−i
+ Πy
t−1
+ u
t
(8)
where
Γ
i
= − Π
j
j=i+1
p
∑
are
2×2
autoregressive parameters matrices and
Π = Π
i
− I
i=1
p
∑
(where
I is the identity matrix) is the long-run impact matrix, whose rank r determines the number of
cointegrating vectors (Johansen, 1995). In the bivariate case,
Π
can be partitioned into the
2×1
vector
β
of the long-coefficients of the cointegration vector and a
2×1
vector
α
containing the
equilibrium correction coefficients:
Π = α
′
β
. In the case of no cointegration between the series
considered, the VECM in (8) simplifies into a first-difference stationary VAR (DVAR).
All the interest rate pass-through models so far considered assume that the relationships between
bank and market rates are symmetric and linear. Several studies (Kleimeier and Sander, 2006;
Payne and Waters, 2008; Wang and Thi, 2010; Rocha, 2011) have focused attention on the
existence of asymmetric adjustments of retail rates in response to deviations from equilibrium. Such
asymmetric adjustment patterns are modelled with threshold autoregressive models (Tong, 1983;
Enders and Syklos, 2001), where the equilibrium term is split either into its positive and negative
elements or into values above or below a certain non-zero threshold. These studies have provided
evidence supporting the hypothesis that the degree of interest-rate pass-through is associated with
an asymmetric price adjustment of retail bank products.
Despite the relatively broad empirical literature on asymmetric effects, only few studies have
explicitly dealt with the issue of stochastic regime shifts and non-linearities in pass-through models.
Interest rates time series, like many other economic and financial series, are characterized by
occasional jumps or structural changes in their levels or volatility, which are more frequent and
severe in periods of financial turmoil like the current global crisis. The presence of important
discrete economic events induces substantial nonlinearities in the stochastic process and distorts
inference if it is not appropriately modelled. All these concerns have led to considerable interest on
econometric models that can adequately capture nonlinearities arising from regime switches. In the
interest rate pass-through literature there are few studies attempting to deal with regime shifts in the
relationship between bank and market rates. Almost all these analyses adopt a deterministic
approach which consists in identifying (exogenously or endogenously) single or multiple structural
breaks in the series (Sander and Kleimeier, 2004; Marotta, 2009) and then modelling these shifts by
augmenting the empirical model with an appropriate set of dummy variables or by conducting split
17
sample analyses. This is the case, for example, of the recent studies by Blot and Labondance (2011)
and Panagopoulos and Spiliotis (2011), which analyse the effect of the current financial crises on
interest rate pass-through in the Eurozone by separately estimating error correction models for the
periods before and during the crisis, assuming that the turmoil period starts in the last months of
2007 and the beginning of 2008, respectively. However, when the regime shifts are stochastic rather
than deterministic both previous approaches can lead to biased, or at least inefficient, results
(Krolzig et al., 2002; Clarida et al., 2006). In these cases, a multivariate generalization of the
univariate Markov-switching (MS) model originally proposed by Hamilton (1989) represents a
viable alternative to allow behavioural changes by introducing the possibility of stochastic changes
of regime. In the interest rate pass-through literature, the study by Humala (2005) represents, to the
best of our knowledge, the only analysis employing multivariate Markov-switching models to
assess the effects of financial crises on the transmission mechanism.
The basic idea behind the class of MS models is that the parameters depend upon a stochastic,
unobservable regime indicator variable
s
t
∈{1, , M }
, which generating process is an ergodic M-
state Markov chain governed by the transition probability:
p
ij
= Pr(s
t+1
= j | s
t
= 1), p
ij
= 1
j=1
M
∑
∀i, j ∈{1, , M}
(9)
The regime indicator s
t
is a variable that the researcher does not observe and has to be inferred
conditional on available information, together with the parameter estimates.
Extending the bivariate VAR(p) model (7) in order to allow the variance–covariance matrix of
the errors, the intercept term of the multivariate process and the autoregressive coefficients to
switch endogenously between possible regimes, we obtain the following M-regime pth-order
Markov-switching autoregressive (MS(M)-VAR(p)) model:
y
t
= v(s
t
) + Π
i
(s
t
)
i=1
p
∑
y
t−i
+ ε
t
(10)
where
v(s
t
)
is the intercept term and
Π
i
(s
t
)
are autoregressive parameter matrices, all assumed to
be regime-dependent, and
ε
t
is the error term with variance allowed to change across states (i.e.
ε
t
| s
t
NID(0,Σ
ε
(s
t
))
). Following Krolzig (1997), MS-VAR allows for a variety of specifications
and it can be considered as generalizations of the basic finite order VAR model. In particular, model
(10) represents the most general specification, as it allows all the parameters and the variance to
vary between each state s
t
of the Markov chain, and can be referred to as Markov-switching
Intercept Autoregressive Heteroskedastic VAR (MSIAH(M)-VAR(p))
9
.
9
Less flexible nested specifications allows only the intercept (MSI-VAR) or the intercept and the variance (MSIH-
VAR) to be regime-dependent.
18
Analogously, the bivariate cointegrated pass-through model (8) can be extended to be regime-
dependent, obtaining a Markov-switching VECM of the form:
Δy
t
= v(s
t
) + Γ
i
(s
t
)
i=1
p−1
∑
Δy
t−i
+ α(s
t
)
′
β y
t−1
+ ε
t
(11)
where,
Γ
i
(s
t
)
are autoregressive parameter matrices and
α(s
t
)
is a matrix of adjustment
parameters, all assumed to be state dependent,
β
is the vector of long-run parameters, and
ε
t
is
again the error term assumed to change across regimes.
The MS-VECM can be estimated by means of a limited information approach, using a two-stage
maximum likelihood procedure (Krolzig, 1997). In the first stage, the cointegration properties of the
model can be analysed by applying Johansen’s (1995) maximum likelihood procedure to test for the
presence of cointegration in the system and to estimate the cointegrating parameters
β
. The use of
the conventional Johansen procedure in the first stage, by adopting a finite-order VAR
approximation of the underlying data generating process, is legitimate without modelling the
Markovian regime shifts explicitly (Clarida et al., 2006). In the second stage, conditional on the
estimated cointegration vector, the remaining parameters of the model can be estimated by
implementing the Expectation-Maximization (EM) algorithm discussed in Hamilton (1990).
Within this setting, the relationships between bank and money market (interbank) interest rates
would shift stochastically between regimes, associated with periods characterized by different
economic conditions (i.e. high or low volatility, recession or expansion, etc.). In this respect, the
Markov-switching framework significantly differs from the threshold (asymmetric) approach to
interest rate pass-through: the former accounts for the existence of switching regimes, governed by
a stochastic process, which modify the transmission mechanism between market and retail interest
rates, while the latter assumes that changes in the degree of pass-through happen under certain
values of a deterministic model of regime switching
10
. In particular, such studies model non-linear
and asymmetric adjustments depending on the size and sign of deviations of bank rates from their
equilibrium relationship with respect to the interbank rate, with regime-shifts occurring once
deviations exceed a predetermined threshold. For the aim of the present study, which mainly
focuses on testing for the presence of heterogeneities in the degree of interest rate pass-through caused
by financial distress episodes and increases in rates’ volatility, a Markov switching autoregressive
model seems to be more appropriate as it exhibits non-linearity over time and endogenously separates
regimes arising from the probabilistic process of an unobservable state variable.
10
Clarida et al. (2006) attempt to integrate the two approaches by proposing an asymmetric MS-VECM of interest rates term
structure, which allows for both endogenous regime switching and threshold asymmetries. Their model, however, allows only
intercept and variance to be regime dependent and does not fully capture parameters heterogeneity between regimes.
19
5. Empirical results
In this Section we apply a Markov-switching vector autoregressive model to analyse interest rate
pass-through between alternative retail interest rates and money market interest rate (proxied by the
three-month EURIBOR rate) in the Euro zone, using monthly data for the period 2003(1)-2011(9).
Firstly, we investigate the univariate properties of the interest rates series by testing for the presence of
unit roots. Secondly, we investigate the cointegration properties of the system. In both the analyses we
explicitly deal with the sensitiveness of unit root and cointegration tests in the presence of structural
breaks. Finally, the results of the bivariate MS-VECM with two regimes are presented and discussed.
5.1 Unit roots tests
As a starting point of our empirical strategy, we test for evidence of non-stationary behaviour of
each interest rate time series considered by employing alternative testing procedures. In particular,
we analyse the behaviour of series in levels and first differences by means of the Augmented
Dickey-Fuller (ADF) (Dickey and Fuller, 1979) and the Dickey-Fuller-Generalized Least Squares
(DF-GLS) (Elliott et al., 1996) unit root tests and Kwiatkowski-Phillips-Schmidt-Shin (KPSS)
stationarity test (Kwiatkowski et al., 1992). The range of unit root tests is completed by the
Clemente-Montañés-Reyes (CMR) (Clemente et al., 1998) unit-root test that allow for a structural
break in the series. A well known problem in the unit root literature is, in fact, its potential
confusion of structural breaks as evidence of non-stationarity and the resulting possibility for a series
which exhibits structural shifts to fail in rejecting the unit root null. In the present application, in order
to account for the dramatic shift in all the interest series analysed at the end of 2008, we allow for the
presence of a single breakpoint in the series, identified by means of a grid-search technique, assuming
a gradual adjustment of the series following the break (innovational outlier, IO, model).
Results of the battery of tests considered are presented in Table 1. As it can be noticed, all the
unit root tests considered lead to an unambiguous acceptance of the null hypothesis of unit root for
all the series in levels and a rejection for the series in first-differences, providing evidence of an I(1)
(difference stationarity) behaviour. The results of the CMR unit root test with one structural break
(identified for all the five series in September 2008) support the non-stationarity in levels of the
interest rates series even after controlling for the structural shift. Finally, the KPSS test further
confirms the order of integration of the series, excluding the possibility of fractional integration.
20
Table 1 – Unit root tests
EURIBOR
Consumer
Mortgage
Firms (up to 1M€)
Firms (over 1M€)
Levels
First diff.
Levels
First diff.
Levels
First diff.
Levels
First diff.
Levels
First diff.
a) Unit root tests
ADF
-1.720
-4.183*
-2.305
-11.422*
-1.628
-4.679*
-1.868
-4.274*
-1.405
-5.791*
(0.418)
(0.001)
(0.173)
(0.000)
(0.465)
(0.000)
(0.346)
(0.001)
(0.577)
(0.000)
DF-GLS
-1.688
-3.754*
-1.142
-8.868*
-1.208
-3.393*
-1.753
-3.154*
-1.365
-5.528*
(0.084)
(0.000)
(0.256)
(0.000)
(0.230)
(0.001)
(0.083)
(0.001)
(0.175)
(0.000) *
CMR (
ρ
-1)
-0.049
-0.280*
-0.113
-1.430*
-0.035
-0.448*
-0.041
-0.343*
-0.049
-0.603*
b) Stationarity test
KPSS
1.097*
0.263
1.431*
0.112
0.762*
0.250
0.787*
0.240
0.907*
0.237
Notes: asymptotic critical values for the KPSS test are -2.587, -1.944 and -1.615 at the 1, 5 and 10% levels, respectively.
Clemente-Montañés-Reyes unit-root test with single mean shift, IO model. Optimal breakpoints are in 2008M09 for all
the 5 series.
* denotes rejection of the null hypothesis at the 5% significance level.
5.2 Cointegration analysis
Once the nonstationary behaviour of the series has been identified, we test for pairwise
cointegration between EURIBOR rate and each of the different bank rate considered. Following the
two-stage procedure proposed by Krolzig (1997), we study the cointegration properties of the
bivariate systems within a linear autoregressive representation, using maximum likelihood techniques.
As cointegration analysis is sensitive to the lag order of the VAR model, we firstly applied
different lag selection criteria to determine the optimal number of lags to include in the bivariate
systems. Results are presented in Table 2. As it can be noted, assuming a maximum order of p=5,
the sequential modified LR test (LR) and the Hannan-Quinn (HQ) and Schwarz (SC) information
criteria estimate an optimal order of p=2 for VAR specifications in levels of all the bivariate
models. The Akaike information criterion (AIC), on the other hand, is not consistent with the other
criteria and supports a larger specification with p=3 for the pass-through models of house mortgage
and loans to firms over 1 million of Euros. Despite the results of the AIC criterion, we choose a
VAR(2) specification in levels to perform the cointegration analysis for all the four bivariate models.
As in the univariate stationarity analysis, standard cointegration tests too often incorrectly fail to
reject the null of no cointegration when there is a break in the cointegrating vectors. Johansen et al.
(2000) generalised the Johansen’s maximum likelihood cointegration test in order to allow for up to
two known structural breaks in the deterministic part of the model. In particular, they assume that the
data generating process of y
t
can be described by a standard VAR model extended with appropriate
dummy variables to account for structural shifts in the deterministic components. Under the hypothesis
of cointegration, they propose different likelihood ratio cointegration tests, corresponding to alternative
sub-models for the stochastic process y
t
generated by placing restrictions on the deterministic terms, and
they derive the corresponding asymptotic distributions.
21
Table 2 – VAR lag order selection
a) EURIBOR-Consumer
b) EURIBOR-Mortgage
Lag
LogL
LR
AIC
SC
HQ
Lag
LogL
LR
AIC
SC
HQ
0
-178.62
NA
3.61
3.66
3.63
0
-157.46
NA
3.19
3.24
3.21
1
89.95
521.03
-1.68
-1.52
-1.62
1
170.68
636.59
-3.29
-3.14
-3.23
2
121.67
60.27*
-2.23*
-1.97*
-2.13*
2
207.67
70.27*
-3.95
-3.69*
-3.85*
3
123.80
3.96
-2.20
-1.83
-2.05
3
212.01
8.07
-3.96*
-3.60
-3.81
4
125.56
3.20
-2.15
-1.68
-1.96
4
212.31
0.55
-3.89
-3.42
-3.70
5
127.26
3.02
-2.11
-1.53
-1.87
5
213.82
2.69
-3.84
-3.26
-3.60
c) EURIBOR-Firms (up to 1M €)
d) EURIBOR-Firms (over 1M €)
Lag
LogL
LR
AIC
SC
HQ
Lag
LogL
LR
AIC
SC
HQ
0
-150.29
NA
3.05
3.10
3.07
0
-106.24
NA
2.16
2.22
2.19
1
203.26
685.89
-3.95
-3.79
-3.88
1
144.09
485.64
-2.76
-2.61
-2.70
2
244.01
77.42*
-4.68*
-4.42*
-4.57
2
182.64
73.25*
-3.45
-3.19*
-3.35*
3
247.60
6.68
-4.67
-4.31
-4.52
3
187.70
9.40
-3.47*
-3.11
-3.33
4
251.35
6.83
-4.67
-4.20
-4.48
4
190.52
5.13
-3.45
-2.98
-3.26
5
252.26
1.62
-4.61
-4.03
-4.37
5
193.70
5.66
-3.43
-2.86
-3.20
Notes: * indicates lag order selected by the criterion.
Based on the empirical evidence obtained in the univariate time series analysis, we thus refer to
the Johansen-Mosconi-Nielsen (JMN) test to carry out cointegration analysis in the presence of one
known structural break in the deterministic intercept
11
. The break has been defined as occurring in
September 2008, an observation which has been identified as the optimal breakpoint for all the
series considered in the CMR unit root test. Table 3 presents the results of the JMN cointegration
test. The null of no cointegration is clearly rejected at the 1% significance level in favour of the
alternative hypothesis of one cointegrating relationship with a structural break occurring in
September 2008 in all the four bivariate models. On the other hand, linear cointegration (Johansen,
1995) tests, presented in Table A1 in the Appendix, fail in rejecting the null hypothesis of no
cointegration between bank and interbank interest rates, further confirming the necessity of
appropriately modelling structural shifts in the deterministic components for the assessment of the
cointegration properties of the systems.
The estimated long-run cointegration relationships between bank and interbank rates assumes the
following form:
11
In particular, we refer to the model with a broken constant level in Johansen et al. (2000, page 225):
Δy
t
= (Π, µ)
y
t−1
E
t
⎛
⎝
⎜
⎜
⎜
⎜
⎜
⎜
⎞
⎠
⎟
⎟
⎟
⎟
⎟
⎟
⎟
+ Γ
i
Δ
i=1
p−1
∑
y
t−i
+ κ
j,i
D
j,t−i
j=2
q
∑
i=1
p
∑
+ u
t
where E
t
=(E
1t
, E
1t
, …, E
qt
)’ is a matrix of q dummy variables, where E
j,t
=1 if observation t belongs to the jth period and
0 otherwise, D
j,t-i
is an impulse dummy that equals 1 if observation t is the ith observation of the jth period. The
hypothesis of reduced cointegration rank H
c
(r): rank (
Π
, µ) ≤ r can be then tested by means of a LR test statistics.
22
′
β y
t−1
consumer
= br
t−1
consumer
−0.1757
(0.0603)
mr
t−1
′
β y
t−1
mortgage
= br
t−1
mortgage
−0.4321
(0.0485)
mr
t−1
′
β y
t−1
firm_ up1M
= br
t−1
firm_ up1M
−0.4957
(0.0547 )
mr
t−1
′
β y
t−1
firm_ ov1M
= br
t−1
firm_ ov1M
−0.7292
(0.0415)
mr
t−1
(12)
where we have normalized the cointegration vectors so that the coefficient of
br
t−1
in each model
equals 1 and the constant has been suppressed.
The long-run multipliers in (12), as discussed in Section 4, measure the degree of pass-through and
a coefficient equal to 1 implies that all the changes in the policy-vehicle rate are transmitted to retail
rates. The long-run pass-through from interbank to all the bank rates considered is found to be
incomplete: despite being statically significant, all the impact multipliers are lower than 1. Our results
are in line with those of Blot and Labondance (2011) and suggest that the transmission mechanism
becomes more effective in both household and firm markets as the maturity and the amount of the
loans increases.
Table 3 – Johansen-Mosconi-Nielsen cointegration test with one break in the intercept
Critical Values
*
:
H
0
: rank = r
LR Statistic
p-value
90%
95%
99%
a) EURIBOR-Consumer
r = 0
43.11*
0.0000
22.66
24.73
28.94
r ≤ 1
9.31
0.1779
10.93
12.74
16.62
b) EURIBOR-Mortgage
r = 0
32.44*
0.0022
22.66
24.73
28.94
r ≤ 1
8.35
0.2442
10.93
12.74
16.62
c) EURIBOR-Firms (up to 1M €)
r = 0
35.07*
0.0007
22.66
24.73
28.94
r ≤ 1
3.39
0.8265
10.93
12.74
16.62
d) EURIBOR-Firms (over 1M €)
r = 0
42.75*
0.0000
22.66
24.73
28.94
r ≤ 1
6.21
0.4592
10.93
12.74
16.62
Notes: * indicates rejection of the null hypotesis at the 5% level. Critical values are derived from
the estimated distribution for the model Hc(r) presented in Johansen et al. (2000).
The pass-through between money market and consumer loans rate is found to be particularly weak,
revealing that these interest rates are less impacted by monetary conditions than the others considered
and suggesting the existence of higher market power of banks in setting retail prices for short term
consumption loans. The degree of pass-through is found to be higher for lending rates for house
23
purchase (0.4321) and for loans to non-financial corporations up to 1 million Euros (0.4957). Finally,
the highest degree of pass-through is estimated for loans over 1 million Euros, which may generally
granted to bigger and more firms than the loans up to 1 million. For such loans, the higher
competition between banks and markets, as pointed out by Blot and Labondance (2011), reduce
banks’ market power, thus increasing the long-term equilibrium pass-through.
5.3 MS-VECM results
The cointegration results from the previous sub-section are used in the second stage of our
interest rate pass-through analysis. We specify a Markov-switching VECM with 2 regimes and 1
lag in the first-differences of the variables
12
, with regime shifts in the intercept, the autoregressive
parameters and the error variance (MSIAH(2)-VECM(1)). The estimates of the MS-VECM,
obtained by using the MSVAR package by Krolzig (2004) for the Ox programming language
(Doornik, 2007), are presented in Table 4 and Figure 7.
In analysing the results, we first verify for the appropriateness of the non-linear representation of
the data, by testing the Markov-switching VECMs against their linear counterparts by means of
likelihood ratio tests
13
. Results show a clear rejection of the hypothesis of linearity at the 1%
significance level for all the bivariate models, providing strong support to the necessity of including
a Markov-switching mechanism to correctly representing the dynamic relationship between
interbank and each retail bank interest rate and to capture the different degrees of interest rate pass-
through in normal market conditions and in a high-volatility context. Moreover, LR tests for nested
Markov-switching specifications (namely, MSI and MSIH) unambiguously suggest a rejection of
the null hypothesis, indicating that a MSIAH-VECM allowing for shifts in the intercept, the
variance-covariance matrix and the autoregressive structure is the most appropriate specification for
all the bivariate models of interest rate pass-through considered. Figure A2 in the Appendix shows
the statistical properties of the normalized residuals of the bivariate models. The residuals appear to
be non-autocorrelated, homoskedastic and normally distributed and thus provide support for our
interest rate pass-through models to be based on a congruent econometric specification.
Turning to the analysis of the characteristics of the two regimes, for all the four models it is
possible to note that Regime 2 contains most of the observations, has the longest duration and
highest probability, and can be therefore assumed as the “Normal” regime. Regime 1, on the other
hand, contains 15% to 20% of the observations and has an average duration over 5 months only for
12
Given the optimal lag order of the VECM, defined in the linear analysis, AIC and log-likelihood criteria were used to
determine the number of regimes.
13
Similar results are obtained for the non-linear MSI-VECM and MSIH-VECM. All the LR tests, not presented here
but available from the authors, lead to reject the null hypothesis of linearity.
24
the pass-through model of loans to firm up to 1 million Euros, while for the remaining models the
duration of this regime is below 3 months. Regime 1 is also characterized by a significantly higher
volatility of the EURIBOR rate and a general decreasing tendency of all the interest rates (as it can
be noted from the graphs in Figure A.1 in the Appendix), which turns into a higher estimated
variance especially for the interbank rate equation with respect to the normal regime in almost all
the bivariate models. Regime 1 can therefore defined as a “High-volatility” state.
Moreover, the transition matrices defining the Markov switching regimes show that there is a
higher probability to remain in a “Normal” state if that was the current state of the economy in the
previous period: the normal regime is therefore highly persistent, with more than a 90% probability of
staying in this regime for all the models (with the mortgage and loans to firms up to 1 million Euros
rates displaying the highest persistence). Conversely, the probability of changing from one regime to
another is higher in periods of financial turmoil (with transition probabilities around 30%, with a
maximum of 46% for consumer rates), suggesting an overall instability of the high-volatility state.
In Figure 7, we represent the estimated filtered and smoothed regime probabilities for the two-
regimes bivariate pass-through models. The filtered probability is the probability of being in a given
regime at time t conditional on the information set observed up to date t, while the smoothed
probability represents the conditional probability based on the information available throughout the
whole sample of T observations. The probability of being in a “High-volatility” (Regime 1) state is
represented on the y-axis, while the corresponding date on the x-axis. The analysis of the graphs
allows to reconstruct the time-path of regimes and offers additional support to the usefulness of the
approach adopted in this application
14
. Looking at the regime probabilities patterns, we observe
similar regime properties for all the models. Moreover, our modelling approach is able to
undoubtedly identify those periods of financial turmoil already discussed in the descriptive analysis
of Section 3. In particular, from the onset of the subprime crises at the end of 2007, the frequency of
the high-volatility regime significantly increases in all the models, highlighting the necessity of
separately modelling interest rate pass-through in this period of global crisis. Focusing on the crisis
period, the models show some heterogeneity in the dynamics of interest rates. The evident structural
break in the last months of 2008 and in the firsts of 2009 as well as the marked variability of
interest rates at the end of 2007 are correctly captured in all the specifications. The pass-through
models for consumer loans and for non-financial corporations loans over 1 million of Euros rates
show frequent regime changes with the presence of several short periods of high variability in 2010
14
The smoothed regime probabilities are used to assigning observations to each regime. In the two-regimes case, the
classification rule simplifies so that an observation is assigned to the first regime if
Pr(s
t
= 1| y
T
) > 0.5
and to the
second if
Pr(s
t
= 1| y
T
) < 0.5
.
25
and in 2011. On the other hand, the pass-through to interest rates for loans to firms up to 1 million
Euros is characterized by a highly volatile state, which lasts for 11 months from October 2008 to
September 2009, revealing the remarkable impact of the spread of global financial crisis on the
transmission mechanism of changes in interbank rate to this type of retail bank rate.
Turning to the analysis of the estimated parameters in Table 4, and focusing on the short-run
multipliers and on the speed of adjustment coefficients, the MSIAH-VECM models show
significantly different behaviours for the retail bank lending rates under the two different regimes. A
common feature of all the models is the lower degree of pass-through in the short-run and the higher
speed of adjustment to disequilibria during periods of high-volatility: the effects of financial turmoil
periods seem to weaken the short-run transmission between the money market and retail bank rates,
but they strongly increase the responsiveness of loan rates from deviations to long-run equilibrium.
This empirical evidence is in line with the findings of Blot and Labondance (2011), based on a split-
sample analysis of pass-through in the Euro area before and during the current financial crisis.
Analysing the degree of pass-through for each retail rate, we find that the rates for loans to
households to finance both consumption and house purchase are stickier and characterized by a
more sluggish adjustment than the loan rates to non-financial corporations. In particular, consumer
loans display the lowest short-run pass through in both the regimes (0.1526 and 0.1713 in Regime 1
and 2, respectively) and also the speed of adjustment is lower than that of the other rates, despite it
increases in the high-volatility state. A similar picture emerges for the loan rates for house purchase,
for which the pass-through is slightly more effective in the normal market regime (0.2610), but it is
not significantly different from zero in periods of high-volatility, while the increase in the speed of
adjustment is more marked (from 0.0278 to 0.2491, shifting from regime 2 to regime 1). Turning to
the analysis of the pass-through to interest rates for loans to non-financial corporations, we note that
the short-term relationships with the interbank rate are more important and effective than those
found for the household segment. More precisely, the degree of pass-through is significantly higher
and quite stable between in the two regimes for loans up to 1 million Euros (0.5341 and 0.5596,
respectively), and it is almost complete in the case of loans over 1 million Euros in the normal
market state, being equal to 0.9119, and remains high also in financial turmoil periods (0.7490). The
speeds of pass-through are also much more pronounced, particularly for interest rates on loans over
1 million Euros, which are characterized by the highest responsiveness in the adjustment to long-
run disequilibria especially in high-volatility periods (0.5904). This evidence confirms the existence
of significant heterogeneity in banks’ pricing behaviour and reveals the lower market power of
banks in setting retail rates for loans granted to larger firms.