APPLICATIONS OF DIGITAL SIGNAL PROCESSING TO AUDIO AND ACOUSTICS doc
Bạn đang xem bản rút gọn của tài liệu. Xem và tải ngay bản đầy đủ của tài liệu tại đây (3.27 MB, 285 trang )
APPLICATIONS OF DIGITAL
SIGNAL PROCESSING TO
AUDIO AND ACOUSTICS
edited by
Mark Kahrs
Rutgers University
Piscataway, New Jersey, USA
Karlheinz Brandenburg
Fraunhofer Institut Integrierte Schaltungen
Erlangen, Germany
KLUWER ACADEMIC PUBLISHERS
NEW YORK, BOSTON, '25'5(&+7,
/21'21 , MOSCOW
eBook ISBN:
0-3064-7042-X
Print ISBN
0-7923-8130-0
©2002 Kluwer Academic Publishers
New York, Boston, Dordrecht, London, Moscow
All rights reserved
No part of this eBook may be reproduced or transmitted in any form or by any means, electronic,
mechanical, recording, or otherwise, without written consent from the Publisher
Created in the United States of America
Visit Kluwer Online at:
and Kluwer's eBookstore at:
This page intentionally left blank.
Contents
List of Figures
List of Tables
Contributing Authors
Introduction
Karlheinz Brandenburg and Mark Kahrs
xiii
xxi
xxiii
xxix
1
Audio quality determination based on perceptual measurement techniques
1
John G. Beerends
1.1
Introduction
1
1.2 Basic measuring philosophy
2
1.3 Subjective versus objective perceptual testing
6
1.4
Psychoacoustic fundamentals of calculating the internal sound repre-
sentation
8
1.5
Computation of the internal sound representation
13
1.6
The perceptual audio quality measure (PAQM)
17
1.7 Validation of the PAQM on speech and music codec databases
20
1.8
Cognitive effects in judging audio quality
22
1.9
ITU Standardization
29
1.9.1
ITU-T, speech quality
30
1.9.2 ITU-R, audio quality
35
1. 10 Conclusions
37
2
Perceptual Coding of High Quality Digital Audio
39
Karlheinz Brandenburg
2.1
Introduction
39
vi
APPLICATIONS OF DSP TO AUDIO AND ACOUSTICS
2.2
Some Facts about Psychoacoustics
2.2.1
Masking in the Frequency Domain
2.2.2
Masking in the Time Domain
2.2.3
Variability between listeners
2.3
Basic ideas of perceptual coding
2.3.1
Basic block diagram
2.3.2
Additional coding tools
2.3.3
Perceptual Entropy
2.4
Description of coding tools
2.4.1 Filter banks
2.4.2
Perceptual models
2.4.3 Quantization and coding
2.4.4 Joint stereo coding
2.4.5 Prediction
2.4.6 Multi-channel: to matrix or not to matrix
2.5
Applying the basic techniques: real coding systems
2.5.1 Pointers to early systems (no detailed description)
2.5.2 MPEG Audio
2.5.3
MPEG-2 Advanced Audio Coding (MPEG-2 AAC)
2.5.4 MPEG-4 Audio
2.6
Current Research Topics
2.7
Conclusions
3
Reverberation Algorithms
William G. Gardner
3.1
Introduction
3.1.1
Reverberation as a linear filter
3.1.2
Approaches to reverberation algorithms
3.2
Physical and Perceptual Background
3.2.1
Measurement of reverberation
3.2.2
Early reverberation
3.2.3
Perceptual effects of early echoes
3.2.4
Reverberation time
3.2.5
Modal description of reverberation
3.2.6
Statistical model for reverberation
3.2.7
Subjective and objective measures of late reverberation
3.2.8 Summary of framework
3.3
Modeling Early Reverberation
3.4
Comb and Allpass Reverberators
3.4.1
Schroeder’s reverberator
3.4.2 The parallel comb filter
3.4.3 Modal density and echo density
3.4.4 Producing uncorrelated outputs
3.4.5 Moorer’s reverberator
3.4.6 Allpass reverberators
3.5
Feedback Delay Networks
42
42
44
45
47
48
49
50
50
50
59
63
68
72
73
74
74
75
79
81
82
83
85
85
86
87
88
89
90
93
94
95
97
98
100
100
105
105
108
109
111
112
113
116
3.5.1 Jot’s reverberator
119
3.5.2 Unitary feedback loops
121
3.5.3
Absorptive delays
122
3.5.4 Waveguide reverberators 123
3.5.5
Lossless prototype structures
125
3.5.6
Implementation of absorptive and correction filters
128
3.5.7
Multirate algorithms
128
3.5.8
Time-varying algorithms
129
3.6
Conclusions
130
4
Digital Audio Restoration
Simon Godsill, Peter Rayner and Olivier Cappé
4.1
Introduction
4.2
Modelling of audio signals
4.3
Click Removal
4.3.1
Modelling of clicks
4.3.2
Detection
4.3.3
Replacement of corrupted samples
4.3.4
Statistical methods for the treatment of clicks
4.4 Correlated Noise Pulse Removal
4.5
Background noise reduction
4.5.1
Background noise reduction by short-time spectral attenuation 164
4.5.2
Discussion
177
4.6
Pitch variation defects 177
4.6.1
Frequency domain estimation 179
4.7
Reduction of Non-linear Amplitude Distortion
182
4.7.1
Distortion Modelling 183
4.7.2
Non-linear Signal Models
184
4.7.3
Application of Non-linear models to Distortion Reduction
186
4.7.4
Parameter Estimation
188
4.7.5
Examples
190
4.7.6
Discussion
190
4.8
Other areas
192
4.9 Conclusion and Future Trends
193
Contents
vii
133
134
135
137
137
141
144
152
155
163
5
Digital Audio System Architecture
Mark Kahrs
5.1
Introduction
5.2 Input/Output
5.2.1
Analog/Digital Conversion
5.2.2
Sampling clocks
5.3 Processing
5.3.1
Requirements
5.3.2
Processing
5.3.3
Synthesis
195
195
196
196
202
203
204
207
208
viii
APPLICATIONS OF DSP TO AUDIO AND ACOUSTICS
5.3.4
Processors
5.4
Conclusion
6
Signal Processing for Hearing Aids
James M. Kates
6.1 Introduction
6.2
Hearing and Hearing Loss
6.2.1 Outer and Middle Ear
6.3 Inner Ear
6.3.1 Retrocochlear and Central Losses
6.3.2 Summary
6.4 Linear Amplification
6.4.1 System Description
6.4.2
Dynamic Range
6.4.3 Distortion
6.4.4 Bandwidth
6.5
Feedback Cancellation
6.6 Compression Amplification
6.6.1 Single-Channel Compression
6.6.2
Two-Channel Compression
6.6.3 Multi-Channel Compression
6.7 Single-Microphone Noise Suppression
6.7.Adaptive Analog Filters
6.7.2 Spectral Subtraction
6.7.3 Spectral Enhancement
6.8
Multi-Microphone Noise Suppression
6.8.1 Directional Microphone Elements
6.8.2 Two-Microphone Adaptive Noise Cancellation
6.8.3 Arrays with Time-Invariant Weights
6.8.4 Two-Microphone Adaptive Arrays
6.8.5 Multi-Microphone Adaptive Arrays
6.8.6 Performance Comparison in a Real Room
6.9 Cochlear Implants
6.10 Conclusions
7
Time and Pitch scale modification of audio signals
Jean Laroche
7.1
Introduction
7.2
Notations and definitions
7.2.1 An underlying sinusoidal model for signals
7.2.2
A definition of time-scale and pitch-scale modification
7.3 Frequency-domain techniques
7.3.1
Methods based on the short-time Fourier transform
7.3.2
Methods based on a signal model
7.4 Time-domain techniques
209
234
235
236
237
238
239
247
248
248
249
251
252
253
253
255
256
260
261
263
263
264
266
267
267
268
269
269
271
273
275
276
279
279
282
282
282
285
285
293
293
Contents ix
7.4.1
Principle
7.4.2
Pitch independent methods
7.4.3
Periodicity-driven methods
7.5 Formant modification
7.5.1
Time-domain techniques
7.5.2
Frequency-domain techniques
7.6 Discussion
7.6.1
Generic problems associated with time or pitch scaling
7.6.2 Time-domain vs frequency-domain techniques
8
Wavetable Sampling Synthesis
Dana C. Massie
8.1
Background and introduction
8.1.1
Transition to Digital
8.1.2 Flourishing of Digital Synthesis Methods
8.1.3 Metrics: The Sampling - Synthesis Continuum
8.1.4 Sampling vs. Synthesis
8.2
Wavetable Sampling Synthesis
8.2.1
Playback of digitized musical instrument events.
8.2.2 Entire note - not single period
8.2.3
Pitch Shifting Technologies
8.2.4
Looping of sustain
8.2.5 Multi-sampling
8.2.6
Enveloping
8.2.7 Filtering
8.2.8
Amplitude variations as a function of velocity
8.2.9 Mixing or summation of channels
8.2.10
Multiplexed wavetables
8.3
Conclusion
9
Audio Signal Processing Based on Sinusoidal Analysis/Synthesis
T.F. Quatieri and R. J. McAulay
9.1
Introduction
9.2 Filter Bank Analysis/Synthesis
9.2.1 Additive Synthesis
9.2.2 Phase Vocoder
9.2.3
Motivation for a Sine-Wave Analysis/Synthesis
9.3
Sinusoidal-Based Analysis/Synthesis
9.3.1 Model
9.3.2 Estimation of Model Parameters
9.3.3
Frame-to-Frame Peak Matching
9.3.4 Synthesis
9.3.5
Experimental Results
9.3.6
Applications of the Baseline System
9.3.7
Time-Frequency Resolution
9.4
Source/Filter Phase Model
293
294
298
302
302
302
303
303
308
311
311
312
313
314
315
318
318
318
319
331
337
338
338
339
339
340
341
343
344
346
346
347
350
351
352
352
355
355
358
362
364
366
x
APPLICATIONS OF DSP TO AUDIO AND ACOUSTICS
9.4.1 Model
367
9.4.2 Phase Coherence in Signal Modification
368
9.4.3
Revisiting the Filter Bank-Based Approach
381
9.5
Additive Deterministic/Stochastic Model
384
9.5.1 Model
385
9.5.2
Analysis/Synthesis
387
9.5.3
Applications
390
9.6
Signal Separation Using a Two-Voice Model
392
9.6.1 Formulation of the Separation Problem
392
9.6.2 Analysis and Separation
396
9.6.3 The Ambiguity Problem
399
9.6.4 Pitch and Voicing Estimation
402
9.7 FM Synthesis
403
9.7.1 Principles
404
9.7.2 Representation of Musical Sound
407
9.7.3 Parameter Estimation
409
9.7.4 Extensions
411
9.8
Conclusions
411
10
Principles of Digital Waveguide Models of Musical Instruments
417
Julius O. Smith III
10.1 Introduction
418
10.1.1
Antecedents in Speech Modeling
418
10.1.2
Physical Models in Music Synthesis
420
10.1.3 Summary
422
10.2 The Ideal Vibrating String
423
10.2.1
The Finite Difference Approximation
424
10.2.2
Traveling-Wave Solution
426
10.3
Sampling the Traveling Waves
426
10.3.1 Relation to Finite Difference Recursion
430
10.4 Alternative Wave Variables
431
10.4.1 Spatial Derivatives
431
10.4.2 Force Waves
432
10.4.3 Power Waves
434
10.4.4 Energy Density Waves
435
10.4.5 Root-Power Waves
436
10.5
Scattering at an Impedance Discontinuity
436
10.5.1 The Kelly-Lochbaum and One-Multiply Scattering Junctions
439
10.5.2 Normalized Scattering Junctions
441
10.5.3
Junction Passivity
443
10.6 Scattering at a Loaded Junction of N Waveguides
446
10.7 The Lossy One-Dimensional Wave Equation
448
10.7.1 Loss Consolidation
450
10.7.2 Frequency-Dependent Losses
451
10.8 The Dispersive One-Dimensional Wave Equation
451
10.9 Single-Reed Instruments
455
Contents
xi
10.9.1
Clarinet Overview
457
10.9.2 Single-Reed Theory
458
10.10
Bowed Strings
462
10.10.1 Violin Overview
463
10.10.2
The Bow-String Scattering Junction
464
10.11
Conclusions
466
References
467
Index
535
This page intentionally left blank.
List of Figures
1.1
1.2
1.3
1.4
1.5
1.6
1.7
1.8
1.9
1.10
1.11
1.12
1.13
1.14
1.15
1.16
1.17
1.18
1.19
1.20
1.21
1.22
2.1
2.2
44
45
4
9
10
11
12
15
18
19
21
22
23
24
25
28
29
30
31
32
33
34
35
36
kHz
Basic philosophy used in perceptual audio quality determination
Excitation pattern for a single sinusoidal tone
Excitation pattern for a single click
Excitation pattern for a short tone burst
Masking model overview
Time-domain smearing as a function of frequency
Basic auditory transformations used in the PAQM
Relation between MOS and PAQM, ISO/MPEG 1990 database
Relation between MOS and PAQM, ISO/MPEG 1991 database
Relation between MOS and PAQM, ITU-R 1993 database
Relation between MOS and PAQM, ETSI GSM full rate database
Relation between MOS and PAQM, ETSI GSM half rate database
Basic approach used in the development of PAQM
C
Relation between MOS and PAQM
C
, ISO/MPEG 1991 database
Relation between MOS and PAQM
C
, ITU-R 1993 database
Relation between MOS and PAQM
C
, ETSI GSM full rate database
Relation between MOS and PAQM
C
, ETSI GSM half rate database
Relation between MOS and PSQM, ETSI GSM full rate database
Relation between MOS and PSQM, ETSI GSM half rate database
Relation between MOS and PSQM, ITU-T German speech database
Relation between MOS and PSQM, ITU-T Japanese speech database
Relation between Japanese and German MOS values
Masked thresholds: Masker: narrow band noise at 250 Hz, 1 kHz, 4
Example of pre-masking and post-masking
xiv
APPLICATIONS OF DSP TO AUDIO AND ACOUSTICS
3.2
3.3
3.4
3.5
3.6
3.7
3.8
3.9
3.1
2.7
2.8
2.9
2.3
2.4
2.5
2.6
2.10
2.11
2.12
2.13
2.14
2.15
2.16
2.17
2.18
2.19
2.20
2.21
3.10
3.11
3.12
3.13
3.14
3.15
Masking experiment as reported in [Spille, 1992]
Example of a pre-echo
Block diagram of a perceptual encoding/decoding system
Basic block diagram of an n-channel analysis/synthesis filter bank
with downsampling by k
Window function of the MPEG-1 polyphase filter bank
Frequency response of the MPEG-1 polyphase filter bank
Block diagram of the MPEG Layer 3 hybrid filter bank
Window forms used in Layer 3
Example sequence of window forms
Example for the bit reservoir technology (Layer 3)
Main axis transform of the stereo plane
Basic block diagram of M/S stereo coding
Signal flow graph of the M/S matrix
Basic principle of intensity stereo coding
ITU Multichannel configuration
Block diagram of an MPEG-1 Layer 3 encode
Transmission of MPEG-2 multichannel information within an MPEG-
1 bitstream
Block diagram of the MPEG-2 AAC encoder
MPEG-4 audio scaleable configuration
Impulse response of reverberant stairwell measured using ML se-
quences.
Single wall reflection and corresponding image source A' .
A regular pattern of image sources occurs in an ideal rectangular room.
91
Energy decay relief for occupied Boston Symphony Hall
96
90
91
78
80
82
77
73
71
70
51
54
55
57
58
59
67
69
70
46
47
48
Canonical direct form FIR filter with single sample delays.
101
Combining early echoes and late reverberation
102
FIR filter cascaded with reverberator
102
Associating absorptive and directional filters with early echoes.
103
Average head-related filter applied to a set of early echoes
104
Binaural early echo simulator
104
One-pole, DC-normalized lowpass filter.
104
Comb filter response
106
Allpass filter formed by modification of a comb filter
106
Schroeder’s reverberator consisting of a parallel comb filter and a
series allpass filter [Schroeder, 1962].
108
Mixing matrix used to form uncorrelated outputs
112
3.16
3.17
3.18
3.19
3.20
3.21
3.22
3.23
3.24
3.25
3.26
3.27
3.28
3.29
4.1
4.2
4.3
4.4
4.5
4.6
4.7
4.8
4.9
4.10
4.11
4.12
4.13
4.14
4.15
4.16
4.17
4.18
LIST OF FIGURES
xv
Controlling IACC in binaural reverberation
112
Comb filter with lowpass filter in feedback loop
113
Lattice allpass structure.
115
Generalization of figure 3.18.
115
Reverberator formed by adding absorptive losses to an allpass feed-
back loop
115
Dattorro’s plate reverberator based on an allpass feedback loop
117
Stautner and Puckette’s four channel feedback delay network
118
Feedback delay network as a general specification of a reverberator
containing
N delays
120
Unitary feedback loop
121
Associating an attenuation with a delay.
122
Associating an absorptive filter with a delay.
123
Reverberator constructed with frequency dependent absorptive filters
124
Waveguide network consisting of a single scattering junction to which
N waveguides are attached
124
Modification of Schroeder’s parallel comb filter to maximize echo
density
126
Click-degraded music waveform taken from 78 rpm recording
138
AR-based detection,
P=50. (a) Prediction error filter (b) Matched filter.
138
Electron micrograph showing dust and damage to the grooves of a
78rpm gramophone disc.
139
AR-based interpolation,
P
=60, classical chamber music, (a) short
gaps, (b) long gaps
147
Original signal and excitation (P
=100)
150
LSAR interpolation and excitation (
P
= 100)
150
Sampled AR interpolation and excitation (P
=100)
151
Restoration using Bayesian iterative methods
155
Noise pulse from optical film sound track (‘silent’ section)
157
Signal waveform degraded by low frequency noise transient
157
Degraded audio signal with many closely spaced noise transients
161
Estimated noise transients for figure 4.11
161
Restored audio signal for figure 4.11 (different scale)
162
Modeled restoration process
164
Background noise suppression by short- time spectral attenuation
165
Suppression rules characteristics
168
Restoration of a sinusoidal signal embedded in white noise
169
Probability density of the relative signal level for different mean values
172
xvi
APPLICATIONS OF DSP TO AUDIO AND ACOUSTICS
4.19
Short-time power variations
175
4.20
Frequency tracks generated for example ‘Viola’
179
4.21 Estimated (full line) and true (dotted line) pitch variation curves
generated for example ‘Viola’
180
4.22 Frequency tracks generated for example ‘Midsum’
180
4.23
Pitch variation curve generated for example ‘Midsum’
181
4.24
Model of the distortion process
184
4.25 Model of the signal and distortion process
186
4.26 Typical section of AR-MNL Restoration
191
4.27
Typical section of AR-NAR Restoration
191
5.1 DSP system block diagram
196
5.2 Successive Approximation Converter
198
5.3 16 Bit Floating Point DAC (from [Kriz, 1975]) 202
5.4
Block diagram of Moore’s FRMbox 210
5.5
Samson Box block diagram 211
5.6
diGiugno 4A processor
213
5.7
IRCAM 4B data path
214
5.8
IRCAM 4C data path
215
5.9 IRCAM 4X system block diagram
216
5.10
Sony DAE-1000 signal processor
217
5.11 Lucasfilm ASP ALU block diagram
218
5.12 Lucasfilm ASP interconnect and memory diagram
219
5.13 Moorer’s update queue data path
219
5.14
MPACT block diagram
222
5.15
Rossum’s cached interpolator
226
5.16
Sony OXF DSP block diagram
227
5.17
DSP.* block diagram
228
5.18
Gnusic block diagram
229
5.19
Gnusic core block diagram
230
5.20
Sony SDP-1000 DSP block diagram
232
5.21
Sony’s OXF interconnect block diagram
233
6.1
Major features of the human auditory system
238
6.2
Features of the cochlea: transverse cross-section of the cochlea
239
6.3
Features of the cochlea: the organ of Corti
240
6.4
Sample tuning curves for single units in the auditory nerve of the cat
241
6.5
Neural tuning curves resulting from damaged hair cells
242
6.6
Loudness level functions
244
6.7
Mean results for unilateral cochlear impairments
246
LIST OF FIGURES xvii
6.8 Simulated neural response for the normal ear
6.9 Simulated neural response for impaired outer cell function
6.10 Simulated neural response for 30 dB of gain
6.11
Cross-section of an in-the-ear hearing aid
6.12
Block diagram of an ITE hearing aid inserted into the ear canal
6.13
Block diagram of a hearing aid incorporating signal processing for
feedback cancellation
6.14 Input/output relationship for a typical hearing-aid compression amplifier
6.15
Block diagram of a hearing aid having feedback compression
6.16 Compression amplifier input/output curves derived from a simplified
model of hearing loss.
6.17
Block diagram of a spectral-subtraction noise-reduction system.
6.18
Block diagram of an adaptive noise-cancellation system.
6.19 Block diagram of an adaptive two-microphone array.
6.20 Block diagram of a time-domain five-microphone adaptive array.
6.21 Block diagram of a frequency-domain five-microphone adaptive array.
7.1 Duality between Time-scaling and Pitch-scaling operations
7.2
Time stretching in the time-domain
7.3
A modified tape recorder for analog time-scale or pitch-scale modi-
7.4 Pitch modification with the sampling technique
7.5
Output elapsed time versus input elapsed time in the sampling method
for Time-stretching
7.6
Time-scale modification of a sinusoid
7.7 Output elapsed time versus input elapsed time in the optimized sam-
pling method for Time-stretching
7.8 Pitch-scale modification with the PSOLA method
7.9
Time-domain representation of a speech signal showing shape invari-
ance
7.10
Time-domain representation of a speech signal showing loss of shape-
invariance
8.1
Expressivity vs. Accuracy
316
8.2
316
8.3
Labor costs for synthesis techniques
317
8.4
Rudimentary sampling
320
8.5
“Drop Sample Tuning” table lookup sampling playback oscillator
323
8.6 Classical sample rate conversion chain
325
8.7
326
247
248
249
250
251
255
256
257
260
265
268
270
271
274
285
293
294
295
296
297
300
301
305
306
Sampling tradeoffs
Digital Sinc function
fication
xviii
APPLICATIONS OF DSP TO AUDIO AND ACOUSTICS
8.8 Frequency response of at linear interpolation sample rate converter
327
8.9 A sampling playback oscillator using high order interpolation
329
8.10 Traditional ADSR amplitude envelope
331
8.11 Backwards forwards loop at a loop point with even symmetry
333
8.12 Backwards forwards loop at a loop point with odd symmetry
333
8.13 Multisampling
337
9.1 Signal and spectrogram from a trumpet
345
9.2 Phase vocoder based on filter bank analysis/synthesis.
349
9.3
Passage of single sine wave through one bandpass filter.
350
9.4 Sine-wave tracking based on frequency-matching algorithm
356
9.5
Block diagram of baseline sinusoidal analysis/synthesis
358
9.6
Reconstruction of speech waveform
359
9.7
Reconstruction of trumpet waveform
360
9.8
Reconstruction of waveform from a closing stapler
360
9.9
Magnitude-only reconstruction of speech
36l
9.10
Onset-time model for time-scale modification 370
9.11 Transitional properties of frequency tracks with adaptive cutoff 372
9.12 Estimation of onset times for time-scale modification 374
9.13
Analysis/synthesis for time-scale modification
375
9.14
Example of time-scale modification of trumpet waveform
376
9.15
Example of time-varying time-scale modification of speech waveform
376
9.16
KFH phase dispersion using the sine-wave preprocessor
380
9.17
Comparison of original waveform and processed speech
381
9.18
Time-scale expansion (
x
2) using subband phase correction
383
9.19
Time-scale expansion (
x
2) of a closing stapler using filter bank/overlap-
add
385
9.20
Block diagram of the deterministic plus stochastic system.
389
9.21
Decomposition example of a piano tone
391
9.22
Two-voice separation using sine-wave analysis/synthesis and peak-
picking
393
9.23
Properties of the STFT of x(n ) = x
a
(
n) + x
b
(n)
396
9.24
Least-squared error solution for two sine waves
397
9.25
Demonstration of two-lobe overlap
400
9.26
H matrix for the example in Figure 9.25
401
9.27
Demonstration of ill conditioning of the H matrix
402
9.28 FM Synthesis with different carrier and modulation frequencies
405
9.29
Spectral dynamics of FM synthesis with linearly changing modulation
index
406
LIST OF FIGURES
xix
9.30 Comparison of Equation (9.82) and (9.86) for parameter settings
ω
c
= 2000,
ω
m
= 200, and I = 5.0
407
9.31
Spectral dynamics of trumpet-like sound using FM synthesis
408
10.1 The ideal vibrating string.
423
10.2
An infinitely long string, “plucked” simultaneously at three points.
427
10.3
Digital simulation of the ideal, lossless waveguide with observation
points at x = 0 and x = 3X = 3cT.
429
10.4
Conceptual diagram of interpolated digital waveguide simulation.
429
10.5
Transverse force propagation in the ideal string.
433
10.6 A waveguide section between two partial sections, a) Physical pic-
ture indicating traveling waves in a continuous medium whose wave
impedance changes from R
0
to R
1
to R
2
. b) Digital simulation
diagram for the same situation.
437
10.7 The Kelly-Lochbaum scattering junction.
439
10.8 The one-multiply scattering junction.
440
10.9 The normalized scattering junction.
441
10.10 A three-multiply normalized scattering junction
443
10.11
Four ideal strings intersecting at a point to which a lumped impedance
is attached.
446
10.12
Discrete simulation of the ideal, lossy waveguide.
449
10.13
Discrete-time simulation of the ideal, lossy waveguide.
450
10.14
Section of a stiff string where allpass filters play the role of unit delay
elements.
453
10.15 Section of a stiff string where the allpass delay elements are consoli-
dated at two points, and a sample of pure delay is extracted from each
allpass chain.
454
10.16
A schematic model for woodwind instruments.
455
10.17 Waveguide model of a single-reed, cylindrical-bore woodwind, such
as a clarinet.
457
10.18 Schematic diagram of mouth cavity, reed aperture, and bore.
458
10.19
Normalised reed impedance overlaid with the
“bore load line”
459
10.20
Simple, qualitatively chosen reed table for the digital waveguide clarinet.
461
10.21
A schematic model for bowed-string instruments.
463
10.22
Waveguide model for a bowed string instrument, such as a violin.
464
10.23
Simple, qualitatively chosen bow table for the digital waveguide violin.
465
This page intentionally left blank.
List of Tables
2.1
Critical bands according to [Zwicker, 1982]
43
2.2
Huffman code tables used in Layer 3
66
5.1
Pipeline timing for Samson box generators
212
6.1
Hearing thresholds, descriptive terms, and probable handicaps (after
Goodman, 1965)
236
xxii
APPLICATIONS OF DSP TO AUDIO AND ACOUSTICS
Acknowledgments
Mark Kahrs would like to acknowledge the support of J.L. Flanagan. He would also like to
acknowledge the the assistance of Howard Trickey and S.J. Orfanidis. Jean Laroche has helped
out with the production and served as a valuable forcing function. The patience of Diane Litrnan
has been tested numerous times and she has offered valuable advice.
Karlheinz Brandenburg would like to thank Mark for his patience while he was always late
in delivering his parts.
Both editors would like to acknowledge the patience of Bob Holland, our editor at Kluwer.
Contributing Authors
John G. Beerends was born in Millicent, Australia, in 1954. He received a degree
in electrical engineering from the HTS (Polytechnic Institute) of The Hague, The
Netherlands, in 1975. After working in industry for three years he studied physis
and mathematics at the University of Leiden where he received the degree of M.Sc.
in 1984. In 1983 he was awarded a prize of DF1 45000,- by Job Creation, for an
innovative idea in the field of electro-acoustics. During the period 1984 to 1989 he
worked at the Institute for Perception Research where he received a Ph.D. from the
Technical University of Eindhoven in 1989. The main part of his Ph.D. work, which
deals with pitch perception, was patented by the NV. Philips Gloeilampenfabriek. In
1989 he joined the audio group of the KPN research lab in Leidschendam where he
works on audio quality assessment. Currently he is also involved in the development
of an objective video quality measure.
Karlheinz Brandenburg received M.S. (Diplom) degrees in Electrical Engineering
in 1980 and in Mathematics in 1982 from Erlangen University. In 1989 he earned his
Ph.D. in Electrical Engineering, also from Erlangen University, for work on digital
audio coding and perceptual measurement techniques. From 1989 to 1990 he was with
AT&T Bell Laboratories in Murray Hill, NJ, USA. In 1990 he returned to Erlangen
University to continue the research on audio coding and to teach a course on digital
audio technology. Since 1993 he is the head of the Audio/Multimedia department
at the Fraunhofer Institute for Integrated Circuits (FhG-IIS). Dr. Brandenburg is a
member of the technical committee on Audio and Electroacoustics of the IEEE Signal
Processing Society. In 1994 he received the ASE Fellowship Award for his work on
perceptual audio coding and psychoacoustics.
xxiv
APPLICATIONS OF DSP TO AUDIO AND ACOUSTICS
Olivier Cappé was born in Villeurbanne, France, in 1968. He received the M.Sc.
degree in electrical engineering from the Ecole Supérieure d’Electricité (ESE), Paris
in 1990, and the Ph.D. degree in signal processing from the Ecole Nationale Supérieure
des Télécommunications (ENST), Paris, in 1993. His Ph.D. tesis dealt with noise-
reduction for degraded audio recordings. He is currently with the Centre National de
la Recherche Scientifique (CNRS) at ENST, Signal department. His research interests
are in statistical signal processing for telecomunications and speech/audio processing.
Dr. Cappé received the IEE Signal Processing Society’s Young Author Best Paper
Award in 1995.
Bill Gardner was born in 1960 in Meriden, CT, and grew up in the Boston area. He
received a bachelor’s degree in computer science from MIT in 1982 and shortly there-
after joined Kurzweil Music Systems as a software engineer. For the next seven years,
he helped develop software and signal processing algorithms for Kurzweil synthesiz-
ers. He left Kurzweil in 1990 to enter graduate school at the MIT Media Lab, where
he recently completed his Ph.D. on the topic of 3-D audio using loudspeakers. He was
awarded a Motorola Fellowship at the Media Lab, and was recipient of the 1997 Audio
Engineering Society Publications Award. He is currently an independent consultant
working in the Boston area. His research interests are spatial audio, reverberation,
sound synthesis, realtime signal processing, and psychoacoustics.
Simon Godsill studied for the B.A. in Electrical and Information Sciences at the
University of Cambridge from 1985-88. Following graduation he led the technical de-
velopment team at the newly-formed CEDAR Audio Ltd., researching and developing
DSP algorithms for restoration of degraded sound recordings. In 1990 he took up a
post as Research Associate in the Signal Processing Group of the Engineering Depart-
ment at Cambridge and in 1993 he completed his doctoral thesis: The Restoration of
Degraded Audio Signals. In 1994 he was appointed as a Research Fellow at Corpus
Christi College, Cambridge and in 1996 as University Lecturer in Signal Processing at
the Engineering Department in Cambridge. Current research topics include: Bayesian
and statistical methods in signal processing, modelling and enhancement of speech
and audio signals, source signal separation, non-linear and non-Gaussian techniques,
blind estimation of communications channels and image sequence analysis.
Mark Kahrs was born in Rome, Italy in 1952. He received an A.B. from Revelle
College, University of California, San Diego in 1974. He worked intermittently for
Tymshare, Inc. as a Systems Programmer from 1968 to 1974. During the summer
of 1975 he was a Research Intern at Xerox PARC and then from 1975 to 1977
was a Research Programmer at the Center for Computer Research in Music and
CONTRIBUTING AUTHORS
xxv
Acoustics (CCRMA) at Stanford University. He was a chercheur at the Institut de
Recherche et Coordination Acoustique Musique (IRCAM) in Paris during the summer
of 1977. He received a PhD. in Computer Science from the University of Rochester
in 1984. He worked and consulted for Bell Laboratories from 1984 to 1996. He
has been an Assistant Professor at Rutgers University from 1988 to the present where
he taught courses in Computer Architecture, Digital Signal Processing and Audio
Engineering. In 1993 he was General Chair of the IEEE Workshop on Applications
of Signal Processing to Audio and Acoustics (“Mohonk Workshop”). Since 1993 he
has chaired the Technical Committee on Audio And Electroacoustics in the Signal
Processing Society of the IEEE.
James M. Kates was born in Brookline, Massachusetts, in 1948. He received the
degrees of BSEE and MSEE from the Massachusetts Institute of Technology in 1971
and the professional degree of Electrical Engineer from MIT in 1972. He is currently
Senior Scientist at AudioLogic in Boulder, Colorado, where he is developing signal
processing for a new digital hearing aid. Prior to joining AudioLogic, he was with
the Center for Research in Speech and Hearing Sciences of the City University of
New York. His research interests at CUNY included directional microphone arrays
for hearing aids, feedback cancellation strategies, signal processing for hearing aid
test and evaluation, procedures for measuring sound quality in hearing aids, speech
enhancement algorithms for the hearing-impaired, new procedures for fitting hearing
aids, and modeling normal and impaired cochlear function. He also held an appoint-
ment as an Adjunt Assistant Professor in the Doctoral Program in Speech and Hearing
Sciences at CUNY, where he taught a course in modeling auditory physiology and
perception. Previously, he has worked on applied research for hearing aids (Siemens
Hearing Instruments), signal processing for radar, speech, and hearing applications
(SIGNATRON, Inc.), and loudspeaker design and signal processing for audio applica-
tions (Acoustic Research and CBS Laboratories). He has over three dozen published
papers and holds eight patents.
Jean Laroche was born in Bordeaux, France, in 1963 He earned a degree in Math-
ematics and Sciences from the Ecole Polytechnique in 1986, and a Ph.D. degree in
Digital Signal Processing from the Ecole Nationale des Télécommunications in 1989.
He was a post-doc student at the Center for Music Experiment at UCSD in 1990, and
came back to the Ecole Nationale des Télécommunications in 1991 where he taught
audio DSP, and acoustics. Since 1996 he has been a researcher in audio/music DSP at
the Joint Emu/Creative Technology Center in Scotts Valley, CA.
xxvi
APPLICATIONS OF DSP TO AUDIO AND ACOUSTICS
Robert J. McAulay was born in Toronto, Ontario, Canada on October 23, 1939. He
received the B.A.Sc. degree in Engineering Physics with honors from the University
of Toronto, in 1962; the M.Sc. degree in Electrical Engineering from the University
of Illinois, Urbana in 1963; and the Ph.D. degree in Electrical Engineering from the
University of California, Berkeley, in 1967. He joined the Radar Signal Processing
Group of the Massachusetts Institute of Technology, Lincoln Laboratory, Lexington,
MA, where he worked on problems in estimation theory and signal/filter design using
optimal control techniques. From 1970 until 1975, he was a member of the Air
Traffic Control Division at Lincoln Laboratory, and worked on the development of
aircraft tracking algorithms, optimal MTI digital signal processing and on problems
of aircraft direction finding for the Discrete Address Beacon System. On a leave
of absence from Lincoln Laboratory during the winter and spring of 1974, he was a
Visiting Associate Professor at McGill University, Montreal, P.Q., Canada. From 1975
until 1996, he was a member of the Speech Systems Technology Group at Lincoln
Laboratory, where he was involved in the development of robust narrowband speech
vocoders. In 1986 he served on the National Research Council panel that reviewed
the problem of the removal of noise from speech. In 1987 he was appointed to the
position of Lincoln Laboratory Senior Staff. On retiring from Lincoln Laboratory in
1996, he accepted the position of Senior Scientist at Voxware to develop high-quality
speech products for the Internet. In 1978 he received the M. Barry Carlton Award
for the best paper published in the IEEE Transactions on Aerospace and Electronic
Systems for the paper “Interferometer Design for Elevation Angle Estimation”. In
1990 he received the IEEE Signal Processing Society’s Senior Award for the paper
“Speech Analysis/Synthesis Based on a Sinusoidal Representation”, published in the
IEEE Transactions on Acoustics, Speech and Signal Processing.
Dana C. Massie studied electronic music synthesis and composition at Virginia Com-
monwealth University in Richmond Virginia, and electrical engineering at Virginia
Polytechnic Institute and State University in Blacksburg, VA. He worked in profes-
sional analog recording console and digital telecom systems design at Datatronix, Inc.,
in Reston, VA from 1981 through 1983. He then moved to E-mu Systems, Inc., in
California, to design DSP algorithms and architectures for electronic music. After
brief stints at NeXT Computer, Inc. and WaveFrame, Inc., developing MultiMedia
DSP applications, he returned to E-mu Systems to work in digital filter design, digital
reverberation design, and advanced music synthesis algorithms. He is now the Director
of the Joint E-mu/Creative Technology Center, in Scotts Valley, California. The “Tech
Center” develops advanced audio technologies for both E-mu Systems and Creative
Technology, Limited in Singapore, including VLSI designs, advanced music synthesis
algorithms, 3D audio algorithms, and software tools.
CONTRIBUTING AUTHORS
xxvii
Thomas F. Quatieri was born in Somerville, Massachusetts on January 31, 1952.
He received the B.S. degree from Tufts University, Medford, Massachusetts in 1973,
and the SM., E.E., and Sc.D. degrees from the Massachusetts Institute of Technol-
ogy (M.I.T.), Cambridge, Massachusetts in 1975, 1977, and 1979, respectively. He
is currently a senior research staff member at M.I.T. Lincoln Laboratory, Lexington,
Massachusetts. In 1980, he joined the Sensor Processing Technology Group of M.I.T.,
Lincoln Laboratory, Lexington, Massachusetts where he worked on problems in multi-
dimensional digital signal processing and image processing. Since 1983 he has been a
member of the Speech Systems Technology Group at Lincoln Laboratory where he has
been involved in digital signal processing for speech and audio applications, underwa-
ter sound enhancement, and data communications. He has contributed many publica-
tions to journals and conference proceedings, written several patents, and co-authored
chapters in numerous edited books including: Advanced Topics in Signal Processing
(Prentice Hall, 1987), Advances in Speech Signal Processing (Marcel Dekker, 1991),
and Speech Coding and Synthesis (Elsevier, 1995). He holds the position of Lecturer
at MIT where he has developed the graduate course Digital Speech Processing, and is
active in advising graduate students on the MIT campus. Dr. Quatieri is the recipient
of the 1982 Paper Award of the IEEE Acoustics, Speech and Signal Processing So-
ciety for the paper, “Implementation of 2-D Digital Filters by Iterative Methods”. In
1990, he received the IEEE Signal Processing Society’s Senior Award for the paper,
“Speech Analysis/Synthesis Based on a Sinusoidal Representation”, published in the
IEEE Transactions on Acoustics, Speech and Signal Processing, and in 1994 won this
same award for the paper “Energy Separation in Signal Modulations with Application
to Speech Analysis” which was also selected for the 1995 IEEE W.R.G. Baker Prize
Award. He was a member of the IEEE Digital Signal Processing Technical Committee,
from 1983 to 1992 served on the steering committee for the bi-annual Digital Signal
Processing Workshop, and was Associate Editor for the IEEE Transactions on Signal
Processing in the area of nonlinear systems.
Peter J.W. Rayner received the M.A. degree from Cambridge University, U.K., in
1968 and the Ph. D. degree from Aston University in 1969. Since 1968 he has been
with the Department of Engineering at Cambridge University and is Head of the Signal
Processing and Communications Research Group. In 1990 he was appointed to an
ad-hominem Readership in Information Engineering. He teaches course in random
signal theory, digital signal processing, image processing and communication systems.
His current research interests include image sequence restoration, audio restoration,
non-linear estimation and detection and time series modelling and classification.
Julius O. Smith received the B.S.E.E. degree from Rice University, Houston, TX, in
1975. He received the M.S. and Ph.D. degrees from Stanford University, Stanford, CA,
xxviii
APPLICATIONS OF DSP TO AUDIO AND ACOUSTICS
in 1978 and 1983, respectively. His Ph.D. research involved the application of digital
signal processing and system identification techniques to the modeling and synthesis of
the violin, clarinet, reverberant spaces, and other musical systems. From 1975 to 1977
he worked in the Signal Processing Department at ESL in Sunnyvale, CA, on systems
for digital communications. From 1982 to 1986 he was with the Adaptive Systems
Department at Systems Control Technology in Palo Alto, CA, where he worked in the
areas of adaptive filtering and spectral estimation. From 1986 to 1991 he was employed
at NeXT Computer, Inc., responsible for sound, music, and signal processing software
for the NeXT computer workstation. Since then he has been an Associate Professor
at the Center for Computer Research in Music and Acoustics (CCRMA), Stanford
University, teaching courses in signal processing and music technology, and pursuing
research in signal processing techniques applied to musical instrument modeling, audio
spectral modeling, and related topics.
INTRODUCTION
Karlheinz Brandenburg and Mark Kahrs
With the advent of multimedia, digital signal processing (DSP) of sound has emerged
from the shadow of bandwidth-limited speech processing. Today, the main appli-
cations of audio DSP are high quality audio coding and the digital generation and
manipulation of music signals. They share common research topics including percep-
tual measurement techniques and analysis/synthesis methods. Smaller but nonetheless
very important topics are hearing aids using signal processing technology and hardware
architectures for digital signal processing of audio. In all these areas the last decade
has seen a significant amount of application oriented research.
The topics covered here coincide with the topics covered in the biannual work-
shop on “Applications of Signal Processing to Audio and Acoustics”. This event is
sponsored by the IEEE Signal Processing Society (Technical Committee on Audio
and Electroacoustics) and takes place at Mohonk Mountain House in New Paltz, New
York.
A short overview of each chapter will illustrate the wide variety of technical material
presented in the chapters of this book.
John Beerends: Perceptual Measurement Techniques. The advent of perceptual
measurement techniques is a byproduct of the advent of digital coding for both speech
and high quality audio signals. Traditional measurement schemes are bad estimates for
the subjective quality after digital coding/decoding. Listening tests are subject to sta-
tistical uncertainties and the basic question of repeatability in a different environment.
John Beerends explains the reasons for the development of perceptual measurement
techniques, the psychoacoustic fundamentals which apply to both perceptual measure-
ment and perceptual coding and explains some of the more advanced techniques which
have been developed in the last few years. Completed and ongoing standardization
efforts concludes his chapter. This is recommended reading not only to people inter-
ested in perceptual coding and measurement but to anyone who wants to know more
about the psychoacoustic fundamentals of digital processing of sound signals.
xxx
APPLICATIONS OF DSP TO AUDIO AND ACOUSTICS
Karlheinz Brandenburg: Perceptual Coding of High Quality Digital Audio.
High quality audio coding is rapidly progressing from a research topic to widespread
applications. Research in this field has been driven by a standardization process within
the Motion Picture Experts Group (MPEG). The chapter gives a detailed introduction
of the basic techniques including a study of filter banks and perceptual models. As the
main example, MPEG Audio is described in full detail. This includes a description of
the new MPEG-2 Advanced Audio Coding (AAC) standard and the current work on
MPEG-4 Audio.
William G. Gardner: Reverberation Algorithms. This chapter is the first in a
number of chapters devoted to the digital manipulation of music signals. Digitally
generated reverb was one of the first application areas of digital signal processing
to high quality audio signals. Bill Gardner gives an in depth introduction to the
physical and perceptual aspects of reverberation. The remainder of the chapter treats
the different types of artificial reverberators known today. The main quest in this
topic is to generate natural sounding reverb with low cost. Important milestones in the
research, various historic and current types of reverberators are explained in detail.
Simon Godsill, Peter Rayner and Olivier Cappé: Digital Audio Restoration.
Digital signal processing of high quality audio does not stop with the synthesis or
manipulation of new material: One of the early applications of DSP was the manipula-
tion of sounds from the past in order to restore them for recording on new or different
media. The chapter presents the different methods for removing clicks, noise and other
artifacts from old recordings or film material.
Mark Kahrs: Digital Audio System Architecture. An often overlooked part of the
processing of high quality audio is the system architecture. Mark Kahrs introduces
current technologies both for the conversion between analog and digital world and
the processing technologies. Over the years there is a clear path from specialized
hardware architectures to general purpose computing engines. The chapter covers
specialized hardware architectures as well as the use of generally available DSP chips.
The emphasis is on high throughput digital signal processing architectures for music
synthesis applications.
James M. Kates: Signal Processing for Hearing Aids. A not so obvious application
area for audio signal processing is the field of hearing aids. Nonetheless this field
has seen continuous research activities for a number of years and is another field
where widespread application of digital technologies is under preparation today. The
chapter contains an in-depth treatise of the basics of signal processing for hearing
aids including the description of different types of hearing loss, simpler amplification
INTRODUCTION
xxxi
and compression techniques and current research on multi-microphone techniques and
cochlear implants.
Jean Laroche: Time and Pitch Scale Modification of Audio Signals. One of
the conceptionally simplest problems of the manipulation of audio signals is difficult
enough to warrant ongoing research for a number of years: Jean Laroche explains
the basics of time and pitch scale modification of audio signals for both speech and
musical signals. He discusses both time domain and frequency domain methods
including methods specially suited for speech signals.
Dana C. Massie: Wavetable Sampling Synthesis. The most prominent example
today of the application of high quality digital audio processing is wavetable sam-
pling synthesis. Tens of millions of computer owners have sound cards incorporating
wavetable sampling synthesis. Dana Massie explains the basics and modern technolo-
gies employed in sampling synthesis.
T.F. Quatieri and R.J. McAulay: Audio Signal Processing Based on Sinusoidal
Analysis/Synthesis. One of the basic paradigms of digital audio analysis, coding
(i.e. analysis/synthesis) and synthesis systems is the sinusoidal model. It has been
used for many systems from speech coding to music synthesis. The chapter contains
the unified view of both the basics of sinusoidal analysis/synthesis and some of the
applications.
Julius O. Smith III: Principles of Digital Waveguide Models of Musical Instru-
ments. This chapter describes a recent research topic in the synthesis of music
instruments: Digital waveguide models are one method of physical modeling. As in
the case of the Vocoder for speech, a model of an existing or hypothetical instrument
is used for the sound generation. In the tutorial the vibrating string is taken as the
principle illustrative example. Another example using the same underlying principles
is the acoustic tube. Complicated instruments are derived by adding signal scattering
and reed-bore or bow-string interactions.
Summary This book was written to serve both as a text book for an advanced
graduate course on digital signal processing for audio or as a reference book for the
practicing engineer. We hope that this book will stimulate further research and interest
in this fascinating and exciting field.
This page intentionally left blank.
1
AUDIO QUALITY DETERMINATION
BASED ON PERCEPTUAL
MEASUREMENT TECHNIQUES
John G. Beerends
Royal PTT Netherlands N.V.
KRN Research, P. Box 421, AK Leidenham
The Netherlands
Abstract: A new, perceptual, approach to determine audio quality is discussed.
The method does not characterize the audio system under test but characterizes the
perception of the output signal of the audio system. By comparing the degraded output
with the ideal (reference), using a model of the human auditory system, predictions can
be made about the subjectively perceived audio quality of the system output using any
input signal. A perceptual model is used to calculate the internal representations of both
the degraded output and reference. A simple cognitive model interprets differences
between the internal representations. The method can be used for quality assessment
of wideband music codecs as well as for telephone-band (300-3400 Hz) speech codecs.
The correlation between subjective and objective results is above 0.9 for a wide variety
of databases derived from subjective quality evaluations of music and speech codecs.
For the measurement of quality of telephone-band speech codecs a simplified method
is given. This method was standardized by the International Telecommunication Union
(Telecom sector) as recommendation P.861.
1.1 INTRODUCTION
With the introduction and standardization of new, perception based, audio (speech
and music) codecs, [ISO92st, 1993], [ISO94st, 1994], [ETSIstdR06, 1992], [CCIT-
2
APPLICATIONS OF DSP TO AUDIO AND ACOUSTICS
TrecG728, 1992], [CCITTrecG729, 1995], classical methods for measuring audio
quality, like signal to noise ratio and total harmonic distortion, became useless.
During the standardization process of these codecs the quality of the different proposals
was therefore assessed only subjectively (see e.g. [Natvig, 1988], [ISO90, 1990] and
[ISO91, 1991]). Subjective assessments are however time consuming, expensive and
difficult to reproduce.
A fundamental question is whether objective methods can be formulated that can
be used for prediction of the subjective quality of such perceptual coding techniques in
a reliable way. A difference with classical approaches to audio quality assessment is
that system characterizations are no longer useful because of the time varying, signal
adaptive, techniques that are used in these codecs. In general the quality of modern
audio codecs is dependent on the input signal. The newly developed method must
therefore be able to measure the quality of the codec using any audio signal, that is
speech, music and test signals. Methods that rely on test signals only, either with or
without making use of a perceptual model, can not be used.
This chapter will present a general method for measuring the quality of audio
devices including perception based audio codecs. The method uses the concept of the
internal sound representation, the representation that matches as close as possible the
one that is used by subjects in their quality judgement. The input and output of the
audio device are mapped onto the internal signal representation and the difference in
this representation is used to define a perceptual audio quality measure (PAQM). It
will be shown that this PAQM has a high correlation with the subjectively perceived
audio quality especially when differences in the internal representation are interpreted,
in a context dependent way, by a cognitive module. Furthermore a simplified method,
derived from PAQM, for measuring the quality of telephone-band (300-3400 Hz)
speech codecs is presented. This method was standardized by the ITU-T (International
Telecommunication Union - Telecom sector) as recommendation P.861 [ITUTrecP861,
1996].
1.2 BASIC MEASURING PHILOSOPHY
In the literature on measuring the quality of audio devices one mostly finds measure-
ment techniques that characterize the audio device under test. The characterization
either has build in knowledge of human auditory perception or the characterization has
to be interpreted with knowledge of human auditory perception.
For linear, time-invariant systems a complete characterization is given by the im-
pulse or complex frequency response [Papoulis, 1977]. With perceptual interpretation
of this characterization one can determine the audio quality of the system under test.
If the design goal of the system under test is to be transparent (no audible differences
between input and output) then quality evaluation is simple and brakes down to the
AUDIO QUALITY DETERMINATION USING PERCEPTUAL, MEASUREMENT
3
requirement of a flat amplitude and phase response (within a specified template) over
the audible frequency range (20-20000 Hz).
For systems that are nearly linear or time-variant, the concept of the impulse (com-
plex frequency) response is still applicable. For weakly non-linear systems the char-
acterization can be extended by including measurements of the non-linearity (noise,
distortion, clipping point). For time-variant systems the characterization can be ex-
tended by including measurements of the time dependency of the impulse response.
Some of the additional measurements incorporate knowledge of the human auditory
system which lead to system characterizations that have a direct link to the perceived
audio quality (e.g. the perceptually weighted signal to noise ratio).
The advantage of the system characterization approach is that it is (or better that
it should be) largely independent of the test signals that are used. The characteriza-
tions can thus be measured with standardized signals and measurement procedures.
Although the system characterization is mostly independent of the signal the subjec-
tively perceived quality in most cases depends on the audio signal that is used. If we
take e.g. a system that adds white noise to the input signal then the perceived audio
quality will be very high if the input signal is wideband. The same system will show
a low audio quality if the input signal is narrowband. For a wideband input signal
the noise introduced by the audio system will be masked by the input signal. For a
narrowband input signal the noise will be clearly audible in frequency regions where
there is no input signal energy. System characterizations therefore do not characterize
the perceived quality of the output signal.
A disadvantage of the system characterization approach is that although the char-
acterization is valid for a wide variety of input signals it can only be measured on
the basis of knowledge of the system, This leads to system characterizations that are
dependent on the type of system that is tested. A serious drawback in the system
characterization approach is that it is extremely difficult to characterize systems that
show a non-linear and time-variant behavior.
An alternative approach to the system characterization, valid for any system, is the
perceptual approach. In the context of this chapter a perceptual approach is defined
as an approach in which aspects of human perception are modelled in order to make
measurements on audio signals that have a high correlation with the subjectively
perceived quality of these signals and that can be applied to any signal, that is, speech,
music and test signals.
In the perceptual approach one does not characterize the system under test but one
characterizes the audio quality of the output signal of the system under test. It uses
the ideal signal as a reference and an auditory perception model to determine the
audible differences between the output and the ideal. For audio systems that should be
transparent the ideal signal is the input signal. An overview of the basic philosophy
used in perceptual audio quality measurement techniques is given in Fig. 1.1.
4
APPLICATIONS OF DSP TO AUDIO AND ACOUSTICS
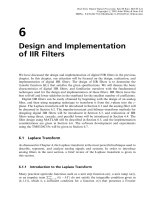
Figure 1.1 Overview of the basic philosophy used in the development of perceptual
audio quality measurement techniques. A computer model of the subject is used to
compare the output of the device under test (e.g. a speech codec or a music codec)
with the ideal, using any audio signal. If the device under test must be transparent then
the ideal is equal to the input.
AUDIO QUALITY DETERMINATION USING PERCEPTUAL MEASUREMENT
5
If the perceptual approach is used for the prediction of subjectively perceived audio
quality of the output of a linear, time-invariant system then the system characterization
approach and the perceptual approach must lead to the same answer, In the system
characterization approach one will first characterize the system and then interpret the
results using knowledge of both the auditory system and the input signal for which one
wants to determine the quality. In the perceptual approach one will characterize the
perceptual quality of the output signals with the input signals as a reference.
The big advantage of the perceptual approach is that it is system independent and
can be applied to any system, including systems that show a non-linear and time-
variant behavior. A disadvantage is that for the characterization of the audio quality of
a system one needs a large set of relevant test signals (speech and music signals).
In this chapter an overview is presented of the perceptual audio quality measure
(PAQM) [Beerends and Stemerdink, 1992] and it will be shown that the PAQM ap-
proach can be used for the measurement of the quality of music and speech codecs.
The PAQM method is currently under study within the ITU-R (International Telecom-
munication Union - Radio sector) [ITURsg10con9714, 1997], [ITURsg 10con9719,
1997] for future standardization of a perception based audio quality measurement
method. A simplified method, derived from PAQM, for measuring the quality of
telephone-band (300-3400 Hz) speech codecs was standardized by the ITU-T (In-
ternational Telecommunication Union - Telecom sector) as recommendation P.861
[ITUTrecP861, 1996] [ITUTsg 12rep31.96, 1996]. Independent validation of this
simplified method, called perceptual speech quality measure (PSQM), showed supe-
rior correlation between objective and subjective results, when compared to several
other methods [ITUTsg12con9674, 1996].
A general problem in the development of perceptual measurement techniques is
that one needs audio signals for which the subjective quality, when compared to a
reference, is known. Creating databases of audio signals and their subjective quality
is by no means trivial and many of the problems that are encountered in subjective
testing have a direct relation to problems in perceptual measurement techniques. High
correlations between objective and subjective results can only be obtained when the
objective and subjective evaluation are closely related, In the next section some
1992], [Ghitza, 1994] [Beerends and Stemerdink, 1994b] or on music codec quality
[Paillard et al., 1992], [Brandenburg and Sporer, 1992], [Beerends and Stemerdink,
1992] [Colomes et al., 1994]. Although one would expect that a model for the
measurement of the quality of wide band music codecs can be applied to telephone-
band speech codecs, recent investigations show that this is rather difficult [Beerends,
1995].
[Schroeder et al., 1979], [Gray et al., 1980], [Nocerino et al., 1985], [Quackenbush
et al., 1988], Hayashi and Kitawaki, 1992], [Halka and Heute, 1992], [Wang et al.,
Until recently several perceptual measurement techniques have been proposed but
most of them are either focussed on speech codec quality [Gray and Markel, 1976],
6 APPLICATIONS OF DSP TO AUDIO AND ACOUSTICS
important points of discussion are given concerning the relation between subjective
and objective perceptual testing.
1.3 SUBJECTIVE VERSUS OBJECTIVE PERCEPTUAL TESTING
Before one can start predicting MOS scores several problems have to be solved, The
first one is that different subjects have different auditory systems leading to a large range
of possible models. If one wants to determine the quality of telephone-band speech
codecs (300-3400 Hz) differences between subjects are only of minor importance.
In the determination of the quality of wideband music codecs (compact disc quality,
20-20000 Hz) differences between subjects are a major problem, especially if the
codec shows dynamic band limiting in the range of 10-20 kHz. Should an objective
In general it is not allowed to compare MOS values obtained in different experi-
mental contexts. A telephone-band speech fragment may have a MOS that is above
4.0 in a certain experimental context while the same fragment may have a MOS that is
lower than 2.0 in another context. Even if MOS values are obtained within the same
experimental context but within a different cultural environment large differences in
MOS values can occur [Goodman and Nash, 1982]. It is therefore impossible to de-
velop a perceptual measurement technique that will predict correct MOS values under
all conditions.
In the speech codec evaluations, absolute category rating (ACR) was carried out with
quality labels ranging from bad (MOS=1.0) to excellent (MOS=5.0) [CCITTrecP80,
1994]. In ACR experiments subjects do not have access to the original uncoded
audio signal. In music codec evaluations a degradation category rating (DCR) scale
was employed with quality labels ranging from “difference is audible and very
annoying” (MOS=1.0) to “no perceptible difference” (MOS=5.0). The music codec
databases used in this paper were all derived from DCR experiments where subjects
had a known and a hidden reference [ITURrecBS1116, 1994].
All the subjective results that will be used in this chapter come from large ITU
databases for which subjects were asked to give their opinion on the quality of an audio
fragment using a five point rating scale. The average of the quality judgements of the
subjects gives a so called mean opinion score (MOS) on a five point scale, Subjective
experiments in which the quality of telephone-band speech codecs (300-3400 Hz)
or wideband music codecs (20-20000 Hz compact disc quality) were evaluated are
used. For both, speech and music codec evaluation, the five point ITU MOS scale is
used but the procedures in speech codec evaluation [CCITTrecP80, 1994] are different
from the experimental procedures in music codec evaluation [CCIRrec562, 1990],
[ITURrecBS1116, 1994].
In the development of perceptual measurement techniques one needs databases with
reliable quality judgements, preferably using the same experimental setup and the same
common subjective quality scale.
AUDIO QUALITY DETERMINATION USING PERCEPTUAL MEASUREMENT
7
perceptual measurement technique use an auditory model that represents the best
available (golden) ear, just model the average subject, or use an individual model for
each subject [Treurniet, 1996]. The answer depends on the application. For prediction
of mean opinion scores one has to adapt the auditory model to the average subject.
In this chapter all perceptual measurements were done with a threshold of an average
subject with an age between 20 and 30 years and an upper frequency audibility limit
of 18 kHz. No accurate data on the subjects were available.
Another problem in subjective testing is that the way the auditory stimulus is
presented has a big influence on the perceived audio quality. Is the presentation is in
a quiet room or is there some background noise that masks small differences? Are the
stimuli presented with loudspeakers that introduce distortions, either by the speaker
itself or by interaction with the listening room? Are subjects allowed to adjust the
volume for each audio fragment? Some of these differences, like loudness level and
background noise, can be modelled in the perceptual measurement fairly easy, whereas
for others it is next to impossible. An impractical solution to this problem is to make
recordings of the output signal of the device under test and the reference signal (input
signal) at the entrance of the ear of the subjects and use these signals in the perceptual
evaluation.
In this chapter all objective perceptual measurements are done directly on the
electrical output signal of the codec using a level setting that represents the average
listening level in the experiment. Furthermore the background noise present during
the listening experiments was modelled using a steady state Hoth noise [CCITTsup13,
1989]. In some experiments subjects were allowed to adjust the level individually for
each audio fragment which leads to correlations that are possibly lower than one would
get if the level in the subjective experiment would be fixed for all fragments. Correct
setting of the level turned out be very important in the perceptual measurements.
It is clear that one can only achieve high correlations between objective measure-
ments and subjective listening results when the experimental context is known and can
be taken into account correctly by the perceptual or cognitive model.
The perceptual model as developed in this chapter is used to map the input and
output of the audio device onto internal representations that are as close as possible
to the internal representations used by the subject to judge the quality of the audio
device. It is shown that the difference in internal representation can form the basis
of a perceptual audio quality measure (PAQM) that has a high correlation with the
subjectively perceived audio quality. Furthermore it is shown that with a simple
cognitive module that interprets the difference in internal representation the correlation
between objective and subjective results is always above 0.9 for both wideband music
and telephone-band speech signals. For the measurement of the quality of telephone-
band speech codecs a simplified version of the PAQM, the perceptual speech quality
measure (PSQM), is presented.
8
APPLICATIONS OF DSP TO AUDIO AND ACOUSTICS
Before introducing the method for calculating the internal representation the psy-
choacoustic fundamentals of the perceptual model is explained in the next chapter.
1.4 PSYCHOACOUSTIC FUNDAMENTALS OF CALCULATING THE
INTERNAL SOUND REPRESENTATION
In thinking about how to calculate the internal representation of a signal one could
dream of a method where all the transformation characteristics of the individual el-
ements of the human auditory system would be measured and modelled. In this
exact approach one would have the, next to impossible, task of modelling the ear, the
transduction mechanism and the neural processing at a number of different abstraction
levels.
Literature provides examples of the exact approach [Kates, 1991b], [Yang et al.,
1992], [Giguère and Woodland, 1994a], [Giguère and Woodland, 1994b] but no results
on large subjective quality evaluation experiments have been published yet. Prelimi-
nary results on using the exact approach to measure the quality of speech codecs have
been published (e.g. [Ghitza, 1994]) but show rather disappointing results in terms of
correlation between objective and subjective measurements. Apparently it is very diffi-
cult to calculate the correct internal sound representation on the basis of which subjects
judge sound quality. Furthermore it may not be enough to just calculate differences in
internal representations, cognitive effects may dominate quality perception.
One can doubt whether it is necessary to have an exact model of the lower abstraction
levels of the auditory system (outer-, middle-, inner ear, transduction). Because audio
quality judgements are, in the end, a cognitive process a crude approximation of the
internal representation followed by a crude cognitive interpretation may be more ap-
propriate then having an exact internal representation without cognitive interpretation
of the differences.
In finding a suitable internal representation one can use the results of psychoacoustic
experiments in which subjects judge certain aspects of the audio signal in terms of
psychological quantities like loudness and pitch. These quantities already include
a certain level of subjective interpretation of physical quantities like intensity and
frequency. This psychoacoustic approach has led to a wide variety of models that
can predict certain aspects of a sound e.g. [Zwicker and Feldtkeller, 1967], [Zwicker,
1977], [Florentine and Buus, 1981], [Martens, 1982], [Srulovicz and Goldstein, 1983],
[Durlach et al., 1986], [Beerends, 1989], [Meddis and Hewitt, 1991]. However, if one
wants to predict the subjectively perceived quality of an audio device a large range of the
different aspects of sound perception has to be modelled. The most important aspects
that have to be modelled in the internal representation are masking, loudness of partially
masked time-frequency components and loudness of time-frequency components that
are not masked.
AUDIO QUALITY DETERMINATION USING PERCEPTUAL MEASUREMENT
9
Figure 1.2 From the masking pattern it can be seen that the excitation produced by a
sinusoidal tone is smeared out in the frequency domain. The right hand slope of the
excitation pattern is seen to vary as a function of masker intensity (steep slope at low
and flat slope at high intensities).
(Reprinted with permission from [Beerends and Stemerdink, 1992], ©Audio Engi-
neering Society, 1992)
For stationary sounds the internal representation is best described by means of a
spectral representation. The internal representation can be measured using a test signal
having a small bandwidth. A schematic example for a single sinusoidal tone (masker)
is given in Fig. 1.2 where the masked threshold of such a tone is measured with a
second sinusoidal probe tone (target). The masked threshold can be interpreted as
resulting from an internal representation that is given in Fig. 1.2 as an excitation
pattern. Fig. 1.2 also gives an indication of the level dependence of the excitation
pattern of a single sinusoidal tone. This level dependence makes interpretations in
terms of filterbanks doubtful.
For non-stationary sounds the internal representation is best described by means of
a temporal representation. The internal representation can be measured by means of a
test signal of short duration. A schematic example for a single click (masker) is given
in Fig. 1.3 where the masked threshold of such a click is measured with a second click
(target). The masked threshold can be interpreted as the result of an internal, smeared
out, representation of the puls (Fig. 1.3, excitation pattern).
10
APPLICATIONS OF DSP TO AUDIO AND ACOUSTICS
Figure 1.3 From the masking pattern it can be seen that the excitation produced by a
click is smeared out in the time domain.
(Reprinted with permission from [Beerends and Stemerdink, 1992], ©Audio Engi-
neering Society, 1992)
An example of a combination of time and frequency-domain masking, using a tone
burst, is given in Fig. 1.4.
For the examples given in Figs. 1.2-1.4 one should realize that the masked threshold
is determined with a target signal that is a replica of the masker signal. For target
signals that are different from the masker signal (e.g. a sine that masks a band of noise)
the masked threshold looks different, making it impossible to talk about the masked
threshold of a signal. The masked threshold of a signal depends on the target, while
the internal representation and the excitation pattern do not depend on the target.
In Figs. 1.2-1.4 one can see that any time-frequency component in the signal is
smeared out along both the time and frequency axis. This smearing of the signal
results in a limited time-frequency resolution of the auditory system. Furthermore it
is known that two smeared out time-frequency components in the excitation domain
do not add up to a combined excitation on the basis of energy addition. Therefore the
smearing consists of two parts, one part describing how the energy at one point in the
time-frequency domain results in excitation at another point, and a part that describes
how the different excitations at a certain point, resulting from the smearing of the
individual time-frequency components, add up.
Until now only time-frequency smearing of the audio signal by the ear, which leads
to an excitation representation, has been described. This excitation representation is
generally measured in dB SPL (Sound Pressure Level) as a function of time and
frequency. For the frequency scale one does, in most cases, not use the linear Hz
scale but the non-linear Bark scale. This Bark scale is a pitch scale representing the
11
AUDIO QUALITY DETERMINATION USING PERCEPTUAL MEASURE
Figure 1.4 Excitation pattern for a short tone burst. The excitation produced by a short
tone burst is smeared out in the time and frequency domain.
(Reprinted with permission from [Beerends and Stemerdink, 1992], ©Audio Engi-
neering Society, 1992)
psychophysical equivalent of frequency. Although smearing is related to an important
property of the human auditory system, viz. time-frequency domain masking, the
resulting representation in the form of an excitation pattern is not very useful yet. In
order to obtain an internal representation that is as close as possible to the internal
representation used by subjects in quality evaluation one needs to compresses the
excitation representation in a way that reflects the compression as found in the inner
ear and in the neural processing.
The compression that is used to calculate the internal representation consists of
a transformation rule from the excitation density to the compressed Sone density as
formulated by Zwicker [Zwicker and Feldtkeller, 1967]. The smearing of energy
is mostly the result of peripheral processes [Viergever, 1986) while compression is a
more central process [Pickles, 1988]. With the two simple mathematical operations,
smearing and compression, it is possible to model the masking properties of the
auditory system not only at the masked threshold, but also the partial masking [Scharf,
1964] above masked threshold (see Fig. 1.5).
12
APPLICATIONS OF DSP TO AUDIO AND ACOUSTICS
Figure 1.5 Overview on how masking is modelled in the internal representation model.
Smearing and compression with
= E
0.04
results in masking. The first representation
(top) is in terms of power
P
and may represent clicks in the time domain or sines in
the frequency domain. X represents the signal, or masker, and N the noise, or target.
The left side shows transformations of the masker, in the middle the transformation of
the target in isolation. The right side deals with the transformation of the composite
signal (masker + target). The second representation is in terms of excitation
E
and
shows the excitation as a function of time or frequency. The third representation is
the internal representation using a simple compression =
E
0.04
.
The bottom line
shows the effect of masking, the internal representation of the target in isolation, (N),
is significantly larger than the internal representation of the target in the presence of a
strong masker
(X+N) -
(X).
(Reprinted with permission from [Beerends, 1995], ©Audio Engineering Society,
1995)
AUDIO QUALITY DETERMINATION USING PERCEPTUAL MEASUREMENT
13
1.5
COMPUTATION OF THE INTERNAL SOUND REPRESENTATION
As a start in the quantification of the two mathematical operations, smearing and
compression, used in the internal representation model one can use the results of
psychoacoustic experiments on time-frequency masking and loudness perception. The
frequency smearing can be derived from frequency domain masking experiments where
a single steady-state narrow-band masker and a single steady-state narrow-band target
are used to measure the slopes of the masking function [Scharf and Buus, 1986],
[Moore, 1997]. These functions depend on the level and frequency of the masker
signal. If one of the signals is a small band of noise and the other a pure tone then the
slopes can be approximated by Eq. (1.1) (see Terhardt 1979, [Terhardt, 1979]):
S
1
= 31 dB/Bark, target frequency < masker frequency;
(1.1)
S
2
= (22 + min(230/f, 10) – 0.2
L
) dB/Bark,
target frequency > masker frequency;
with f the masker frequency in Hz and L the level in dB SPL. A schematic example
of this frequency-domain masking is shown in Fig. 1.2. The masked threshold can be
interpreted as resulting from a smearing of the narrow band signals in the frequency
domain (see Fig. 1.2). The slopes as given in Eq. (1.1) can be used as an
approximation of the smearing of the excitation in the frequency domain in which case
the masked threshold can be interpreted as a fraction of the excitation.
If more than one masker is present at the same time the masked energy threshold
of the composite signal M
composite
is not simply the sum of the n individual masked
energy thresholds M
i
but is given approximately by:
(1.2)
This addition rule holds for simultaneous (frequency-domain) [Lufti, 1983], [Lufti,
1985] and non-simultaneous (time-domain) [Penner, 1980], [Penner and Shiffrin,
1980] masking [Humes and Jesteadt, 1989] although the value of the compression
power
α
may be different along the frequency (
α
freq
) and time (
α
time
) axis.
In the psychoacoustic model that is used in this chapter no masked threshold is
calculated explicitly in any form. Masking is modelled by a combination of smearing
and compression as explained in Fig. 5. Therefore the amount of masking is dependent
on the parameters α
freq
and
α
time
which determine, together with the slopes S
1
and
S
2
, the amount of smearing. However the values for
α
freq
and
α
time
found in literature
were optimized with respect to the masked threshold and can thus not be used in our
14
APPLICATIONS OF DSP TO AUDIO AND ACOUSTICS
model. Therefore these two α's will be optimized in the context of audio quality
measurements.
In the psychoacoustic model the physical time-frequency representation is calcu-
lated using a FFT with a 50% overlapping Hanning (sin²) window of approximately
40 ms, leading to a time resolution of about 20 ms. Within this window the frequency
components are smeared out according to Eq. (1.1) and the excitations are added
according to Eq. (1.2) Due to the limited time resolution only a rough approximation
of the time-domain smearing can be implemented.
From masking data found in the literature [Jesteadt et al., 1982] an estimate was
made how much energy is left in a frame from a preceding frame using a shift of half
a window (50% overlap). This fraction can be expressed as a time constant
τ in the
expression:
with
∆t = time distance between two frames = T
f
. The fraction of the energy present
in the next window depends on the frequency and therefore a different
τ was used for
each frequency band. This energy fraction also depends on the level of the masker
[Jesteadt et al., 1982] but this level-dependency of
τ yielded no improvement in the
correlation and was therefore omitted from the model. At frequencies above 2000 Hz
the smearing is dominated by neural processes and remains about the same [Pickles,
1988]. The values of
τ are given in Fig. 1.6 and give an exponential approximation of
time-domain masking using window shifts in the neighborhood of 20 ms.
An example of the decomposition of a sinusoidal tone burst in the time-frequency
domain is given in Fig. 1.4. It should be realised that these time constants
τ only
give an exponential approximation, at the distance of half a window length, of the
time-domain masking functions.
After having applied the time-frequency smearing operation one gets an excitation
pattern representation of the audio signal in (dB
exc
, seconds, Bark). This representation
is then transformed to an internal representation using a non-linear compression
function. The form of this compression function can be derived from loudness
experiments.
Scaling experiments using steady-state signals have shown that the loudness of
a sound is a non-linear function of the intensity. Extensive measurements on the
relationship between intensity and loudness have led to the definition of the Sone. A
steady-state sinusoid of 1 kHz at a level of 40 dB SPL is defined to have a loudness of one
Sone. The loudness of other sounds can be estimated in psychoacoustic experiments.
In a first approximation towards calculating the internal representation one would map
the physical representation in dB/Bark onto a representation in Sone/Bark:
(1.4)
in which k is a scaling constant (about 0.01), P the level of the tone in µPa, P
0
the
absolute hearing threshold for the tone in µPa, and γ the compression parameter, in
Figure 1.6 Time constant
τ
, that is used in the time-domain smearing, as a function of
frequency. This function is only valid for window shifts of about 20 ms and only allows
a crude estimation of the time-domain smearing, using a
α
time
of 0.6.
(Reprinted with permission from [Beerends and Stemerdink, 1992], ©Audio Engi-
neering Society, 1992)
the literature estimated to be about 0.6 [Scharf and Houtsma, 1986]. This compression
relates a physical quantity (acoustic pressure
P
) to a psychophysical quantity (loudness
).
The Eqs (1.1), (1.2) and (1.4) involve quantities that can be measured directly.
After application of Eq. (1.1) to each time frequency component and addition of all the
individual excitation contributions using (1.2), the resulting excitation pattern forms
the basis of the internal representation. (The exact method to calculate the excitation
pattern is given in Appendix A, B and C of [Beerends and Stemerdink, 1992] while a
compact algorithm is given in Appendix D of [Beerends and Stemerdink, 1992]).
Because Eq. (1.4) maps the physical domain directly to the internal domain it has
to be replaced by a mapping from the excitation to the internal representation. Zwicker
gave such a mapping (eq. 52,17 in [Zwicker and Feldtkeller, 1967]):
(1.5)
in which k is an arbitrary scaling constant, E the excitation level of the tone, E
0
the excitation at the absolute hearing threshold for the tone, s the “schwell” factor as
defined by Zwicker [Zwicker and Feldtkeller, 1967] and
γ a compression parameter
that was fitted to loudness data. Zwicker found an optimal value
γ of about 0.23.
Although the
γ of 0.23 may be optimal for the loudness scale it will not be appro-
priate for the subjective quality model which needs an internal representation that is
AUDIO QUALITY DETERMINATION USING PERCEPTUAL MEASUREMENT
15
16
APPLICATIONS OF DSP TO AUDIO AND ACOUSTICS
as close as possible to the representation that is used by subjects to base their qual-
ity judgements on. Therefore
γ is taken as a parameter which can be fitted to the
masking behavior of the subjects in the context of audio quality measurements. The
scaling k has no influence on the performance of the model. The parameter
γ was
fitted to the ISO/MPEG 1990 (International Standards Organization/Motion Picture
Expert Group) database [ISO90, 1990] in terms of maximum correlation (minimum
deviation) between objective and subjective results.
The composite operation, smearing followed by compression, results in partial
masking (see Fig. 1.5). The advantage of this method is that the model automatically
gives a prediction of the behavior of the auditory system when distortions are above
masked threshold.
Summarizing, the model uses the following transformations (see Fig. 1.7):
The input signal x
(
t
) and output signal y(
t
) are transformed to the frequency
domain, using an FFT with a Hanning (sin²) window w(
t
) of about 40 ms.
This leads to the physical signal representations P
x
(t, f ) and P
y
( t,f) in (dB,
seconds, Hz) with a time-frequency resolution that is good enough as a starting
point for the time-frequency smearing.
The frequency scale f (in Hz) is transformed to a pitch scale z (in Bark) and the
signal is filtered with the transfer function a
0
(
z) from outer to inner ear (free or
diffuse field). This results in the power-time-pitch representations p
(
x
t, z) and
p
y
(t, z) measured in (dB, seconds, Bark). A more detailed description of this
transformation is given in Appendix A of [Beerends and Stemerdink, 1992].
The power-time-pitch representations p
x
(
t, z) and p
y
(t, z) are multiplied with
a frequency-dependent fraction e
–T
f
/
τ
z
(
)
using Eq. (1.3) and Fig. 1.6, for
addition with
α
time
within the next frame (
T
f
= time shift between two frames
≈ 20 ms). This models the time-domain smearing of x
(
t
) and y
(
t
).
The power-time-pitch representations p
x
(
t, z) and p
y
(t, z ) are convolved with
the frequency-smearing function
Λ
, as can be derived from Eq. (1.1), leading
to excitation-time-pitch (dB
exc
, seconds, Bark) representations E
x
(
t, z) and
E
y
(
t, z) (see Appendices B, C, D of [Beerends and Stemerdink, 1992]). The
form of the frequency-smearing function depends on intensity and frequency,
and the convolution is carried out in a non-linear way using Eq. (1.2) (see
Appendix C of [Beerends and Stemerdink, 1992]) with parameter
α
freq
.
The excitation-time-pitch representations E
x
(
t, z) and E
y
(
t, z) (dB
exc
, sec-
onds, Bark) are transformed to compressed loudness-time-pitch representations
x
(
t, z) and
y
(
t, z
) (compressed Sone, seconds, Bark) using Eq. (1.5) with
parameter γ (see Appendix E of [Beerends and Stemerdink, 1992]).
AUDIO QUALITY DETERMINATION USING PERCEPTUAL MEASUREMENT
17
In psychoacoustic literature many experiments on masking behavior can be found
for which the internal representation model should, in theory, be able to predict the
behavior of subjects. One of these effects is the sharpening of the excitation pattern
after switching off an auditory stimulus [Houtgast, 1977], which is partly modelled
implicitly here in the form of the dependence of the slope S
2
in Eq. (1.1) on intensity.
After “switching off” the masker the representation in the next frame in the model is
a “sharpened version of the previous frame”.
Another important effect is the asymmetry of masking between a tone masking
a band of noise versus a noiseband masking a tone [Hellman, 1972]. In models
using the masked threshold this effect has to be modelled explicitly by making the
threshold dependent on the type of masker e.g. by calculating a tonality index as
performed within the psychoacoustic models used in the ISO/MPEG audio coding
standard [ISO92st, 1993]. Within the internal representation approach this effect is
accounted for by the nonlinear addition of the individual time frequency components
in the excitation domain.
1.6 THE PERCEPTUAL AUDIO QUALITY MEASURE (PAQM)
After calculation of the internal loudness-time-pitch representations of the input and
output of the audio device the perceived quality of the output signal can be derived from
the difference between the internal representations. The density functions
x
(
t, z
)
(loudness density
as a function of time and pitch for the input
x
) and scaled
y
(
t, z
)
are subtracted to obtain a noise disturbance density function
n
(
t, z). This n
(
t, z) is
integrated over frequency resulting in a momentary noise disturbance
n
(
t
) (see Fig.
1.7)
The momentary noise disturbance is averaged over time to obtain the noise distur-
bance
n
. We will not use the term noise loudness because the value of
γ
is taken such
that the subjective quality model is optimized; in that case
n
does not necessarily
represent noise loudness. The logarithm (log
10
) of the noise disturbance is defined as
the perceptual audio quality measure (PAQM).
The optimization of
α
freq
, α
time
and γ is performed using the subjective audio
quality database that resulted from the ISO/MPEG 1990 audio codec test [ISO90,
1990]. The optimization used the standard error of the estimated MOS from a third
order regression line fitted through the PAQM, MOS datapoints. The optimization
was carried out by minimization of the standard error of the estimated MOS as a
function of
α
freq
,
α
time
,
γ
.
The compressed loudness-time-pitch representation
y
(
t, z) of the output of
the audio device is scaled independently in three different pitch ranges with
bounds at 2 and 22 Bark. This operation performs a global pattern matching
between input and output representations and already models some of the higher,
cognitive, levels of sound processing.
18
APPLICATIONS OF DSP TO AUDIO AND ACOUSTICS
Figure 1.7
Overview of the basic transformations which are used in the development
of the PAQM (Perceptual Audio Quality Measure). The signals x
(
t
) and y
(
t
) are
windowed with a window
w
(
t
) and then transformed to the frequency domain. The
power spectra as function of time and frequency,
P
x
(
t
, ƒ) and P
y
(
t
, ƒ) are transformed
to power spectra as function of time and pitch,
p
x
(
t
, z
)
and
p
y
(
t
, z) which are convolved
with the smearing function resulting in the excitations as a function of pitch E
x
(
t, z
)
and E
y
(
t
, z). After transformation with the compression function we get the internal
representations
x
(
t
,
z
)
and
y
(
t
,
z
)
from which the average noise disturbance
n
over the audio fragment can be calculated.
(Reprinted with permission from [Beerends and Stemerdink, 1992], ©Audio Engi-
neering Society, 1992)
AUDIO QUALITY DETERMINATION USING PERCEPTUAL MEASUREMENT
19
The optimal values of the parameters
α
freq
and
α
time
depend on the sampling of
the time-frequency domain. For the values used in our implementation,
∆ z = 0.2
Bark and
∆ t = 20 ms (total window length is about 40 ms), the optimal values of the
parameters in the model were found to be
α
freq
= 0.8, α
time
= 0.6 and γ = 0.04.
The dependence of the correlation on the time-domain masking parameter
α
time
turned
out to be small.
Because of the small
γ
that was found in the optimization the resulting density as
function of pitch (in Bark) and time does not represent the loudness density but a
compressed loudness density. The integrated difference between the density functions
of the input and the output therefore does not represent the loudness of the noise but
the compressed loudness of the noise.
The relationship between the objective (PAQM) and subjective quality measure
(MOS) in the optimal settings of
α
freq
,
α
time
and
γ
, for the ISO/MPEG 1990 database
[ISO90, 1990], is given in Fig. 1.8. ¹
Figure 1.8 Relation between the mean opinion score and the perceptual audio quality
measure (PAQM) for the 50 items of the ISO/MPEG 1990 codec test [ISO90, 1990] in
loudspeaker presentation.
(Reprinted with permission from [Beerends and Stemerdink, 1992], ©Audio Engi-
neering Society, 1992)