Introduction to Digital Signal Processing and Filter Design - Introduction
Bạn đang xem bản rút gọn của tài liệu. Xem và tải ngay bản đầy đủ của tài liệu tại đây (489.07 KB, 31 trang )
CHAPTER 1
Introduction
1.1 INTRODUCTION
We are living in an age of information technology. Most of this technology is
based on the theory of digital signal processing (DSP) and implementation of
the theory by devices embedded in what are known as digital signal processors
(DSPs). Of course, the theory of digital signal processing and its applications
is supported by other disciplines such as computer science and engineering, and
advances in technologies such as the design and manufacturing of very large
scale integration (VLSI) chips. The number of devices, systems, and applications
of digital signal processing currently affecting our lives is very large and there
is no end to the list of new devices, systems, and applications expected to be
introduced into the market in the coming years. Hence it is difficult to forecast
the future of digital signal processing and the impact of information technology.
Some of the current applications are described below.
1.2 APPLICATIONS OF DSP
Digital signal processing is used in several areas, including the following:
1. Telecommunications. Wireless or mobile phones are rapidly replacing
wired (landline) telephones, both of which are connected to a large-scale telecom-
munications network. They are used for voice communication as well as data
communications. So also are the computers connected to a different network
that is used for data and information processing. Computers are used to gen-
erate, transmit, and receive an enormous amount of information through the
Internet and will be used more extensively over the same network, in the com-
ing years for voice communications also. This technology is known as voice
over Internet protocol (VoIP) or Internet telephony. At present we can transmit
and receive a limited amount of text, graphics, pictures, and video images from
Introduction to Digital Signal Processing and Filter Design, by B. A. Shenoi
Copyright © 2006 John Wiley & Sons, Inc.
1
2
INTRODUCTION
mobile phones, besides voice, music, and other audio signals—all of which are
classified as multimedia—because of limited hardware in the mobile phones and
not the software that has already been developed. However, the computers can
be used to carry out the same functions more efficiently with greater memory and
large bandwidth. We see a seamless integration of wireless telephones and com-
puters already developing in the market at present. The new technologies being
used in the abovementioned applications are known by such terms as CDMA,
TDMA,
1
spread spectrum, echo cancellation, channel coding, adaptive equaliza-
tion, ADPCM coding, and data encryption and decryption, some of which are
used in the software to be introduced in the third-generation (G3) mobile phones.
2. Speech Processing. The quality of speech transmission in real time over
telecommunications networks from wired (landline) telephones or wireless (cel-
lular) telephones is very high. Speech recognition, speech synthesis, speaker
verification, speech enhancement, text-to-speech translation, and speech-to-text
dictation are some of the other applications of speech processing.
3. Consumer Electronics. We have already mentioned cellular or mobile
phones. Then we have HDTV, digital cameras, digital phones, answering
machines, fax and modems, music synthesizers, recording and mixing of music
signals to produce CD and DVDs. Surround-sound entertainment systems includ-
ing CD and DVD players, laser printers, copying machines, and scanners are
found in many homes. But the TV set, PC, telephones, CD-DVD players, and
scanners are present in our homes as separate systems. However, the TV set can
be used to read email and access the Internet just like the PC; the PC can be
used to tune and view TV channels, and record and play music as well as data
on CD-DVD in addition to their use to make telephone calls on VoIP. This trend
toward the development of fewer systems with multiple applications is expected
to accelerate in the near future.
4. Biomedical Systems. The variety of machines used in hospitals and biomed-
ical applications is staggering. Included are X-ray machines, MRI, PET scanning,
bone scanning, CT scanning, ultrasound imaging, fetal monitoring, patient moni-
toring, and ECG and EEC mapping. Another example of advanced digital signal
processing is found in hearing aids and cardiac pacemakers.
5. Image Processing. Image enhancement, image restoration, image under-
standing, computer vision, radar and sonar processing, geophysical and seismic
data processing, remote sensing, and weather monitoring are some of the applica-
tions of image processing. Reconstruction of two-dimensional (2D) images from
several pictures taken at different angles and three-dimensional (3D) images from
several contiguous slices has been used in many applications.
6. Military Electronics. The applications of digital signal processing in mili-
tary and defense electronics systems use very advanced techniques. Some of the
applications are GPS and navigation, radar and sonar image processing, detection
1
Code- and time-division multiple access. In the following sections we will mention several technical
terms and well-known acronyms without any explanation or definition. A few of them will be
described in detail in the remaining part of this book.
DISCRETE-TIME SIGNALS
3
and tracking of targets, missile guidance, secure communications, jamming and
countermeasures, remote control of surveillance aircraft, and electronic warfare.
7. Aerospace and Automotive Electronics. Applications include control of air-
craft and automotive engines, monitoring and control of flying performance of
aircraft, navigation and communications, vibration analysis and antiskid control
of cars, control of brakes in aircrafts, control of suspension, and riding comfort
of cars.
8. Industrial Applications. Numerical control, robotics, control of engines and
motors, manufacturing automation, security access, and videoconferencing are a
few of the industrial applications.
Obviously there is some overlap among these applications in different devices
and systems. It is also true that a few basic operations are common in all the
applications and systems, and these basic operations will be discussed in the
following chapters. The list of applications given above is not exhaustive. A few
applications are described in further detail in [1]. Needless to say, the number of
new applications and improvements to the existing applications will continue to
grow at a very rapid rate in the near future.
1.3 DISCRETE-TIME SIGNALS
A signal defines the variation of some physical quantity as a function of one
or more independent variables, and this variation contains information that is of
interest to us. For example, a continuous-time signal that is periodic contains the
values of its fundamental frequency and the harmonics contained in it, as well
as the amplitudes and phase angles of the individual harmonics. The purpose of
signal processing is to modify the given signal such that the quality of information
is improved in some well-defined meaning. For example, in mixing consoles for
recording music, the frequency responses of different filters are adjusted so that
the overall quality of the audio signal (music) offers as high fidelity as possible.
Note that the contents of a telephone directory or the encyclopedia downloaded
from an Internet site contains a lot of useful information but the contents do
not constitute a signal according to the definition above. It is the functional
relationship between the function and the independent variable that allows us to
derive methods for modeling the signals and find the output of the systems when
they are excited by the input signals. This also leads us to develop methods for
designing these systems such that the information contained in the input signals
is improved.
We define a continuous-time signal as a function of an independent variable
that is continuous. A one-dimensional continuous-time signal f(t) is expressed
as a function of time that varies continuously from −∞ to ∞.Butitmaybe
a function of other variables such as temperature, pressure, or elevation; yet we
will denote them as continuous-time signals, in which time is continuous but the
signal may have discontinuities at some values of time. The signal may be a
4
INTRODUCTION
(a)
(
b)
x
1
(t)
0
t
x
2
(t)
0
t
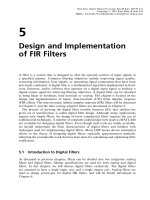
Figure 1.1 Two samples of continuous-time signals.
real- or complex-valued function of time. We can also define a continuous-time
signal as a mapping of the set of all values of time to a set of corresponding
values of the functions that are subject to certain properties. Since the function is
well defined for all values of time in −∞ to ∞, it is differentiable at all values
of the independent variable t (except perhaps at a finite number of values). Two
examples of continuous-time functions are shown in Figure 1.1.
A discrete-time signal is a function that is defined only at discrete instants of
time and undefined at all other values of time. Although a discrete-time function
may be defined at arbitrary values of time in the interval −∞ to ∞, we will
consider only a function defined at equal intervals of time and defined at t = nT ,
where T is a fixed interval in seconds known as the sampling period and n
is an integer variable defined over −∞ to ∞. If we choose to sample f(t) at
equal intervals of T seconds, we generate f(nT)= f(t)
|
t=nT
as a sequence of
numbers. Since T is fixed, f(nT) is a function of only the integer variable n and
hence can be considered as a function of n or expressed as f(n). The continuous-
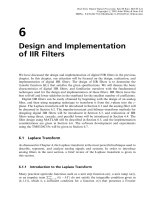
time function f(t) and the discrete-time function f(n) are plotted in Figure 1.2.
In this book, we will denote a discrete-time (DT) function as a DT sequence,
DT signal, or a DT series. So a DT function is a mapping of a set of all integers
to a set of values of the functions that may be real-valued or complex-valued.
Values of both f(t) and f(n) are assumed to be continuous, taking any value
in a continuous range; hence can have a value even with an infinite number of
digits, for example, f(3) = 0.4
√
2inFigure1.2.
A zero-order hold (ZOH) circuit is used to sample a continuous signal f(t)
with a sampling period T and hold the sampled values for one period before the
next sampling takes place. The DT signal so generated by the ZOH is shown in
Figure 1.3, in which the value of the sample value during each period of sam-
pling is a constant; the sample can assume any continuous value. The signals of
this type are known as sampled-data signals, and they are used extensively in
sampled-data control systems and switched-capacitor filters. However, the dura-
tion of time over which the samples are held constant may be a very small
fraction of the sampling period in these systems. When the value of a sample
DISCRETE-TIME SIGNALS
5
7/8
6/8
5/8
4/8
3/8
2/8
1/8
−1/8
−2/8
−3/8
−3
−2 −1
−4
0.0
0
123
4
5
6
7
8
n
Figure 1.2 The continuous-time function f(t) and the discrete-time function f(n).
−3 −2 −1
0
2
1
3
45 6
n
Figure 1.3 Sampled data signal.
6
INTRODUCTION
is held constant during a period T (or a fraction of T ) by the ZOH circuit as
its output, that signal can be converted to a value by a quantizer circuit, with
finite levels of value as determined by the binary form of representation. Such a
process is called binary coding or quantization. A This process is discussed in
full detail in Chapter 7. The precision with which the values are represented is
determined by the number of bits (binary digits) used to represent each value.
If, for example, we select 3 bits, to express their values using a method known
as “signed magnitude fixed-point binary number representation” and one more
bit to denote positive or negative values, we have the finite number of values,
represented in binary form and in their equivalent decimal form. Note that a
4-bit binary form can represent values between −
7
8
and
7
8
at 15 distinct levels
as shown in Table 1.1. So a value of f(n) at the output of the ZOH, which lies
between these distinct levels, is rounded or truncated by the quantizer according
to some rules and the output of the quantizer when coded to its equivalent binary
representation, is called the digital signal. Although there is a difference between
the discrete-time signal and digital signal, in the next few chapters we assume
that the signals are discrete-time signals and in Chapter 7, we consider the effect
of quantizing the signals to their binary form, on the frequency response of the
TABLE 1.1 4 Bit Binary Numbers
and their Decimal Equivalents
Binary Form Decimal Value
0
111
7
8
= 0.875
0
110
6
8
= 0.750
0
101
5
8
= 0.625
0
100
4
8
= 0.500
0
011
3
8
= 0.375
0
010
2
8
= 0.250
0
001
1
8
= 0.125
0
000 0.0 = 0.000
1
000 −0.0 =−0.000
1
001 −
1
8
=−0.125
1
010 −
2
8
=−0.250
1
011 −
3
8
=−0.375
1
100 −
4
8
=−0.500
1
101 −
5
8
=−0.625
1
110 −
6
8
=−0.750
1
111 −
7
8
=−0.875
DISCRETE-TIME SIGNALS
7
filters. However, we use the terms digital filter and discrete-time system inter-
changeably in this book. Continuous-time signals and systems are also called
analog signals and analog systems, respectively. A system that contains both the
ZOH circuit and the quantizer is called an analog-to digital converter (ADC),
which will be discussed in more detail in Chapter 7.
Consider an analog signal as shown by the solid line in Figure 1.2. When it
is sampled, let us assume that the discrete-time sequence has values as listed
in the second column of Table 1.2. They are expressed in only six significant
decimal digits and their values, when truncated to four digits, are shown in the
third column. When these values are quantized by the quantizer with four binary
digits (bits), the decimal values are truncated to the values at the finite discrete
levels. In decimal number notation, the values are listed in the fourth column,
and in binary number notation, they are listed in the fifth column of Table 1.2.
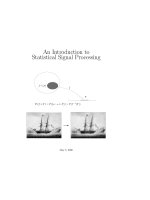
The binary values of f(n) listed in the third column of Table 1.2 are plotted in
Figure 1.4.
A continuous-time signal f(t) or a discrete-time signal f(n) expresses the
variation of a physical quantity as a function of one variable. A black-and-white
photograph can be considered as a two-dimensional signal f(m,r), when the
intensity of the dots making up the picture is measured along the horizontal axis
(x axis; abscissa) and the vertical axis (y axis; ordinate) of the picture plane
and are expressed as a function of two integer variables m and r, respectively.
We can consider the signal f(m,r) as the discretized form of a two-dimensional
signal f (x, y),wherex and y are the continuous spatial variables for the hor-
izontal and vertical coordinates of the picture and T
1
and T
2
are the sampling
TABLE 1.2 Numbers in Decimal and Binary Forms
Values o f f(n)
Decimal Truncated to Quantized Binary
n Values o f f(n) Four Digits Values of f(n) Number Form
−4 −0.054307 −0.0543 0.000 1
000
−3 −0.253287 −0.2532 −0.250 1
010
−2 −0.236654 −0.2366 −0.125 1
001
−1 −0.125101 −0.1251 −0.125 1
001
0 0.522312 0.5223 0.000 0
000
1 0.246210 0.2462 0.125 0
001
2 0.387508 0.3875 0.375 0
011
3 0.554090 0.5540 0.500 0
100
4 0.521112 0.5211 0.500 0
100
5 0.275432 0.2754 0.250 0
010
6 0.194501 0.1945 0.125 0
001
7 0.168887 0.1687 0.125 0
001
8 0.217588 0.2175 0.125 0
001
8
INTRODUCTION
01
−1−2−3−4
2345678n
7/8
6/8
5/8
4/8
3/8
2/8
1/8
Figure 1.4 Binary values in Table 1.2, after truncation of f(n) to 4 bits.
periods (measured in meters) along the x and y axes, respectively. In other words,
f(x,y)
|
x=mT
1
,y=rT
2
= f(m,r).
A black-and-white video signal f(x, y, t) is a 3D function of two spatial
coordinates x and y and one temporal coordinate t. When it is discretized, we
have a 3D discrete signal f(m,p,n). When a color video signal is to be modeled,
it is expressed by a vector of three 3D signals, each representing one of the
three primary colors—red, green, and blue—or their equivalent forms of two
luminance and one chrominance. So this is an example of multivariable function
or a multichannel signal:
F(m,r,n)=
⎡
⎣
f
r
(m, p, n)
f
g
(m,p,n)
f
b
(m,p,n)
⎤
⎦
(1.1)
1.3.1 Modeling and Properties of Discrete-Time Signals
There are several ways of describing the functional relationship between the
integer variable n and the value of the discrete-time signal f(n): (1) to plot the
values of f(n) versus n as shown in Figure 1.2, (2) to tabulate their values as
shown in Table 1.2, and (3) to define the sequence by expressing the sample
values as elements of a set, when the sequence has a finite number of samples.
For example, in a sequence x
1
(n) as shown below, the arrow indicates the
value of the sample when n = 0:
x
1
(n) =
231.50.5
↑
−14
(1.2)
DISCRETE-TIME SIGNALS
9
We denote the DT sequence by x(n) and also the value of a sample of the
sequence at a particular value of n by x(n). If a sequence has zero values for
n<0, then it is called a causal sequence. It is misleading to state that the
causal function is a sequence defined for n ≥ 0, because, strictly speaking, a DT
sequence has to be defined for all values of n. Hence it is understood that a causal
sequence has zero-valued samples for −∞ <n<0. Similarly, when a function
is defined for N
1
≤ n ≤ N
2
, it is understood that the function has zero values for
−∞ <n<N
1
and N
2
<n<∞. So the sequence x
1
(n) in Equation (1.2) has
zero values for 2 <n<∞ and for −∞ <n<−3. The discrete-time sequence
x
2
(n) given below is a causal sequence. In this form for representing x
2
(n),itis
implied that x
2
(n) = 0for−∞ <n<0andalsofor4<n<∞:
x
2
(n) =
1
↑
−20.40.30.4000
(1.3)
The length of a finite sequence is often defined by other authors as the number
of samples, which becomes a little ambiguous in the case of a sequence like x
2
(n)
given above. The function x
2
(n) is the same as x
3
(n) given below:
x
3
(n) =
1
↑
−20.40.30.4000000
(1.4)
But does it have more samples? So the length of the sequence x
3
(n) would be
different from the length of x
2
(n) according to the definition above. When a
sequence such as x
4
(n) given below is considered, the definition again gives an
ambiguous answer:
x
4
(n) =
0
↑
00.40.30.4
(1.5)
The definition for the length of a DT sequence would be refined when we
define the degree (or order) of a polynomial in z
−1
to express the z transform of
a DT sequence, in the next chapter.
To model the discrete-time signals mathematically, instead of listing their
values as shown above or plotting as shown in Figure 1.2, we introduce some
basic DT functions as follows.
1.3.2 Unit Pulse Function
The unit pulse function δ(n) is defined by
δ(n) =
1 n = 0
0 n = 0
(1.6)
and it is plotted in Figure 1.5a. It is often called the unit sample function and also
the unit impulse function. But note that the function δ(n) has a finite numerical
10
INTRODUCTION
−2 −1
1230
δ(n)
n
(a)
−1
1230
δ(n − 3)
n
(b)
−2−3 −11230
δ(n + 3)
n
(c)
Figure 1.5 Unit pulse functions δ(n),δ(n − 3),andδ(n + 3).
value of one at n = 0 and zero at all other values of integer n, whereas the unit
impulse function δ(t) is defined entirely in a different way.
When the unit pulse function is delayed by k samples, it is described by
δ(n − k) =
1 n = k
0 n = k
(1.7)
and it is plotted in Figure 1.5b for k = 3. When δ(n) is advanced by k = 3, we
get δ(n + k), and it is plotted in Figure 1.5c.
1.3.3 Constant Sequence
This sequence x(n) has a constant value for all n and is therefore defined by
x(n) = K;−∞ <n<∞.
1.3.4 Unit Step Function
The unit step function u(n) is defined by
u(n) =
1 n ≥ 0
0 n<0
(1.8)
and it is plotted in Figure 1.6a.
When the unit step function is delayed by k samples, where k is a positive
integer, we have
u(n − k) =
1 n ≥ k
0 n<k
(1.9)
DISCRETE-TIME SIGNALS
11
012 3 4 5 n
u(n)
(a)
01 234567 n
u(n − 2)
(b)
−3−4 −2 −1
01 2 3 n
u(−n + 2)
(d )
−3−4−5−6 −2 −1 0123n
u(−n)
(c)
−3−4−5−6 −2 −101234 n
u(−n − 2)
(e)
Figure 1.6 Unit step functions.
The sequence u(n + k) is obtained when u(n) is advanced by k samples. It is
defined by
u(n + k) =
1 n ≥−k
0 n<−k
(1.10)
We also define the function u(−n), obtained from the time reversal of u(n),asa
sequence that is zero for n>0. The sequences u(−n + k) and u(−n − k),where
k is a positive integer, are obtained when u(−n) is delayed by k samples and
advanced by k samples, respectively. In other words, u(−n + k) is obtained by
12
INTRODUCTION
delaying u(−n) when k is positive and obtained by advancing u(−n) when k is a
negative integer. Note that the effect on u(−n − k) is opposite that on u(n − k),
when k is assumed to take positive and negative values. These functions are
shown in Figure 1.6, where k = 2. In a strict sense, all of these functions are
defined implicitly for −∞ <n<∞.
1.3.5 Real Exponential Function
The real exponential function is defined by
x(n) = a
n
;−∞<n<∞ (1.11)
where a is real constant. If a is a complex constant, it becomes the complex
exponential sequence. The real exponential sequence or the complex exponential
sequence may also be defined by a more general relationship of the form
x(n) =
a
n
k ≤ n<∞
b
n
−∞ <n<k
(1.12)
A special discrete-time sequence that we often use is the function defined for
n ≥ 0:
x(n) = a
n
u(n) (1.13)
An example of x
1
(n) = (0.8)
n
u(n) is plotted in Figure 1.7a. The function x
2
(n) =
x
1
(n − 3) = (0.8)
(n−3)
u(n − 3) is obtained when x
1
(n) is delayed by three sam-
ples. It is plotted in Figure 1.7b. But the function x
3
(n) = (0.8)
n
u(n − 3) is
obtained by chopping off the first three samples of x
1
(n) = (0.8)
n
u(n),andas
shown in Figure 1.7c, it is different from x
2
(n).
1.3.6 Complex Exponential Function
The complex exponential sequence is a function that is complex-valued as a
function of n. The most general form of such a function is given by
x(n) = Aα
n
, −∞ <n<∞ (1.14)
where both A and α are complex numbers. If we let A =
|
A
|
e
jφ
and α =
e
(σ
0
+jω
0
)
,whereσ
0
,ω
0
,andφ are real numbers, the sequence can be expanded
to the form
x(n) =
|
A
|
e
jφ
e
(σ
0
+jω
0
)n
=
|
A
|
e
σ
0
n
e
j(ω
0
n+φ)
=
|
A
|
e
σ
0
n
cos(ω
0
n + φ) + j
|
A
|
e
σ
0
n
sin(ω
0
n + φ) (1.15)
= x
re
(n) + jx
im
(n)