Targeted Monitoring of Air Pollution and Climate Change Impacts on Biodiversity doc
Bạn đang xem bản rút gọn của tài liệu. Xem và tải ngay bản đầy đủ của tài liệu tại đây (713.18 KB, 78 trang )
Final report to Department for Environment, Food and Rural Affairs, Countryside
Council for Wales and English Nature (CR0322)
Targeted Monitoring of Air Pollution and
Climate Change Impacts on Biodiversity
M.D. Morecroft1, A.R.J. Sier2, D.A. Elston3, I.M. Nevison3, J.R. Hall4
S.C. Rennie2, T.W. Parr2 and H.Q.P. Crick5
April 2006
Address for communication:
Dr. M.D. Morecroft
Centre for Ecology and Hydrology
Crowmarsh Gifford
Wallingford
OX10 8BB
01491 692461
1
Centre for Ecology & Hydrology Wallingford, Maclean Building, Crowmarsh Gifford,
Wallingford, OX10 8BB
2
Centre for Ecology & Hydrology Lancaster, Lancaster Environment Centre, Library Avenue,
Bailrigg, Lancaster, LA1 4AP
3
Biomathematics & Statistics Scotland, Macaulay Institute, Craigiebuckler, Aberdeen, AB15 8QH
4
Centre for Ecology & Hydrology Monks Wood, Abbots Ripton, Huntingdon, Cambridgeshire,
PE28 2LS
5
British Trust for Ornithology, The Nunnery, Thetford, Norfolk IP24 2PU
Version Control
Version 1.
Presented to steering committee 8 March 06
Version 1a.
Additional material on birds and remote sensing, implementation plan.
Additional text on soils from Sal Burgess included and some formatting problems
resolved.
Sent to project team and expert group 24 March (Not sent to Steering Group as they
had already been circulated with additional material separately)
Version 2.
Complete revision of text to reduce length and change emphasis to the presentation of
proposals for the new network, rather than reporting on work carried out (change
made in response to request from Defra).
Remove recommendation for soil phosphorus monitoring in view of need to reduce
costs and lack of a generally accepted method.
Add dry deposition of sulphate and sulphur dioxide and total S deposition to list of
measurements recommended for future review.
Summary of results of power calculations added as Appendix 3.
Sent to project team, expert and steering groups 24 April 2006
Version 3.
Further revision of the text following comments and suggestions from members of the
project team, expert and steering groups.
Final formatting and insertion of site map.
Final version, as sent to customers.
Initially submitted to Defra 5 May 2006; Minor errors corrected and re-sent 12 May
2006.
| 2
Executive Summary
1. Climate change and air pollution present serious threats to the conservation of
biodiversity. Policy and management strategies to reverse biodiversity loss need
to be reviewed and developed in the light of these threats if they are to be
effective. This assessment must be based on reliable evidence and make best use
of resources.
2. The evidence-base must include the results of monitoring to detect, characterise
and quantify ecological changes which are taking place. It is also important to
ensure that the causes of change are correctly identified. An integrated approach
to both climate change and air pollution is likely to be most effective in this, as
organisms are responding to both and distinguishing their effects is a major
challenge.
3. A number of major reports and studies, since 2000, have identified a need for
improved monitoring of air pollution and climate change impacts on biodiversity
and better integration between existing initiatives. An extension to the existing
UK Environmental Change Network (ECN) provides a scientifically robust and
cost effective solution to this need.
4. The ECN monitors air pollution, climate, biodiversity and biogeochemistry at 12
contrasting terrestrial sites, providing detailed information and process
understanding. A larger network of less intensively studied sites would be
complementary, providing a wider coverage of UK climate and air pollution
conditions and better replication of habitats. This would enable statistical
modelling to identify the effects of different environmental variables on changes
in biodiversity with a much higher degree of confidence.
5. A series of measurements are proposed for each site, covering a range of aspects
of the physical environment (climate; wet deposition of pH, nitrate, ammonium,
sulphate; atmospheric ammonia concentration; aspects of soil chemistry) and
selected aspects of biodiversity (vegetation, butterflies, birds). Land management
records and remotely sensed data for phenology are also recommended to improve
understanding of processes driving change and strengthen confidence in
attribution of cause and effect.
6. Total atmospheric nitrogen deposition should be estimated on the basis of models
combining data collected on site with interpolated national data and physical
characteristics of the site (e.g. vegetation height).
7. Climate should be recorded using a combination of existing meteorological
stations on or near sites and by installing automatic weather stations with data
downloaded centrally using mobile telephone technology where possible.
8. Soil chemistry and biology is proposed to be recorded at six year intervals at six
locations at each site, linked with vegetation monitoring plots. A rolling
programme should be established, with a proportion of the sites sampled each
year. The provisional list of measurements is: bulk density, pH, soil organic
carbon, total-N, base saturation, PLFA, microarthopods and extractable nitrate and
ammonium. It is recommended that this is reviewed before implementation to
maximise comparability to Countryside Survey 2007 and the recommendations of
the Soil Indicator Consortium (which has yet to report), where this can be
achieved without compromising the aims of this project.
3 |
9. An ECN protocol for vegetation monitoring (the ‘coarse grain’ protocol) is
recommended for recording the species composition of approximately 50
permanently marked plots, with a recording interval of three years. A rolling
programme is recommended so that one third of the sites are recorded each year.
Bryophytes and lichens, as well as vascular plants, should be recorded if possible.
In addition, epiphytic lichen recording and measurements of tree height and
diameter at breast height (DBH) are recommended for woodland sites.
10. The Butterfly Monitoring Scheme (BMS) and Breeding Bird Survey (BBS)
methods are recommended for butterfly and bird monitoring to maximise use of
existing data at many of the sites and ensure compatibility with the BMS and
BBS, and with ECN, which uses both methods.
11. Monitoring would be carried out by a combination of specialist teams visiting
sites on an occasional basis (for example, to record vegetation or service the
weather station) and site-based staff (or potentially volunteers or contractors)
carrying out regular tasks.
12. Analysis of biological data would make use of indices and aggregated data where
possible (for example mean plant community Ellenberg values or indices of the
latitudinal distribution of species) rather than individual species data. This avoids
problems associated with the patchiness of many species’ distributions and allows
more general conclusions to be drawn.
13. The proposal is based on sites defined by the boundaries of land holdings,
following the pattern of ECN and Common Standards Monitoring; most selected
sites are National Nature Reserves (NNRs).
14. The range of habitats to be included in the network has not been tightly defined as
many sites will include more than one type. The following Broad Habitats have
been prioritised: acid grasslands, dwarf shrub heath, broadleaved mixed & yew
woodland, calcareous grassland, bogs, montane habitats, neutral grassland.
15. A short scoping study was carried out to assess the possibility of including coastal
sites – particularly sand dunes and salt marsh. Some adjustments would be
necessary, but there was a compelling case for monitoring these habitats. A
workshop to consider this in more detail and seek the views of a wider group of
specialists is recommended.
16. Power calculations estimated the chance that biologically significant differences
in trends in biodiversity between two groups of sites with contrasting climate or
pollution conditions would be detected as statistically significantly different.
These calculations indicated that between approximately 40 and 90 new
monitoring sites should be established and data analysed together with those from
existing ECN sites.
17. Ninety sites would give greatest confidence. Additional benefits of a larger
network include: (i) a broader geographical base, (ii) less restriction to particular
habitats, (iii) less dependence on the continuation of monitoring at all sites, (iv)
increased capacity to distinguish between the effects of the different drivers of
change, (v) less sensitivity to perturbations due to the differences between the
anticipated and true site-specific values of the environmental variables.
18. A minimum of 40 new sites (in addition to the existing ECN sites) is
recommended to achieve the aims of the network. Once the full range of data are
available for each site, allowing different causes of variation to be estimated, the
| 4
chances of detecting significant differences in trends between groups of sites
should be increased compared to the power calculations. However, with a 40 site
network, there is a higher degree of risk of failing to detect differential trends in a
given time interval as compared to a 90 site network. It may also be necessary to
focus on a more limited range of habitats to allow habitat-specific analyses.
19. It is recommended that power analyses should be repeated using actual network
data, after an initial 4 year period, to review whether network size is appropriate
given the emerging degree of environmental conditions sampled and variation of
biodiversity measures within the network.
20. A ‘long list’ of sites was compiled and environmental information for each
collated from spatial datasets (for example climate data and nitrogen and sulphur
deposition on a 5km grid). A subset of these, comprised of NNRs, ECN sites and
selected experimental sites (where climate and air pollution regime are
manipulated) were subjected to cluster analysis, to group them on the basis of
predicted climate change and air pollution conditions. The inclusion of
experimental sites will be important to differentiate between drivers of change that
are spatially correlated and provide cross-validation in attributing changes to
climate change or air pollution.
21. Conservation agency staff rated the suitability of each NNR on the basis of
practical considerations and existing monitoring work on sites, and were requested
to try to avoid giving a low rating to all sites within a cluster. The most highly
rated sites in each cluster form a provisional short list of 90 sites for inclusion in
the new network across the UK. Further work will be required to refine the list
and gain agreement for participation, especially for Northern Irish sites.
22. Data management should follow the ECN model and be done by the ECN data
centre; a strategy for implementing this has been developed. It is recommended
that open access arrangements to the data be agreed if possible.
23. The programme would be managed by a coordinator reporting to a steering
committee representing network sponsors. Coordinators would also probably be
nominated within the conservation agencies to manage their involvement.
24. Costs of initiating monitoring at each site are estimated at approximately £11,000,
with ongoing costs of approximately £7,000 per annum (excluding overheads
applied as a percentage of salary). This would be reduced where some of the
monitoring is already taking place. It could also be reduced by the use of
volunteers, where this can be arranged. The total annual running cost (excluding
salary overheads) of a network with 40 new sites is estimated at approximately
£417k; for 90 new sites it would be approximately £818k.
25. It is recommended that the next steps are:
a. Establish the organisational framework, in particular formal agreements,
such as Memoranda of Understanding between participating parties and
identify the level of funding available. This will entail a considerable
amount of promotion within the partner organisations and sufficient time,
approximately one year, must be allowed.
b. Resolve a number of outstanding issues, in particular finalise the list of
sites. This cannot be done before agreement is reached on the number of
sites, which in turn is likely to depend on the level of resources available.
It will also need more detailed consultation with site managers over the
5 |
habitats present on each site, ongoing monitoring and the availability of
staff and volunteers.
26. This project has demonstrated the current interest in assessing and distinguishing
the impacts on biodiversity of climate change and atmospheric pollution. It is
strongly recommended that this proposal is used as the basis to decide whether or
not to pursue and implement the new network. It has provided recommendations
and options for an implementation plan and estimated costs. It has also shown
that it will be most important to establish the right organisational framework,
obtain agreement between parties and sufficient funding. It is likely that these
preparations could take approximately one year, which will also allow time to
resolve some outstanding issues, such as refinement of some of the measurement
protocols and to finalise the list of sites.
| 6
Contents
1 Introduction............................................................................................................ 9
1.1. Background................................................................................................ 9
1.2. Aims, objectives and requirements............................................................12
2. Measurements...................................................................................................14
2.1. Development of proposal ..........................................................................14
2.2. Recommendations.....................................................................................16
2.2.1.
Overview...........................................................................................16
2.2.2.
Climate..............................................................................................16
2.2.3.
Air pollution......................................................................................18
2.2.4.
Soil ...................................................................................................20
2.2.5.
Vegetation.........................................................................................22
2.2.6.
Butterflies .........................................................................................23
2.2.7.
Birds .................................................................................................25
2.2.8.
Remote sensing of phenology............................................................26
2.2.9.
Land management .............................................................................27
2.3. Measurements for potential future inclusion..............................................28
2.5
Programming ............................................................................................29
2.6. Framework for analysis and interpretation of data .....................................29
3. Sites..................................................................................................................31
3.1. General principles and approach................................................................31
3.2. Methodology.............................................................................................32
3.2.1.
Statistical power analysis...................................................................32
3.2.2.
Site selection .....................................................................................33
3.3. Results and recommendations ...................................................................37
4. Data and information management....................................................................47
4.1. Overview ..................................................................................................47
4.2. Metadata ...................................................................................................47
4.3. Data capture..............................................................................................48
4.4. Data Transfer ............................................................................................48
4.5. Data Verification.......................................................................................48
4.6. Data access ...............................................................................................48
5. Programme Management ..................................................................................50
6. Communications...............................................................................................53
6.1. Introduction ..............................................................................................53
6.2. Aims of the communication ......................................................................53
6.3. Key messages ...........................................................................................53
6.4. Anticipated outputs ...................................................................................53
6.5. Audiences .................................................................................................54
6.6. Specific actions .........................................................................................54
6.7. Major obstacles and risks ..........................................................................54
6.8. Evaluation and review...............................................................................55
7. Implementation.................................................................................................56
8. Costs.................................................................................................................58
8.1. Central management costs.........................................................................58
8.2. Measurement costs....................................................................................59
8.3. Overall network running costs...................................................................60
8.4. Annual costs during implementation phase................................................61
8.5
Funding of the Network ............................................................................62
7 |
9. Conclusions and recommendations ...................................................................64
10.
References....................................................................................................67
Appendix 1 - Members of project team and expert advisory group ...........................71
Appendix 2 - Supporting documentation ..................................................................73
Appendix 3 - Summary of results of Statistical Power Analysis................................74
List of figures
1.1 Diagram to illustrate the trade-off between detail and coverage in monitoring
programmes and the lack of intermediates between the detailed and the broad-scale
10
3.1 Steps involved in selecting potential sites for the network
33
3.2 Scatter plots showing the relationships between the five design variables used
35
3.3 Power to detect differences in trend in total butterfly indices
37
3.4 Power to detect differences in trend in total bird indices
38
3.5 Power to detect differences in trend in mean Ellenberg N of plant community
38
3.6 Map of proposed sites
41
4.1 Proposed data management structure for the new network
47
5.1 Organisational chart for proposed targeted monitoring network
51
8.1 Annual cost of running a network of 40 or 90 sites, broken down into broad
categories
61
8.2 Network costs over first four years of operation with (a) 40 sites and (b) 90 sites
62
List of tables
1.1 Requirements for the proposed network
13
2.1 Criteria used for assessment of potential measurements
15
2.2 Sampling and analysis of soil samples
21
2.3 Measurements for potential future inclusion
28
2.4 Timing of core measurements through the year
29
3.1 Correlation matrix of the five design variables
35
3.2: Provisional list of sites ranked as suitable for inclusion
42
4.1 Database Development – task list
49
5.1: Summary of organisational structures and roles
52
7.1 Proposed outline implementation strategy – tasks by financial year, assuming
commencement in the middle of FY 2006/7
57
8.1 Total annual costs for programme and data management
59
8.2 Estimated costs of measurements
60
8.3 Potential Sponsors of and Support for the New Network
63
| 8
1. Introduction
Atmospheric pollution and climate change present major threats to biodiversity, both
globally and within the UK. National and regional governments have commitments to
address these issues. Responding to the threats posed by air pollution and climate change
requires an understanding of the nature and extent of their impacts. Monitoring allows
changes in biodiversity to be detected and quantified and therefore provides objective
evidence on which to develop scientific understanding, policy and management
responses.
A wide range of monitoring programmes cover different aspects of UK biodiversity.
Changes in the populations of some animal groups, such as bird (Eaton et al., 2005), moth
(Woiwod, 1997) and butterfly (Thomas, 2005) species over recent decades have been
reported as a result of large scale monitoring programmes conducted each year. Surveys
repeated over longer intervals, especially the Countryside Surveys (Haines Young et al.,
2000), have detected changes in the composition of plant communities since the 1970s.
The underlying causes of change in biodiversity must be identified before an appropriate
response can be made. However this presents problems because ecological interactions
are complex and the impacts of different environmental pressures are not always easy to
disentangle.
The impacts of climate change and air pollution are particularly difficult to identify with a
high degree of confidence. One of the main reasons for this is that climate and air
pollution are rarely measured at sites where biodiversity is monitored so potential
relationships can only be assessed by using interpolated national data. These interpolated
values can be reliable in some circumstances (for example nitrogen dioxide deposition or
temperature in flat terrain) but can be very unreliable in others (for example ammonia
deposition or precipitation in sites with varied topography). The effect of uncritically
using explanatory variables measured with error in regressions is to underestimate the
effect of the explanatory variables. Whilst it is possible to correct for this bias, the
correction process introduces additional uncertainty. The use of statistical techniques to
compare trends at sites with contrasting environmental conditions would give best results
if physical data have been measured on site. This would be particularly powerful in a
network where sites were selected to maximise the contrast in air pollution and climate
change regimes.
This report presents a proposal to monitor aspects of biodiversity alongside climate and
air pollution across a network of conservation sites, spanning the widest possible range of
air pollution conditions and predicted climate changes. It is a proposal which builds on
and complements existing monitoring work and would operate as an extension to the UK
Environmental Change Network.
1.1.
Background
Most biodiversity monitoring has concentrated on particular groups of species, such as
the Breeding Bird Survey and Butterfly Monitoring Scheme. The monitoring of air
pollution and climate have generally been carried out under separate programmes at
different sites. There are however three major schemes that monitor both biodiversity and
aspects of the physical environment across a range of sites. The Environmental Change
Network (ECN) has monitored 12 terrestrial and 45 freshwater sites in this way since
1992. The ICP Forests Level 2 Programme also monitors a wide range of variables
relating to air pollution and climate and their impacts on 20 forest sites, managed for
9 |
timber production. The Acid Waters Monitoring Network includes both physical and
biological variables to investigate the effects of acidifying atmospheric deposition on
freshwater systems and their catchments. Whilst these programmes are effective in
detecting change and investigating the ecological and biogeochemical processes that are
causing it, relatively few terrestrial sites are included and not all of these include
important habitats for biodiversity conservation. In practice, statistically robust
comparisons between areas with similar terrestrial habitats, but contrasting climate
change or air pollution regimes, currently can only be made for production forests.
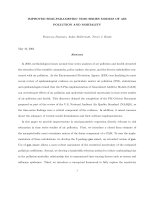
There is therefore a ‘gap’ between wide scale but relatively superficial monitoring
programmes and those which are very detailed but geographically restricted (Fig. 1.1)
Monitoring
THE UK BIODIVERSITY
MONITORING PYRAMID
Existing Programmes
Longterm
integrated
monitoring sites
UK Environmental
Change Network
Biodiversity sites
continuous monitoring
Frequent, Intensive
monitoring: few sites
?
Designated site surveying:
e.g. condition survey
Infrequent, nonintensive: many
sites
Wider countryside -periodic, thematic, survey
Census coverage
Extensive survey
Land cover/habitat mapping
SSSIs, SPAs, SACs
Countryside Survey,
Agri-Environment schemes
BTO Common Bird Census
Wetland Bird Survey (WWT, RSPB,
BTO, JNCC).
Biological Records Centre
UK Land Cover Map
Fig. 1.1 Diagram to illustrate the trade-off between detail and coverage in
monitoring programmes and the lack of intermediates between the detailed and the
broad-scale
This project has been preceded by a series of reports and initiatives, which have
recognised a need for further monitoring in the areas of climate change and air pollution
impacts on biodiversity.
Three major reports on the effects of climate change on biodiversity recommend further
monitoring in this area. A review by Hossell et al. (2000) advocated the ‘development of
methodologies for monitoring and assessing the status and quality of designated sites and
key species affected by climate change’. It also suggested the extension of existing
monitoring and assessment techniques to ‘recognise and detect the impact of climate
change on species and habitats.’ Harrison et al. (2001), in reporting on the MONARCH
(Modelling Natural Resource Responses to Climate Change) programme, also highlighted
the need for more monitoring work to detect the effects of climate change, in particular
the need for more sites to be located in the areas of greatest sensitivity. Riley et al.
(2003) reviewed existing UK surveillance and monitoring schemes for their ability to
detect climate-induced changes in biodiversity, with a particular emphasis on the situation
in Scotland. They catalogued the range of information available to detect changes in
| 10
species and habitats, including a wide range of schemes mapping the distribution of
different taxa. The report recommended that more information could be derived from
existing schemes if there was an overarching framework to bring data together, but also
identified a need for more monitoring to fill taxonomic and habitat gaps.
One initiative has already begun to address the need for further monitoring of climate
change impacts. The ECN Central Coordination Unit, working with the national
conservation agencies, has developed plans for a network of sites to monitor the effects of
climate change on biodiversity at designated conservation sites, using a subset of ECN
measurements. An initial pilot study of ten upland sites in England, Scotland and Wales
was adopted as a practical first objective given the limited resources available (Sier,
2005a and b) and two initial sites (Creag Meagaidh NNR and Ingleborough NNR) have
started operating in the last two years.
A parallel process has taken place for air pollution impacts. The 2001 review by the
National Expert Group on Transboundary Air Pollution (NEGTAP, 2001) provided a
definitive overview of air pollution impacts. It identified a need ‘to establish new
monitoring programmes designed specifically to detect the biological effects of
atmospheric deposition, using a range of appropriate sites’. It also recognised a need to
ensure that data from existing monitoring were used effectively. A series of studies
(Sutton et al., 2004; Leith et al., 2006) have recently reviewed biomonitoring techniques
for detecting nitrogen deposition and its impacts, and developed new ones.
Recommended approaches included the use of nitrogen concentrations in moss tissue,
species composition of epiphytic lichen communities and characterisation of vascular
plant communities using Ellenberg fertility scores (Hill et al., 1999). A scoping study on
monitoring the impacts of air pollution on terrestrial habitats (Morecroft et al., 2005)
reviewed existing schemes and methodologies for detecting the impacts of air pollution,
particularly nitrogen deposition (but also including acidification and ozone). A series of
options for new monitoring initiatives were presented: (1) a relatively large ‘extensive
network’ based on a stratified random sample of sites to give nationally representative
data, (2) a smaller ‘intensive’ network, with more emphasis on detailed process
understanding, (3) a combination of intensive and extensive networks and (4) a network
focused on monitoring ozone impacts.
Recent years have also seen an increasing emphasis on monitoring the condition of
designated conservation sites, with the introduction of Common Standards Monitoring
(CSM) across the various national agencies (JNCC, 1998). CSM provides a standardised
framework for assessing whether the features of interest on designated sites are in
‘favourable’ condition or not. Surveyors are asked to record possible reasons for features
being in unfavourable condition, but it is impossible for them to be able to identify the
impacts of climate change or air pollution with any degree of confidence. Often, CSM
assessments are based on short site visits, sometimes less than a day in duration. Under
CSM, it is intended that each feature is monitored at least once every six years. This
rapid assessment approach is inevitable given resource constraints, and there is a need to
underpin these rapid assessments with more detailed, scientific measurements at a subset
of sites. English Nature has conducted a pilot study for a ‘validation network’ to provide
this function (Bealey & Cox, 2004), using quadrat-based sampling of vegetation
communities.
This proposal represents the convergence of these separate strands and brings together a
range of different organisations and scientific specialisms. In particular it combines the
monitoring of climate change and air pollution impacts. This is both good science and
wise management of limited resources. Plant and animal communities are responding to
11 |
both factors at the same time and distinguishing their effects is a major challenge. In
practical terms, similar biological response variables need to be monitored and there is a
common need for data management and analysis; a combined network represents a
considerable cost saving compared to two parallel networks. The proposed network is
thoroughly integrated with existing programmes, using established methodology as far as
possible and maximising the use of existing monitoring sites. It is designed to operate as
an extension to the existing ECN.
The proposal is the result of a project, funded by Defra, English Nature and Countryside
Council for Wales, which ran from October 2005 to March 2006. It was carried out by a
consortium led by CEH, drawing on statistical input from Biomathematics and Statistics
Scotland and on an expert group which included staff from the British Trust for
Ornithology, Oxford University, Rothamsted Research, Forest Research, Macaulay
Institute, Liverpool University, York University, Institute of Grassland and
Environmental Research in addition to staff from CEH and BioSS (see Appendix 1). A
steering group incorporating staff of Defra, the statutory conservation agencies,
Environment Agency, Scottish Environmental Protection Agency and Scottish Executive
Environment and Rural Affairs Department advised and reviewed the project.
1.2.
Aims, objectives and requirements
The overall purpose of the project is summarised as:
‘Working with a multi-agency partnership, [to] design, cost and make
recommendations for an extended site network, linked to the terrestrial
Environmental Change Network, that provides targeted monitoring of atmospheric
pollution and climate change impacts on biodiversity.’
The proposal has been developed to meet this objective, based on an initial project
specification and subsequent discussions with funders and stakeholders. Table 1.1
summarises the requirements of the new network.
| 12
Table 1.1 Requirements for the proposed network
1. Identify changes in biodiversity that are attributable to climate change and/or air
pollution on the basis of robust scientific evidence.
2. Underpin policy and management decisions across a range of government
departments and agencies.
3. Operate as part of the ECN with network and data management by the ECN
Central Coordination Unit, but a project with a distinct remit and its own steering
committee.
4. Inform and complement CSM, by identifying where climate change or air
pollution may be preventing the achievement of ‘favourable condition’.
5. Monitoring methodology should mostly follow ECN protocols, but new
techniques should be considered where they offer substantial advantages.
6. Links with existing monitoring networks should be maximised, by, for example,
sharing sites and data to give added value and better value for money.
7. Comparisons between similar habitats in contrasting regions, climates and
pollution regimes must be possible. If necessary the range of habitats can be
limited.
8. The network should be statistically representative of the UK. Representation of
separate countries within the UK is secondary and dependent on devolved
administrations. Interpretation of data for individual sites should be possible.
9. Compatibility with emerging European initiatives should be maximized as far as
possible within the framework provided by UK needs.
10. The network should focus on designated conservation sites but need not be
restricted to them. It is anticipated that the majority of sites will be National
Nature Reserves.
11. Conservation NGOs with substantial land holdings should be approached but their
sites may not be included in the early phases of network establishment.
12. The network initially should be restricted to terrestrial habitats, but opportunities
subsequently to include coastal habitats (saltmarshes and sand dunes) should be
investigated.
13. Interpreted results should be presented in a range of different formats appropriate
to varied audiences, including: (a) policy makers, (b) site managers, (c) the
scientific community, (d) other participants in biodiversity conservation, including
NGO’s and the voluntary sector, (e) educational audiences and (f) the wider
public.
14. A pilot study, analysing the data from the new network, should be completed by
2010.
15. Raw data to be easily available to the wider community.
16. A phased introduction of the new network is acceptable, with new sites and
habitat types included over a period of years.
13 |
2. Measurements
2.1.
Development of proposal
A wide range of potential measurements were reviewed for inclusion. These included:
1. all existing ECN measurements (Sykes & Lane, 1996; www.ecn.ac.uk);
2. recommended techniques for nitrogen deposition biomonitoring (Leith et al.
1996);
3. remote sensing opportunities using airborne and satellite techniques;
4. suggestions made by the steering group or expert group over the course of the
project.
The review drew on information from a number of sources:
1. evaluation of existing ECN protocols by site managers using a questionnaire;
2. a workshop (held at University College London, November 2005) attended by
members of the project team, expert group and steering group, with participants
completing a questionnaire at the end of the day;
3. discussions in Steering Group meetings;
4. papers prepared by members of the project team or expert group with specialist
knowledge of particular areas;
5. one-to-one discussions between the project leader and experts in relevant fields;
6. costs of measurements derived from information from site managers, price lists
and quotations from suppliers of equipment and services.
The criteria used to assess measurements are summarised in Table 2.1. Full details are
not presented here but have been documented and are available on request (Appendix 2).
On the basis of the assessment, proposals were presented in December, January, March
and April and reviewed by all project participants (steering group, expert group, project
team).
The wide range of interests and responsibilities of participants meant that an element of
compromise was essential, given realistic expectations of resource availability. However,
there was consensus on many issues and agreement that the recommended list of
measurements provides a good basis for the new network.
A list of core measurements is proposed, which can be introduced from the start of the
network. A small number of these require methodological details to be finalised, but
there is no reason why these issues cannot be resolved within a few months. There is
another group of measurements, which are not suitable for early introduction, but are
desirable and show promise that they may become viable in the next few years. A
watching brief should be kept on developments in these areas and stakeholders may wish
to commission specific studies to address priority needs.
| 14
Table 2.1 Criteria used for assessment of potential measurements
Criterion
Explanation
Relevance
Measurements of change in biological
communities; aspects of climate and
pollution demonstrated to impact on
community composition or species
distribution or providing important
explanatory information
An assessment of whether the data collected
have proven to be reliable and consistent
Data Quality
Ease of
implementation
Specialist input
Established
methodology
Support
Cost
Can new monitoring work be implemented
quickly and easily, given appropriate
guidance, equipment and knowledge?
To what extent is training or active
involvement by specialists required, beyond
providing written guidance and instructions?
Are measurements already made for ECN or
other national monitoring schemes, or are
well-established techniques available?
Level of interest from stakeholders and
independent experts
Initial establishment and ongoing costs of
equipment, analyses and personnel
Basis of
assessment
(1) Expert opinion
based on scientific
literature (2) site
manager
questionnaire
(1) site manager
questionnaire (2)
expert opinion
ECN site manager
questionnaire
Expert judgement
Monitoring scheme
documentation and
expert judgement
Workshop,
questionnaire &
steering group
discussions
Site manager
questionnaire, price
lists and quotations
15 |
2.2.
2.2.1.
Recommendations
Overview
The following core measurements are proposed for all sites and should be introduced
from the start of the network. Further details are provided in the following sections.
•
•
•
•
•
•
•
•
Climate;
Air pollution;
o Wet deposition - pH, nitrate, ammonium, sulphate;
o Ammonia concentration - diffusion tubes;
o Total nitrogen deposition (combination of measurements / mapped data);
Soil chemistry and physical description characteristics;
Vegetation composition;
Butterflies;
Birds;
Satellite remote sensing of phenology;
Site management.
A number of other measurements are proposed at more limited subsets of sites.
•
•
•
Tree height and diameter – addition to vegetation monitoring at woodland sites;
Epiphytic lichens – additional to vegetation monitoring at woodland sites or sites
with trees;
Ground-based phenological measurements.
There are a number of other measurements that are not recommended for immediate
introduction, but they should be reviewed for possible future inclusion, once the network
has become established.
•
•
•
•
•
•
•
•
2.2.2.
Foliar nitrogen concentration;
Ozone;
Soil mineralization and nitrification;
Carabid beetles;
Bats;
Invertebrate suction samples;
Vertebrate herbivores and / or their impact ;
Atmospheric sulphate and sulphur dioxide concentrations and total sulphur
deposition.
Climate
Rationale
A good climate dataset for each site is a prerequisite for detecting relationships between
biological variables and climate and for comparing contrasting trends at different sites.
Some sites will have existing climate recording equipment, or records will be available
from a nearby station; where possible we recommend using these sources to keep costs
down and take advantage of long runs of data. Some meteorological variables are prone
to substantial variation over distances of a few kilometres or less; this is particularly the
case with precipitation measurements and with mountainous terrain. These local
| 16
variations could prove particularly valuable in separating the effects of different
environmental variables. In many cases it will be necessary to install climate monitoring
equipment.
The use of automatic weather stations (AWSs) is recommended, as these are becoming
standard tools for environmental monitoring and are well-established technology. The
ECN now has 14 years of experience of their operation (Sykes & Lane, 1996). The use of
dedicated AWSs allows a standard data format to be used, reducing the time requirement
for data management compared to using a mixture of formats from other programmes. If
near real-time data can be made available over the internet, there are a number of other
advantages, for example the suitability of weather conditions for fieldwork at remote sites
can be assessed and opportunities for educational outreach can be developed.
Proposed methodology
At the implementation phase, each site should be investigated for existing sources of
potential data. In the event that none are available, an Automatic Weather Station should
be installed to measure the following.
•
•
•
•
•
•
•
•
Total Solar Radiation
Air temperature
Relative Humidity
Wind speed
Wind direction
Soil water content
Soil temperature
Rainfall
Mobile telephone technology should be used (where coverage allows this) to
automatically download data centrally, followed by automated QA checks and input to a
database. Data should be made available over the internet, updated on at least a daily
basis.
Locally based staff should visually check systems at least once a month and make a
preliminary investigation of any anomalous results. Calibration and basic maintenance
must be carried out during an annual visit by specialist staff.
Installation and site characteristics should follow ECN protocols (Sykes & Lane, 1996).
Constraints
Start-up costs are relatively high where new automatic weather stations are required.
Good QA systems are necessary to detect drifting calibrations or other problems.
Requirements for preparatory work
1. Assessment of sites which do not require installation of an AWS.
2. Procurement of new AWS systems, including negotiations with manufacturers and
detailed review of technical specifications.
3. Development of central automated system for downloading and handling data
(note: the elements of this are already available and telemetry equipment is a
standard option with all major manufacturers).
17 |
2.2.3.
Air pollution
Rationale
As with climate, quantitative air pollution data for at each site are essential for testing for
associations with biodiversity responses and making comparisons between sites with
contrasting conditions. There are a wide range of different variables which may
potentially have biological effects but the following were identified as highest priority by
the Steering and Expert Groups.
•
•
•
•
•
Total nitrogen deposition
The balance between oxidised and reduced nitrogen
Acid deposition
Sulphur deposition
Ozone concentration
It is recommended that core measurements address the first three of these pollutants.
Sulphur deposition is partially addressed but could potentially be addressed more
comprehensively at a later stage if resources and techniques were available. Ozone
concentrations are likely to rise in coming decades; methodological considerations
prevent including it in the core measurement set at this stage, but ongoing review of the
opportunities is recommended.
Total nitrogen deposition comprises a number of different components and varies greatly
with location and habitat characteristics. Monitoring all components directly is difficult,
expensive and rarely carried out. However a combination of field measurements for the
most variable measurements and interpolation of national data can give a good estimate
suitable for quantitative inter-site comparisons. Ammonia deposition is the largest
component of total nitrogen deposition in many circumstances. It is also highly variable,
depending on proximity to point sources, especially intensive livestock rearing units and
the nature of habitat, particularly the height and aerodynamic roughness of vegetation. It
is therefore particularly important to make field measurements of atmospheric
concentrations in order to allow estimates of deposition using habitat information
(deposition rates depend on land surface characteristics such as vegetation height).
Wet deposition of nitrate and ammonium can be measured at the same time as sulphate
and pH using a standard precipitation collector used by ECN (Sykes and Lane, 1996) and
the acid deposition monitoring networks and is cost effective on this basis. It also allows
an assessment of the ratio of oxidised (nitrate) to reduced nitrogen (ammonium).
Acid deposition has been declining in recent years – by more than 50% over large areas
of the UK between 1985 and 1999 (NEGTAP, 2001) – and detecting the anticipated
recovery of soils and plant communities is important for demonstrating the value of
emissions controls and understanding ecosystem processes which may modify the
impacts of other variables. It is recommended that estimates of two other sources of
atmospheric nitrogen inputs, nitrogen dioxide and nitric acid, are derived from
interpolated national statistics. This is acceptable for NO2 because its concentration is
relatively unaffected by local factors and it is a relatively small component of total
nitrogen deposition. Nitric acid concentration is technically difficult to measure and
requires use of an active measurement system using mains power.
Sulphur deposition is partly being addressed through wet deposition measurement. A
suitable method for monitoring sulphur dioxide concentration at remote sites, which does
not involve disproportionate costs of installing mains power, is not currently available.
(An ECN pilot study showed that concentrations are frequently too low for reliable use of
| 18
diffusion tubes). Consultations with the steering group show a mixed response to the
issue of sulphur deposition. Most participants did not rank the issue high in priority but
the EA and SEPA favoured its inclusion in order to assess recovery of ecosystems and
hence assess the effectiveness of control measures. It would be possible to investigate
alternative options and perhaps develop new techniques if funding for this were available
at the implementation phase.
Ozone presents difficulties. It is an important issue which may grow in importance in the
future if, as anticipated, concentrations rise, but the only acceptable way of monitoring it
at remote locations, without a power supply, is diffusion tubes. These have been used in
the ICP Forests Level 2 programme, but do not give values for peak ozone incidents,
which are believed to cause visible ozone symptoms. Vegetation change in plant
communities has been shown to be related to the AOT40 exposure index, which cannot
be derived directly from diffusion tube data, and studies would be needed to establish
whether relationships between mean concentration and AOT40 can be applied at different
sites. Morecroft et al. (2005) discuss the options for an ozone impacts monitoring
network in more detail. It is recommended that ozone should initially be considered an
‘additional measurement’ which is implemented if funding is available or there is a sitespecific need. This situation should however be kept under review.
Proposed methodology
Ammonia concentration should be measured using passive sampling techniques – either
the ‘Alpha’ samplers used by the Ammonia Monitoring Scheme or commercially
available diffusion tubes (e.g. those supplied and analysed by Gradko Ltd.).
Wet deposition should be collected using a standard precipitation collector (Sykes &
Lane, 1996) and analysed for NO2-, NH4+, SO4- and pH. It is recommended that
collectors are deployed at one month intervals, rather than the current one week (ECN) or
two week (precipitation composition monitoring network) intervals, using a biocide such
as thymol. Studies have shown (Cape et al. 2001) that biocides can prevent major
changes in chemical composition over this period of time.
Routine deployment of field sampling equipment can be carried out by non-specialist
local staff following written instructions. Laboratory analysis should be carried out by
specialist staff at a recognised laboratory compliant with the Joint Code of Practice for
Environment Research.
Modelling total nitrogen input for all sites can be carried out at CEH Edinburgh, using
existing techniques and an input of approximately 10 days time at the outset.
Constraints
Chemical analysis is often expensive (of the order of thousands of pounds per site per
year), as is equipment for continuous monitoring in the field. Costs must be minimised to
enable a sufficiently large network to be established.
Mains power is not available at many sites.
Direct measurements of dry deposition are expensive and require specialist skills and
rates of dry deposition are usually inferred from concentration data.
19 |
Requirements for preparatory work
Standard models need to be applied to each site, taking account of habitat characteristics,
once network operation commences.
2.2.4.
Soil
Rationale
Soil communities are important aspects of biodiversity and they are involved in many
important ecosystem processes, particularly nutrient cycling. Soil chemistry is neither an
aspect of biodiversity nor one of the primary causes of change addressed by this project.
Nevertheless, understanding mechanisms of change and correctly attributing effects to
causes are central to the project, making it necessary to understand the soil chemistry at
sites. For example, a change in the proportion of acidophilic species in a plant
community may be attributed to changing pH of rainfall. However it is possible that this
correlation results from other factors, such as an association between plant species’
tolerance of acidic conditions and adaptation to low nutrient levels. Furthermore, a
change in pH of rainfall does not necessarily cause a change in soil pH, as many soils
(particularly calcareous ones) have a capacity for buffering pH change. Similarly the
timescale of change in soil pH and related parameters may well be different from that of
rainfall chemistry. Evidence of causation is therefore strengthened if a change in soil pH
is detected.
There are many aspects of soils which could be measured, but the priority must be on
those which contribute most to understanding the mechanisms by which climate change
and air pollution cause changes in ecological communities. In particular it is important to
test for the following:
1
2
3
4
| 20
Evidence of recovery from acidic deposition. pH provides this evidence but
NEGTAP (2001) recommended base saturation as a more reliable indicator in
view of the UK’s oceanic climate and potential short-term effects of sea salt
deposition events prior to sampling.
Changes in soil nitrogen supply as a result of nitrogen deposition or impacts of
climate change on mineralization and nitrification rates (e.g. Jamieson et al.,
1998). Change in extractable NH4+ and NO3 - suggests inputs of nitrogen sufficient
to change microbial functioning and/or uptake by plants. C:N ratio is essential for
many models linking biogeochemistry and biodiversity. Changes in total pools are
very slow and the use of NH4+ and NO3 - and their ratio will provide additional
information on shifts in microbial functioning. They may also be linked to shifts
in plant species due to preferential usage of NH4+ or NO3- by plants.
Changes in soil carbon and bulk density reflecting the balance between plant
productivity and carbon lost through respiration. This would be expected under
various climate change scenarios and indicates a general shift in ecosystem
processes; it would also help in the evaluation of semi-natural habitats as sinks or
sources of atmospheric CO2. This may be an important factor in weighing up the
advantages and disadvantages of different biodiversity conservation strategies
under climate change.
Changes in soil biodiversity and soil health. PLFA is a biochemical marker for
key bacterial and fungal functional groups and microbial biomass.
Microarthropods are a direct aspect of biodiversity for which standard methods of
analysis are available and also have an important role in soil food webs and
nutrient supply.
A secondary consideration is that, where possible, measurements should be comparable
with those recommended by the Soil Indicator Consortium and those undertaken for the
forthcoming Countryside Survey in 2007. Both of these have yet to be finalised, but will
report before implementation of this network; it is essential to review the proposals for
soil measurements once methodological approaches for these other initiatives are
determined. The recommendations for soil measurements given here reflect advice from
participants of these other initiatives and the basic approach and the costs are likely to
remain appropriate. It would be beneficial if monitoring effort could be combined where
both the potential Soils Monitoring Network and the new targeted monitoring network
coincide in terms of space and parameters to assess. Where both networks had
measurements in common, it would be sensible to agree on Standard Operating
Procedures between the two. Comparability with existing ECN monitoring is also
important and the basic sampling design achieves this, but it also includes a wider spatial
sampling at each site.
Proposed method
It is recommended that the soil measurements follow the principal of sampling outlined
for ECN, with modifications to ensure a sufficient sample for all analyses required.
There should also be a change in location of the six permanent blocks so that, rather than
being located within a single 1 ha block, they are spread across the site in representative
vegetation types and adjacent to vegetation monitoring plots.
The sampling design is six permanent blocks with a permanent grid set of 16 cells. Cells
are separated into subcells and two samples are taken from each. Subcells are not to be
re-sampled again. The depth of sampling would be determined by the sensitivity of the
indicator, the process required for analysis and compatibility with other monitoring
programmes, and is outlined in Table 2.2. Samples would be bulked for each replicate
block prior to analysis. Bulk density would also be measured and the profile described.
Table 2.2 Sampling and analysis of soil samples
Core Depth
Analyses
Number of
samples/site
A
B
C
0 – 5cm and
20 – 30cm
0 – 5cm and
20 – 30cm
pH, soil organic carbon,
total-N, base saturation
Exchangeable NH4+ &
NO3-
6
0 – 8cm
PLFA, microarthopods
6
6
Compatibility
with other
monitoring
programmes
ECN
ECN (sampling
only – analyses
not in protocol)
SIC
Constraints
Soil phosphorus plays an important role in controlling plant nutrient relations, for
example where it limits plant growth it may alter plant community response to nitrogen
deposition (Carroll et al., 2003; Morecroft et al., 1994). Analysis of P is not
recommended because there is no reliable, generally applicable analytical method for
determining plant available P or P limitation.
Nitrogen mineralization and nitrification are better indicators of nitrogen supply to plants
than spot measurements of NH4+ & NO3-, but they are substantially more expensive. In
order to standardise the analysis, the work would require laboratory rather than field
21 |
conditions, which may not be realistic. It is recommended that both of these issues be
kept under review, taking into account preparation work currently underway for
Countryside Survey, which may help inform this review process.
Requirements for preparatory work
Review proposal in light of final decisions by the SIC and plans for the Countryside
Survey 2007 to ensure that proposed monitoring complements, rather than duplicates,
other schemes.
2.2.5.
Vegetation
Rationale
Species composition is an important aspect of biodiversity, and it is also important in
providing the habitat for animal groups. The use of Ellenberg numbers (Hill et al., 1999)
allows a straightforward assessment of the composition of plant communities in terms of
species nutrient requirements and this has been found to be an effective bioindicator of
nitrogen deposition by Leith et al. (2006).
The recording of epiphytic lichens could also easily be included by vegetation surveyors
visiting woodland sites and other sites with trees. It is recommended that this is included,
but the technique is currently being refined and published by Dr. Pat Wolseley (NHM) so
detailed recommendations are deferred until this has been done.
The determination of tissue nitrogen concentrations, whether total N or soluble
ammonium, has been developed by Leith et al. (2006), as a surrogate for recording
nitrogen deposition by focussing on bryophytes, which are most directly dependent on
atmospheric deposition of N. As this project proposes to determine N deposition for each
site, the analysis of tissue N is not recommended, but it is necessary to test the relative
importance of atmospheric N in comparison to other sources. Total nitrogen has been
used in many experimental studies (Cunha et al. 2002) and surveys of N deposition
impacts and could potentially be an aid to attribution of change to nitrogen deposition.
Interpretation is not simple since foliar nitrogen depends on a combination of factors:
1. N supply from atmosphere / soil / mycorrhizae / N fixation;
2. growth and any limitation by climate or supply of other nutrients;
3. seasonal patterns (most concentrations rise steeply to a peak in early summer and
then slowly decline;
4. allocation to different plant parts.
The selection of species will require detailed consideration before embarking on a major
long-term monitoring programme – species need to be present at a wide range of sites.
Proposed method
The ECN ‘Coarse grain’ method (Sykes & Lane, 1996) should be adopted. This is a
series of approximately 50 permanently marked 2m x 2m quadrats, randomly located on a
grid system. 2m square plots are also consistent with a number of other recording
schemes, including some of the habitat plots used for Countryside Surveys and the
recommendations for the National Vegetation Classification (Rodwell et al., 1991). Each
quadrat is sub-divided into 25 ‘cells’ of 400mm x 400mm and presence/absence of each
species is recorded in these cells, to give an index of frequency within the plot. Where
the plot falls in woodland a 10m x 10m plot is used to record tree species and the height
| 22
and Diameter at Breast Height (DBH) of up to 10 trees per plot are recorded. It is also
recommended that species cover and vegetation height be recorded. Ideally the whole
community, including bryophytes and lichens, should be recorded.
The existing ECN protocol specifies recording of plots to be carried out every nine years,
but it is recommended that a three year interval is adopted for this programme because:
1. vegetation can change on a time scale of one or a few years and nine years would
run a serious risk of missing impacts of extreme events and give little information
on rates and nature of change (e.g. rapid vs. steady);
2. it would take a long time to give information about change;
3. the recommendation of the expert group was that a short time interval was
desirable;
4. Common Standards Monitoring by the Conservation Agencies takes place on a six
year cycle, so three years would give good complementarity.
It is recommended that vegetation surveyors be contracted centrally, either at the UK
level by the central coordination unit for the project or within each of the country
conservation agencies. It is also recommended that vegetation and soil monitoring are
coordinated so that they take place as close to each other as possible in space and time.
Constraints
Identification of bryophytes and lichens is a specialist task, and there are few expert
surveyors available. Even expert surveyors may fail to record very small specimens in
some habitats, such as dense grassland. Analysis should therefore focus on species for
which data are most reliable (note that it is recommended that surveyors collect as
complete a record as possible from each plot).
In the event of financial constraints, it would be possible to record on a six year rather
than a three year cycle. This would not necessarily represent better value, since it would
take longer to detect change and it would give less information about response to extreme
climatic events (e.g. droughts) or pollution episodes.
Requirements for preparatory work
There may be a need to train surveyors to record bryophytes and lichens of interest.
2.2.6.
Butterflies
Rationale
Butterflies are probably the best-studied invertebrates in relation to climate change and
shifts in their distribution have been reported in recent years (e.g. Parmesan et al., 1999).
As mobile organisms, with short generation times, they would be expected to be amongst
the first indicators of change. In common with most terrestrial animal groups, the
butterflies have rarely been studied in relation to air pollution impacts. However, many
species of butterfly adults and larvae are dependent on specific food plants, and the
proposed network offers the potential to investigate the extent to which a decline in a
food plant may affect butterfly species. The Butterfly Monitoring Scheme (Pollard &
Yates, 1993) has been operating since 1976 and its methodology has proved capable of
detecting long term trends, year-to-year variations and the effects of extreme events
(Morecroft et al., 2002). Butterflies are a relatively small group (58 resident or common
migrant species in the UK) for which identification is relatively easy and good field
23 |
guides are available; non-experts can be easily trained and are reliable with a few weeks’
or months’ experience.
Many existing BMS transects are on National Nature Reserves and these reserves will be
preferentially included within the new network. Preparatory work for a new extended
butterfly monitoring programme in the wider countryside has developed a new
methodology which would only involve two sites visits per year (D. Roy pers. comm.).
This would not be suitable for this project as the method is not intended to give reliable,
site-specific data, which is important for relating butterfly populations to the physical
driving variables. It would be possible to develop an intermediate level of monitoring
which would provide reliable site-based data. This would require statistical analysis and
expert interpretation to assess the optimum number, timing and frequency of visits. This
option is not recommended at this stage because maximum consistency with existing
recording is desirable and many proposed sites already have ongoing transect recording.
It is clear that, where the situation permits, conservation agency staff and volunteers are
willing to carry out transect walks and enjoy doing so (particularly at species-rich sites).
The options should be reviewed if problems in finding staff and/or volunteer resources
are encountered at some sites.
Proposed method
The Butterfly Monitoring Scheme method (Pollard & Yates, 1993), which is also used by
ECN, is recommended. This is a weekly transect count carried out from April to
September, inclusive, under defined weather conditions (dry, with temperature over 17°C
unless there is greater than 60% sun in which case a temperature threshold of 13°C is
used in lowland areas or 11°C in the northern uplands).
Constraints
There is a substantial time commitment over the whole summer, although each transect
only takes approximately 1 hour.
Very remote sites should not be included in the network as it is difficult for recorders to
respond flexibly and take advantage of suitable weather conditions.
In some upland areas butterfly numbers are low. Nevertheless, these sites must be
included since change in response to climate change is anticipated, and these sites may
provide some of the best evidence of changing distribution patterns.
Requirements for preparatory work
There may be a need to train surveyors.
| 24
2.2.7.
Birds
Rationale
The monitoring of bird populations is a valuable component of any general programme to
monitor ecosystem health (Furness & Greenwood,1993), and will be informative as part
of the proposed extended network to monitor the impacts of climate change and air
pollution on biodiversity. Birds have a number of advantages as biomonitors compared to
other taxa: they are relatively easy to identify; they have been well studied, so that there is
a wealth of background knowledge to aid in the interpretation of population changes; they
tend to occur high in food chains and therefore tend to integrate the changes that may
occur at lower levels; they have been widely used as biomonitors already, for example in
the UK with respect to pollution (e.g. Shore et al., 2005), land-use (e.g. the UK
Government’s Headline Quality of Life Indicator of farmland bird populations
and climate change (e.g. three of
Defra’s suite of Climate Change Indicators: Cannell et al. 1999). They are currently the
subject of a wide range of national monitoring schemes, carried out using volunteer
observers.
Birds have been proven as sensitive to climate change, with respect to their phenology
(e.g. Crick & Sparks 1999, in press) and changes in breeding performance, survival,
abundance and distributional range (reviewed in Crick, 2004). There is also evidence that
bird distribution, abundance and breeding performance is affected by acid deposition (e.g.
Chamberlain et al., 2000). Inclusion in the proposed network would also provide added
benefits with respect to the interpretation of the broader-scale, national monitoring of bird
abundance carried out on 2,500 1-km squares as part of the BTO/JNCC/RSPB Breeding
Bird Survey (BBS) (Raven et al., 2005).
Proposed method
The Breeding Bird Survey line transect census method should be adopted (Raven et al.
2005). The observer makes two visits each breeding season to count all the birds seen
and heard along each transect. Birds are recorded in 200m sections of each transect. The
use of three distance bands enable detectability to be assessed and species density
calculated. An additional survey is made to record habitat using standardised habitat
codes based on Crick (1992). The method is fully described in the standard ECN
protocols. The standard method is for two parallel 1-km transect to be walked at least
500m apart within a randomised 1-km square of the national grid. Within the proposed
network, the transects will need to be adjusted to fit within the configuration of the site,
but the key will be to record in the standard 200m sections. On small sites, the total
distance covered may be less than 2km, but this will not pose a problem for analysis.
For individual site trends, the easiest way to analyse the data would be to use numbers of
registrations for each species per year to measure population change. It would be
possible to use distance sampling methods to estimate population densities per sites, but
this only provides limited extra information. For the measurement of trends across sites,
the data would be most efficiently analysed by the BTO using its standardised analytical
programs. Subsets of sites may be analysed according to habitat type or region depending
on the number of sites available for analysis. In general at least 30 sites are required to
produce reliable trends. Depending on the level of analysis required and the number of
sites involved, the analysis of trends should require approximately five days of processing
time at BTO per annum. If distance sampling methods are used to produce density
estimates on a per site basis or over the network or subset of sites, then there will be an
25 |