Communications of the Association for Information Systems: BUSINESS INTELLIGENCE pot
Bạn đang xem bản rút gọn của tài liệu. Xem và tải ngay bản đầy đủ của tài liệu tại đây (156.77 KB, 20 trang )
Communications of the Association for Information Systems (Volume13, 2004) 177-195 177
Business Intelligence by S. Negash
BUSINESS INTELLIGENCE
Solomon Negash
Computer Science and Information Systems Department
Kennesaw State University
ABSTRACT
Business intelligence systems combine operational data with analytical tools to present complex
and competitive information to planners and decision makers. The objective is to improve the
timeliness and quality of inputs to the decision process. Business Intelligence is used to
understand the capabilities available in the firm; the state of the art, trends, and future directions
in the markets, the technologies, and the regulatory environment in which the firm competes; and
the actions of competitors and the implications of these actions.
The emergence of the data warehouse as a repository, advances in data cleansing, increased
capabilities of hardware and software, and the emergence of the web architecture all combine to
create a richer business intelligence environment than was available previously.
Although business intelligence systems are widely used in industry, research about them is
limited. This paper, in addition to being a tutorial, proposes a BI framework and potential
research topics. The framework highlights the importance of unstructured data and discusses the
need to develop BI tools for its acquisition, integration, cleanup, search, analysis, and delivery. In
addition, this paper explores a matrix for BI data types (structured vs. unstructured) and data
sources (internal and external) to guide research.
KEYWORDS: business intelligence, competitive intelligence, unstructured data
I. INTRODUCTION
Demand for Business Intelligence (BI) applications continues to grow even at a time when
demand for most information technology (IT) products is soft [Soejarto, 2003; Whiting, 2003]. Yet,
information systems (IS) research in this field is, to put it charitably, sparse.
While the term Business Intelligence is relatively new, computer-based business intelligence
systems appeared, in one guise or other, close to forty years ago.
1
BI as a term replaced decision
support, executive information systems, and management information systems [Thomsen, 2003].
With each new iteration, capabilities increased as enterprises grew ever-more sophisticated in
their computational and analytical needs and as computer hardware and software matured. In this
paper BI systems are defined as follows:
1
For a history of business intelligence, see [Power 2004]
178 Communications of the Association for Information Systems (Volume 13, 2004)177-195
Business Intelligence by S. Negash
BI systems combine data gathering, data storage, and knowledge management
with analytical tools to present complex internal and competitive information to
planners and decision makers.
Implicit in this definition is the idea (perhaps the ideal) that business intelligence systems provide
actionable information delivered at the right time, at the right location, and in the right form to
assist decision makers. The objective is to improve the timeliness and quality of inputs to the
decision process, hence facilitating managerial work.
Sometimes business intelligence refers to on-line decision making, that is, instant response. Most
of the time, it refers to shrinking the time frame so that the intelligence is still useful to the
decision maker when the decision time comes. In all cases, use of business intelligence is
viewed as being proactive. Essential components of proactive BI are [Langseth and Vivatrat,
2003]:
• real-time data warehousing,
• data mining,
• automated anomaly and exception detection,
• proactive alerting with automatic recipient determination,
• seamless follow-through workflow,
• automatic learning and refinement,
• geographic information systems (Appendix I)
• data visualization (Appendix II)
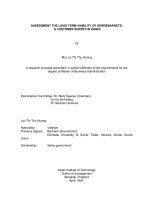
Figure 1 shows the variety of information inputs available to provide the intelligence needed in
decision making.
where OLAP = On-Line Analytic Processing, DW=Data Warehouse, DM=Data Mining, EIS =
Executive Information Systems, and ERP = Enterprise Requirement Planning.
Figure 1: Inputs to Business Intelligence Systems
INPUT
DECISION
Business
Intelli
g
ence
A
nal
y
st
Unstructured
Conversations,
Graphics, Images,
Movies, News items
Spreadsheets, Text,
Videos, Web Pages,
business processes
Structured
OLAP, DW,
DM, EIS,
ERP, DSS
Communications of the Association for Information Systems (Volume13, 2004) 177-195 179
Business Intelligence by S. Negash
WHAT DOES BI DO?
BI assists in strategic and operational decision making. A Gartner survey ranked the strategic use
of BI in the following order [Willen, 2002]:
1. Corporate performance management
2. Optimizing customer relations, monitoring business activity, and traditional decision
support
3. Packaged standalone BI applications for specific operations or strategies
4. Management reporting of business intelligence
One implication of this ranking is that merely reporting the performance of a firm and its
competitors, which is the strength of many existing software packages, is not enough. A second
implication is that too many firms still view business intelligence (like DSS and EIS before it) as
an inward looking function.
Business intelligence is a natural outgrowth of a series of previous systems designed to support
decision making. The emergence of the data warehouse as a repository, the advances in data
cleansing that lead to a single truth, the greater capabilities of hardware and software, and the
boom of Internet technologies that provided the prevalent user interface all combine to create a
richer business intelligence environment than was available previously. BI pulls information from
many other systems. Figure 2 depicts some of the information systems that are used by BI.
where: OLAP = on-line data processing, CRM=customer relationship management,
DSS= decision support systems, GIS = geographic information systems
Figure 2: BI Relation to Other Information Systems.
DSS/
EIS
Data
Mining
OLAP
Data
Warehouse
Visualization
CRM
Marketing
GIS
Knowledge
Management
Business
Intelligence
180 Communications of the Association for Information Systems (Volume 13, 2004)177-195
Business Intelligence by S. Negash
BI converts data into useful information and, through human analysis, into knowledge. Some of
the tasks performed by BI are:
• Creating forecasts based on historical data, past and current performance, and estimates
of the direction in which the future will go.
• “What if” analysis of the impacts of changes and alternative scenarios.
• Ad hoc access to the data to answer specific, non-routine questions.
• Strategic insight (e.g., item 3 in Appendix III)
II. A DATA FRAMEWORK FOR BI
STRUCTURED VS. SEMI-STRUCTURED DATA
BI requires analysts to deal with both structured and semi-structured data [Rudin and Cressy,
2003; Moss, 2003]. The term semi-structured data is used for all data that does not fit neatly into
relational or flat files, which is called structured data. We use the term semi-structured (rather
than the more common unstructured) to recognize that most data has some structure to it. For
example, e-mail is divided into messages and messages are accumulated into file folders.
2
A survey indicated that 60% of CIOs and CTOs consider semi-structured data as critical for
improving operations and creating new business opportunities [Blumberg and Atre, 2003b].
"We have between 50,000 and 100,000 conversations with our customers daily,
and I don't know what was discussed. I can see only the end point – for example,
they changed their calling plan. I'm blind to the content of the conversations."
Executive at Fortune 500 telecommunciations provider [Blumberg and Atre,
2003b].
Semi-structured data is not easily searched using existing tools for conventional data bases
[Blumberg and Atre, 2003a]. Yet, analysis and decision making involves using a variety of semi-
structured data such as is shown in Table 1.
Table 1. Some Examples of Semi-Structured Data
Business
processes
Chats
E-mails
Graphics
Image files
Letters
Marketing
material
Memos
Movies
News items
Phone
conversations
Presentations
Reports
Research
Spreadsheet
files
User group files
Video files
Web pages
White papers
Word processing
text
Gartner group estimates that 30-40% of white-collar workers time is being spent on managing
semi-structured data in 2003, up from 20% in 1997 [Blumberg and Atre, 2003b]. Merrill Lynch, for
2
Admittedly, the term semi-structured data can mean different things in different contexts. For
example, for relational databases it refers to data that can’t be stored in rows and columns. This
data must, instead, be stored in a BLOB (binary large object) a catch-all data type available in
most DBMS software. Dealing with unstructured data requires classification and taxonomy.
[Blumberg and Atre, 2003c]
Communications of the Association for Information Systems (Volume13, 2004) 177-195 181
Business Intelligence by S. Negash
example, estimates that more than 85% of all business information exists as semi-structured data
[Blumberg and Atre, 2003b]. Furthermore, roughly 15% of the structured data are commonly
captured in spreadsheets, which are not included in structured data base
architectures.[Blumberg and Atre, 2003b].
While data warehouses, ERP, CRM, and databases mostly deal with structured data from data
bases, the voluminous semi-structured data within organizations is left behind. Blumberg and Atre
[2003b] posit that managing semi-structured data persists as one of the major unsolved problems
in the IT industry despite the extensive vendor efforts to create increasingly sophisticated
document management software.
FRAMEWORK
Figure 3 shows a framework that integrates the structured and semi-structured data required for
Business Intelligence.
Figure 3. Business Intelligence Data Framework
One implication of the BI framework is that semi-structured data are equally important, if not
more, as structured data for taking action by planners and decision makers. A second implication
is that the process of acquisition, cleanup, and integration applies for both structured and semi-
structured data.
To create business intelligence information, the integrated data are searched, analyzed, and
delivered to the decision maker. In the case of structured data, analysts use Enterprise Resource
Planning (ERP) systems, extract-transform-load (ETL) tools, data warehouses (DW), data-mining
tools, and on-line analytical processing tools (OLAP). But a different and less sophisticated set of
analytic tools is currently required to deal with semi-structured data.
DATA TYPE/SOURCE MATRIX
Structured and semi-structured data types can be further segmented by looking at the internal
and external data sources of the organization. These two dimensions – data type and data source
– are illustrated in Figure 4.
STRUCTURED DATA
Acquisition Æ Integration Æ Cleanup Æ
Search Æ Analysis ÆDelivery
A
C
T
I
O
N
!
SEMI-STRUCTURED DATA
Acquisition Æ Integration Æ Cleanup Æ
182 Communications of the Association for Information Systems (Volume 13, 2004)177-195
Business Intelligence by S. Negash
SOURCE
TYPE
INTERNAL EXTERNAL
STRUCTURED
ERP CRM
SEMI-STRUCTURED
B
USINESS PROCESSES
NEWS ITEMS
Figure 4. BI Data Type/Source Matrix with Examples
The transition between structured and semi-structured data types and between internal and
external data sources is not defined sharply. For example, semi-structured data from e-mail and
Web sites deal with both internal and external data sources— intranets and extranets for Web
sites. Nevertheless, this matrix is useful to guide research and to view the available analytic tools
for BI. For example, ERP systems capture operational (internal) data in a structured format,
whereas, CRM focuses on customer (external) information. On the other hand, semi-structured
data is captured in business processes and news items, among other documents. For the
purpose of this paper, business processes and news items are used to represent internal and
external data sources, respectively.
III. DATA SOURCES AND ARCHITECTURE
BI FOR THE MASSES
Established analytic practice for BI typically involves a solitary user exploring data in what is
usually a one-off experience [Russom, 2003]. Specialists performing analyses in a staff position
for senior management can, and often do, create a sub-optimized BI solution. Because decisions
are made at many organizational levels, not just the executive level, a new class of analytic tools
is emerging that serves a much broader population within the firm. These new tools are referred
to as “BI for the masses”. BI for the masses is about providing reporting and analysis capability
at all levels of the organization. For example, firms are rolling out tools such as data mining
designed for use by non-specialists [McNight 2003].
The challenges of accomplishing BI for the masses are:
• easy creation and consumption of reports,
• secure delivery of the information, and
• friendly user interface, such as Internet browsers
Deployment of BI tools to many staff members indicates that organizations are ready to expand
BI to all levels. For example, BusinessObjects deployed its BI tools to 70,000 users at France
Telecom, 50,000 users at US Military Health System, and to several other firms at the 20,000
user level range [Schauer, 2003].
DATA VOLUME CONSIDERATIONS
By the end of 2001, the public Internet was the source of fully half the information used by
workers – in excess of 3 billion documents, 80% of which is semi-structured data [Blumberg and
Atre, 2003a]. Google.com estimates the Net is doubling in size every eight months. IDC, a
marketing research firm, reported that 31 billion e-mail messages were sent worldwide during
2002, with a prediction to double by 2006, exceeding 60 billion messages [Blumberg and Atre,
2003a]. More than 2 billion new Web pages were created since 1995, with an additional 200
million new pages being added every month [IDC, as reported in Blumberg and Atre, 2003b]. BI
analysts who fail to integrate semi-structured data do so at their own peril. The sheer volume of
Communications of the Association for Information Systems (Volume13, 2004) 177-195 183
Business Intelligence by S. Negash
semi-structured data is daunting, “The only thing worse than having too little data is having too
much of it” [Darrow, 2003].
ARCHITECTURE CONSIDERATIONS
Since it must deal with both structured and semi-structured data simultaneously, BI’s data
architecture is business rather than technically oriented. While technical data architectures focus
on hardware, middleware, and DBMSs, BI data architecture focuses on standards, metadata,
business rules, and policies [Moss, 2003]. An example of structured and unstructured metadata is
shown in Table 2.
Table 2. A Metadata Example for Structured and Semi-structured Data
Focus Derivation Administration
Business
(mostly semi-structured)
What does it mean?
Is it relevant?
What decisions can I
make?
How was it calculated?
Are the sources reliable?
What business rules were
applied?
What training is available?
How fresh is the data?
Can I integrate it?
Technical
(mostly structured)
Format
Length
Domain
Database
Filters
A
ggregates
Calculations
Expressions
Capacity planning
Space allocation
Indexing
Disk utilization
ARCHITECTURE FOR STRUCTURED DATA
Typical BI architecture for structured data centers on a data warehouse. The data are
extracted from operational systems and distributed using Internet browser technologies (Figure
5). The specific data needed for BI are downloaded to a data mart used by planners and
executives. Outputs are acquired from routine push of data from the data mart and from response
to inquiries from Web users and OLAP analysts. The outputs can take several forms including
exception reports, routine reports, and responses to specific request. The outputs are sent
whenever parameters are outside pre-specified bounds.
ERP
CRM
Legacy
Finance
Operations
Data
Warehouse
Data
Mart
Network
Distribution
Notification
Agent
OLAP User
Web User
On Demand
On Demand
Adapted from DM Review
Figure 5. Typical BI Architecture for Structured Data
184 Communications of the Association for Information Systems (Volume 13, 2004)177-195
Business Intelligence by S. Negash
ARCHITECTURE FOR SEMI-STRUCTURED DATA
BI architecture for semi-structured data (Figure 6) includes business function model, business
process model, business data model, application inventory, and meta data repository [Moss,
2003].
Business Process Model
Business Data Model
Application Inventory
S 5 S 3 S 7
USR U 4 U 6 U 2
CLT C E C A C C
DB D Q D T D S
Meta Data Repository
Business Meta Data
Technical Meta Data
AK ID=147
metaMT
Business Function Model
Adapted from Moss [2003]
Figure 6. BI Architecture for Semi-structured Data
Table 3 describes the five components.
Table 3 Architecture Components for Semi-Structured Model
Business function model Hierarchical decomposition of
organization’s business
Shows what organization does
Business process model Processes implemented for
business functions
Shows how organization performs
its business functions
Business data model Depicts the data objects, the
relationships connecting these
objects based on actual business
activities, the data elements
stored about these objects, and
the business rules governing
these objects;
Shows what data describes the
organization.
Application inventory Accounting of the physical
implementation components of
business functions, business
processes, and business data
Shows where the architectural
pieces reside.
Metadata repository: Descriptive detail of the business
models
Supports metadata capture and
usage
IV. RETURN ON INVESTMENT
BI projects are not exempt from the increasing pressure in firms to justify return on IT
investments. Surveys show that Return on Investment (ROI) for BI installations can be
substantial. An IDC study on the financial impact of business analytics, using 43 North American
Communications of the Association for Information Systems (Volume13, 2004) 177-195 185
Business Intelligence by S. Negash
and European organizations indicated a median five-year ROI of 112% from an investment of $2
million [Morris, 2003]. Return ranged from 17% to 2000% with an average ROI of 457%.
However, BI budget and ROI were not found to be correlated. [Morris, 2003; Darrow, 2003].
The challenge comes in trying to assess ROI prior to installation. Computing anticipated return on
investment for business intelligence is a difficult problem. Like most information systems, BI up-
front costs are high as is upkeep. Unfortunately, although reductions in information systems costs
from efficiencies
3
can be forecasted, the efficiency savings are only a small portion of the payoff
(Appendix III). It would be rare for a BI system to pay for itself strictly through cost reductions.
COSTS
Most firms today do use some form of business intelligence, although only a few operate
complete BI systems. To simplify the cost discussion, consider a firm starting from scratch.
Putting a BI system in place includes:
• Hardware costs. These costs depend on what is already installed. If a data warehouse is
in use, then the principal hardware needed is a data mart specifically for BI and, perhaps,
an upgrade for the data warehouse. However, other hardware may be required such as
an intranet (and extranet) to transmit data to the user community.
• Software costs. Typical BI packages can cost $60,000. Subscriptions to various data
services also need to be taken into account. For example, firms in the retail industry buy
scanner data to ascertain how demand for their products and competing products
responds to special offers, new introductions, and other day-to-day changes in the
marketplace (Appendix IV).
• Implementation costs. Once the hardware and software are acquired, a large one-time
expense is implementation, including initial training. Training is also an ongoing cost as
new people are brought in to use the system and as the system is upgraded. In addition,
annual software maintenance contracts typically run 15% of the purchase costs.
• Personnel costs. Personnel costs for people assigned to perform BI and for IT support
personnel, need to be fully considered to take into account salary and overhead, space,
computing equipment, and other infrastructure for individuals. A sophisticated cost
analysis also takes into account the time spent reading BI output and the time spent
searching the Internet and other sources for BI
4
.
BENEFITS
Most BI benefits are intangible before the fact. An empirical study for 50 Finnish companies
found most companies do not consider cost or time savings as primary benefit when investing in
BI systems [Hannula and Pirttimaki, 2003]. The hope is that a good BI system will lead to a big
bang return at some time in the future. However, it is not possible to forecast big bangs because
they are serendipitous and infrequent.
3
Examples include time saved in creating and distributing reports, operating efficiencies, ability to
retain customers
.
Efficiencies can include savings in other departments.
4
Data on time spent looking for BI was not found. However, the magnitude of expenditures is
implied by data on Internet search in general. Office workers in 2002 spent an average of 9.5
hours each week searching, gathering and analyzing information, and nearly 60 percent of that
time, (5.5 hours a week), was spent on the Internet. The average annual cost of per worker was
$13,182 [Blumberg and Atre, 2003].
186 Communications of the Association for Information Systems (Volume 13, 2004)177-195
Business Intelligence by S. Negash
V. COMPETITIVE ANALYSIS
“Next to knowing all about your own business, the best thing to know about is the
other fellow’s business.” John D. Rockefeller[Amazon, 2003]
Competitive intelligence (CI) is a specialized branch of Business Intelligence. It is “no
more sinister than keeping your eye on the other guy albeit secretly” [Imhoff, 2003]. The Society
of Competitive Intelligence Professionals (SCIP) defines CI as follows [SCIP, 2003]:
Competitive Intelligence is a systematic and ethical program for gathering,
analyzing and managing external information that can affect your company’s
plans, decisions and operations.
In other words, CI is the process of ensuring your competitiveness in the marketplace through a
greater understanding of your competitors and the overall competitive environment. “You can
use whatever you find in the public domain to ensure that you will not be surprised by your
competitors.” [Imhoff, 2003].
CI is not as difficult as it sounds. Much of what is obtained comes from sources available to
everyone, including [Imhoff, 2003]:
• government websites and reports
• online databases, interviews or surveys,
• special interest groups (such as academics, trade associations, and consumer
groups),
• private sector sources (such as competitors, suppliers, distributors, customer) or
• media (journals, wire services, newspapers, and financial reports).
The challenge with CI is not the lack of information, but the ability to differentiate useful CI from
chatter or even disinformation.
Of course, once a firm starts practicing competitive intelligence, the next stage is to introduce
countermeasures to protect itself from the CI of competitor firms. The game of measure,
countermeasure, counter-countermeasure, and so on to counter to the n
th
measure is played in
industry just as it is in politics and in international competition.
Appendix IV presents examples of competitive analysis.
VI. CURRICULUM OFFERINGS
BI is being taught at the university level in only a few schools (Table 4) A search of a number of
current DSS books found only three (Moss and Atre [2003], Power [2002], Turban and Aronson
[2001]) that even mentioned BI.
Table 4. Representative Universities Teaching BI
University Name Course Description
University of Technology Sydney,
Australia
Two BI courses in its e-Business masters: Business Intelligence 1:
Advanced analysis (#22797) and Business Intelligence 2:
Advanced planning (#22783).
Northwestern Polytechnic University,
UK
1 course in MBA program
Tilburg University, Netherlands 1 course
Claremont Graduate University Included as half of a course in executive MBA program.
Univ. of California at Irvine
1 course covering Business Intelligence and Knowledge
Management at the graduate and one at the undergraduate level.
Communications of the Association for Information Systems (Volume13, 2004) 177-195 187
Business Intelligence by S. Negash
VII. RESEARCH ISSUES
In the academic IS literature, few articles deal with BI or CI. The current references found are
shown in Table 5. Of the ten listed in the table, eight deal with competitive intelligence. One of the
eight [Rouibah and Old-Ali, 2002] contains BI in its title but is really about CI.
Table 5. Some Academic Articles on BI and CI
Cody et. al. [2002]
Hall [2000]
Markus and Lee [2000]
Powell and Bradford [2002]
Rouach and Santi [2001]
Rouibah and Ould-ali [2002]
Teo and Choo [2001]
Vedder and Guynes [2002]
Weir [2000]
Wiggins [2001]
Thus, although the vendors are pushing BI, and trade magazines such as Intelligent Enterprise
and DM Review write intensively about it, business intelligence seems to have flown under the
radar in academia.
Clearly, a lot of research opportunities exist in this field. Here are a few:
• Managing semi-structured information. Little research is reported on this topic in the IS
literature. Topics include (1) searching semi-structured data, (2) classification and
taxonomy for semi-structured data, and (3) measuring the levels of subjective values
such as severity or sentiment in documents (e.g., a customer letter not pleased with
company service.)
• Managing documents: integrating document management with analytic tools. Many
service organizations, including lawyers, insurance companies, consulting firms, and
government agencies produce document as their primary product [Sprague, 1995].
“Document management is an expanded form of information management” [Sprague,
1995, pp. 31]. Document management, while widely used in industry to deal with parts
of the semi-structured problem, is almost neglected in the IS literature, although
discussed in the Computer Science literature. Since Sprague’s seminal article
[Sprague,1995] appeared in MIS Quarterly, little has been published on the subject in IS
journals. A number of the published articles are shown in Table 5.
Table 5. Academic Articles on Document Management
Chin, A.G. (ed.) [2001]
Boncella, R. [2003]
Balasubramanian, V. and A. Bashian [1998]
Floyd, R.E. [2003]
Raynes, M. [2002]
Woojong, S. L. Heeseok [2001]
Zantout, H. F. Marir [1999]
• Achieving real-time enterprise BI: How is real-time BI achieved? What types of
decisions require real-time BI? What are the appropriate infrastructures for real time BI?
• Training knowledge workers for BI: Training in skills needed to deliver “BI for the
masses”. Closing the gap between available data and available resources (people) for
analysis.
• Building BI architecture: BI architecture considerations for business use.
• Establishing security: The security of mission-critical corporate intelligence systems
[Boncella, 2003]
• Designing scalable systems: The scalability of Web-based systems when large volumes
of BI information are exchanged between databases and Web clients [Cody, 2002].
188 Communications of the Association for Information Systems (Volume 13, 2004)177-195
Business Intelligence by S. Negash
• Integrating BI systems with IT: The integration of BI systems with corporate mainstream
IT.
• Interaction with business performance
5
: Measuring the impact of BI on business
performance.
• BI for the masses: What are the benefits and costs associated with providing BI
capabilities to large numbers of professionals in a firm?
This list is indicative of the many research problems that need to be addressed. Many involve
taking existing work and expanding it into the BI realm.
VIII. MARKETS, CUSTOMERS AND VENDORS
The size of the business intelligence market can be seen from the published forecasts. For
example, AMR research estimates the current BI market at $6 billion with projection to reach $12
billion by 2006 [Darrow, 2003].
Customers are asking their BI vendors for “the ability to support improved operational decision
making – not just deliver analytic and reporting bells and whistles” [Kestelyn, 2003]. The business
of analytic vendors is to get customers out of the business of searching for data and move them
into doing more analysis [Blumberg and Atre, 2003a].
The traditional custom design, build, and integrate model for BI systems is lengthy (at least six
months) and costly ($2-3 million) [Rudin and Cressy, 2003]. Therefore, many firms opt for pre-
built analytic applications to achieve lower total cost of ownership, quicker implementation, rapid
return on investment, while still obtaining underlying structure for performance, scalability, and
flexibility [Rudin and Cressy, 2003].
Gartner research found the number of firms that plan to manage their BI integration internally
dropping from 49% in 2001 to 37% in 2002 [Soejarto, 2003]. A study by IDC on OLAP investment
over 5-years indicated a $2.1 million investment in building OLAP solutions in-house resulted in
104% ROI [Morris, 2003]. The same study indicated a $1.8 million investment in buying pre-built
OLAP solutions resulted in 140% ROI, implying that BI solutions cost less and bring higher ROI
[Morris, 2003].
Intelligent Enterprise’s study for the 2003 editor’s choice award for BI identified 12 firms to watch
in 2003 including Adaytum, Brio Software, Cognos, Crystal Decisions, E.Intelligence, Fair Issac &
Co., Hyperion Solutions, Information Builders, MicroStrategy, ProClarity, Siebel Systems, and
Spotfire [Kestelyn, 2003]. The study also named 12 vendors as most influential in the overall
category including Teradata, SAS, IBM, OutlookSoft, Business Objects, Microsoft, Manhattan
Associates, PeopleSoft, Oracle, Ilog, Insight Software, and Open Source/Linux [Stodder, 2003].
IX. MANAGERIAL QUESTIONS
1. Is business intelligence an oxymoron? A shorthand for cloak and dagger spying on
competitors and government? An important, legitimate activity?
5
“Business Performance Management brings new levels of corporate accountability, financial
rigor, and tangible value creation to all functions, departments and units in a distributed global
organization. It is driven by the imperative to synchronize and align internal and external
constituencies with company strategies and business objectives through real-time availability and
continuous exchange of relevant and essential financial, transactional and operational
information.” [BPM Forum, 2003].
Communications of the Association for Information Systems (Volume13, 2004) 177-195 189
Business Intelligence by S. Negash
Despite its name, business intelligence is about trying to understand your own position, your
customers, and your competitors. While it is neither ethical nor legal to spy on competitors,
competitive intelligence is an important part of a firm’s planning and operational decision making
to understand its competition.
2. What is new about today’s business intelligence compared to previous systems?
Business intelligence is a natural outgrowth of a series of previous systems designed to support
decision making. The emergence of the data warehouse as a repository, the advances in data
cleansing that lead to a single truth, the greater capabilities of hardware and software, and the
boom of Internet technologies that provided the prevalent user interface all combine to create a
richer business intelligence environment than was available previously
3. What types of business intelligence are there?
Business Intelligence is used to understand the capabilities available in the firm: the state of the
art, trends, and future directions in the markets, the technologies, and the regulatory environment
in which the firm competes; and the actions of competitors and the implications of these actions.
4. What will you be able to do if you invest in BI?
Business Intelligence systems present complex corporate and competitive information to planners
and decision makers. The objective is to improve the timeliness and quality of the input to the
decision process.
5. Who uses BI?
Business intelligence is used by decision makers throughout the firm. At senior managerial
levels, it is the input to strategic and tactical decisions. At lower managerial levels, it helps
individuals to do their day-to-day job. In some firms, business intelligence capabilities are rolled
out to most of its professionals (i.e., ‘BI for the masses’)
6. How do you gather and transfer BI?
Business intelligence is a form of knowledge. The techniques used in knowledge management
for generating and transferring knowledge [Davenport and Prusak, 1998] apply. Some knowledge
is bought (e.g., scanner data in the food industry) while other knowledge is created by analysis of
internal and public data. Knowledge transfer often involves disseminating intelligence information
to many people in the firm. For example, salespeople need to know market conditions,
competitor offerings, and special offerings.
7. Do you need a separate organization for it?
Most medium and large firms assign people, often full time, to plan and to monitor competitor
action. These people are the ones who form the core groups for business intelligence initiatives.
Whether they are centralized or scattered through strategic business units (SBUs) is a matter of
organizational style.
8. What technologies are available?
Most of the technologies needed for business intelligence serve multiple purposes. For example,
the World Wide Web is used for both knowledge generation and knowledge transfer. However,
specialized software for doing analysis is the heart of business intelligence. This software is an
outgrowth of the software used for decision support and executive information systems in the
past.
190 Communications of the Association for Information Systems (Volume 13, 2004)177-195
Business Intelligence by S. Negash
X. CONCLUSIONS
The term Business Intelligence may turn out to be a fad. However, the underlying concepts, using
information technology to deliver actionable information for decision makers, are essential for
managing today’s global businesses. BI uses both structured and semi-structured data. The
former is much easier to search but the latter contains the information needed for analysis and
decision making.
For structured data, many BI tools exist for acquisition, integration, cleanup, search, analysis, and
delivery. Further work is needed, however, to integrate these tools and to provide actionable
information. BI tools for semi-structured data, on the other hand, are not yet mature. However,
significant work is being done in industry to deal with semi-structured data (Kontzer, 2004;
MacIntyer, 2004). Current trends and topics about unstructured information management can be
found at
, among others.
This paper develops a BI framework and identifies potential research areas. The BI framework
highlights the importance of semi-structured data to support informed action by decision makers.
In addition this paper explored a matrix for BI data types (structured vs. semi-structured) and data
sources (internal vs. external) to guide research.
The development of analytical tools to integrate structured and semi-structured data can benefit
from attention by researchers. The BI market is growing, and the proportion of semi-structured
data used in daily decisions is growing. Exploring the underlying issues and the development of
information technology that provide intelligence to business therefore is a fertile area for research.
.
ACKNOWLEDGEMENTS
A version of this tutorial was presented at AMCIS 2003 jointly by the author and by Paul Gray,
editor of CAIS. His contributions are gratefully acknowledged.
Editor’s Note: This article was received on September 26, 2003 and was published on March
___, 2004
REFERENCES
EDITOR’S NOTE: The following reference list contains the address of World Wide Web pages. Readers
who have the ability to access the Web directly from their computer or are reading the paper on the Web,
can gain direct access to these references. Readers are warned, however, that
1. these links existed as of the date of publication but are not guaranteed to be working
thereafter.
2. the contents of Web pages may change over time. Where version information is
provided in the References, different versions may not contain the information or the
conclusions referenced.
3. the authors of the Web pages, not CAIS, are responsible for the accuracy of their
content.
4. the author of this article, not CAIS, is responsible for the accuracy of the URL and
version information.
Amazon(2003) />8048656? v=glance&vi=reviews. Current 9/25/2003.
Balasubramanian, V. and A. Bashian (1998) “Document Management and Web Technologies:
Alice Marries the Mad Hatter”, Communications of the ACM, 41(7), pp. 107.
Communications of the Association for Information Systems (Volume13, 2004) 177-195 191
Business Intelligence by S. Negash
Blumberg, R. and S. Atre (2003a) “More than Search”, DM Review, (13)3, pp. 42-47.
Blumberg, R. and S. Atre (2003b) “The Problem with Unstructured Data”, DM Review,
/> (current Sept. 12, 2003).
Blumberg, R. and S. Atre (2003c) “Automatic Classification: Moving to the Mainstream,” DM
Review, NavID=55 &EdID=6501
(current Sept. 12,
2003).
Boncella, R. (2003) “Competitive Intelligence and the Web”, Communications of AIS, (12) 21,
September
BPM Forum (2003). />. Current 09/25/2003.
Chin, A.G. (ed.) (2001) Text Databases and Document Management: Theory and Practice,
Hershey, PA: Idea Group Publishing.
Cody, W.F. et al. (2002) “The Integration of Business Intelligence and Knowledge Management”,
IBM Systems Journal, (41)4, pp. 697-713.
Darrow, B. (Feb. 3, 2003) “Making The Right Choice—Solution Providers are Evaluating a
Plethora of Options as they Puzzle over the Future of Business Intelligence”, Computer
Reseller News, pp. 16.
Davenport, T.H. and L. Prusak (1998) Working Knowledge: How Organizations Manage What
They Know Boston, MA: Harvard Business School Press.
Floyd, R.E. (2003) “Text Databases and Document Management: Theory and Practice”, IEEE
Transactions on Professional Communication, 46(2), pp. 147.
Greenbaum, J. (2003) “The Paradox of ROI,” Intelligent Enterprise, (5)18, pp. 60-62.
Hall, H. (2000) “Online Information Sources: Tools of Business Intelligence?” Journal of
Information Science, (26)3, pp. 139.
Hannula, M. and V. Pirttimaki (2003) “Business Intelligence Empirical Study on the Top 50
Finnish Companies”, Journal of American Academy of Business, (2)2, pp. 593-601.
Hoblitzell, T. (2003) “Implementing Best Practices to Drive ROI”, DM Review, Vol. 13(1), pp. 14,
59.
Houdeshel, G. and H.J. Watson (1987) “The Management Information and Decision Support
Systems (MIDS) at Lockheed-Georgia” MIS Quarterly, (11)1, pp. 127-141.
Imhoff, C. (2003) “Keep your Friends Close, and your Enemies Closer,” DM Review, (13)4, pp.
36-37, 71.
Kestelyn, J. (2003) “Intelligence”, Intelligent Enterprise, (6)2, pp. 30
Kontzer, T. (2004). “Companies are choking on information employees create. And a spate of
vendor mergers has yet to deliver tools to deal with the problem.” InformationWeek,
/>. Current
Jan. 19, 2004.
Langseth, J. and N. Vivatrat (2003) “Why Proactive Business Intelligence is a Hallmark of the
Real-Time Enterprise: Outward Bound,” Intelligent Enterprise, (5)18, pp. 34-41.
Lavelle, L. (Nov. 2001) “The Case of the Corporate Spy in a Recession: Competitive Intelligence
can Pay Off Big”, Business Week, (56)26.
192 Communications of the Association for Information Systems (Volume 13, 2004)177-195
Business Intelligence by S. Negash
MacIntyre, B. (2004). “Information Technology Challenges Keep Rising.” The Business Journal of
Portland, Jan. 23, 2004. journals.
com/portland/stories/2004/02/23/focus8.html
Markus, M.L. and A. Lee (2000) Using Qualitative, Interpretive, and Case Methods to Study
Information Technology”, MIS Quarterly, (24)1, pp. 1-2.
McKnight, W. (2003) “Bringing data mining to the front line, part 2,” DM Review, 13(1), pp. 50.
Moores, L. (2003) “WebQL Harvests Competitive Prices for Illuminet” DM Review,
/> (Current Sept. 18, 2003).
Morris, H. (2003) “The Financial Impact of Business Analytics: Build vs. Buy”, DM Review, (13)1,
pp. 40-41.
Moss, L.T. (2003) “Nontechnical Infrastructure of BI Applications”, DM Review, (13)1, pp. 42-45.
Moss, L.T. and S. Atre (2003) Business Intelligence Roadmap: The Complete Project Lifecycle
for Decision-Support Applications, Boston, MA: Addison-Wesley.
Powell, J.H. and J.P. Bradford (2000) “Targeting Intelligence Gathering in a Dynamic Competitive
Environment”, International Journal of Information Management, (20)3, pp. 181.
Power, D.J. (2002) Decisions Support Systems: Concepts and Resources for Managers,
Westport, CT: Quorum Books.
Power, D. J. (2004)
Raynes, M. (2002) “Document Management: is the Time Now Right?” Work Study, 51(6/7), pp.
303.
Rouach, D. and P. Santi (2001) “Competitive Intelligence Adds Value: Five Intelligence Attitudes”,
European Management Journal, (19)5, pp. 552.
Rouibah, K. and S. Ould-ali (2002) “Puzzle: A Concept and Prototype for Linking Business
Intelligence to Business Strategy” The Journal of Strategic Information Systems, (11)2,
pp. 133-152.
Rudin, K. and D. Cressy (2003) “Will the Real Analytic Application Please Stand Up?” DM
Review, (13)3, pp. 30-34.
Russom, P. (2003) “Decision Support: Two Heads are Better than One”, Intelligent Enterprise,
Vol. 6 (2), pp. 14-16.
Schauer, V. (2003) “Business Objects”, DM Review, vol. 13(1), pp. 34-36.
SCIP(2003) />
Smith, M. (2002) “Business Process Intelligence – BI and Business Process Management
Technologies are Converging to Create Value Beyond the Sum of their Parts”, Intelligent
Enterprise, Dec. 5, 2002, pp. 26. [LexisNexis Academic].
Soejarto, A. (Mar. 20, 2003) “Tough Times Call for Business Intelligence Services, an
Indisputable Area of Growth”, nnelsupersearch. com/news/var/40682.asp
or
www.VarBusiness.com (current May 5, 2003).
Sprague, R.H. (1995) “Electronic Document Management: Challenges and Opportunities for
Information Systems Managers” MIS Quarterly, March 1995, pp. 29-49.
Communications of the Association for Information Systems (Volume13, 2004) 177-195 193
Business Intelligence by S. Negash
Stodder, D. (2003) “Enabling the Intelligent Enterprise: The 2003 Editors’ Choice Awards”,
Intelligent Enterprise, (6)2, pp. 22-33.
Tegarden, D.P. (1999) “Business Information Visualization” Communications of the Association
for Information Systems (1)4, /articles/1-4/default.asp
(current May
15, 2003).
Teo, T. and W.Y. Choo (2001) “Assessing the Impact of Using the Internet for Competitive
Intelligence”, Information & Management, (39)1, pp. 67.
Thomsen, E. (2003) “BI’s Promised Land”, Intelligent Enterprise, (6)4, pp. 21-25.
Vedder, R.G. and S.C. Guynes (2002) “CIOs Perspectives on Competitive Intelligence”,
Information Systems Management, (19)4, pp. 49.
Weir, J. (2000) “A Web/Business Intelligence Solution”, Information Systems Management,
(Winter) pp. 41-46.
Whiting, R. (Jan. 13, 2003) “Look Within—Business-Intelligence Tools have a New Mission:
Evaluating All Aspects of a Company’s Business”, InformationWeek, pp. 32.
Wiggins, B. (2001) "The Intelligent Enterprise Butler - Competitive Use of Intelligence in
Business", International Journal of Information Management, (21)5, pp. 397.
Willen, C. (Jan. 14, 2002) “Airborne Opportunities”, Intelligent Enterprise, (5)2, pp. 11-12.
Woojong, S. and L. Heeseok (2001) “Hypermedia Document Management: A Metadata and
Meta-Information System”, Journal of Database Management, 12(2), pp. 25-36.
Zantout, H. and F. Marir (1999) “Document Management Systems from Current Capabilities
towards Intelligent Information Retrieval: An Overview. International Journal of
Information Management, 19(6), pp. 471.
APPENDIX I. A TECHNOLOGY FOR BUSINESS INTELLIGENCE: GEOGRAPHIC
INFORMATION SYSTEMS (GIS)
In the narrow sense, a geographic information system (GIS) is a software package that links
databases and electronic maps. At a more general level, the term GIS refers to the ability to
analyze spatial phenomena. These systems are an important business intelligence tool for
exploiting and presenting the increasing amount of two (and more) dimensional data available in
a form that can be understood by analysts and managers.
In addition to collecting, storing, and retrieving spatial location data, a GIS is used to identify
locations which meet specified criteria (e.g., for new store location), exploring relations among
data sets, assessing alternatives and aiding in decision making, and displaying selected
environments both visually and numerically. In practice, a GIS consists of a series of layers, each
presenting a particular two-dimensional feature, which can be superimposed accurately on top of
one another. Some examples:
• a marketing group overlays customer locations, school locations, distribution
centers, and existing retailers selling their own and/or their competitors products.
• A telecommunications company selects the number and location of switching centers
and routes in a communication network. The system displays such quantities as
traffic, costs, and transmission times. Users can redefine the network on the screen,
can create multiple views, see the effect of ‘what if’ changes and new data because
the system re-computes for each change, take constraints into account, and shows
where the proposed solution fails to meet criteria.
194 Communications of the Association for Information Systems (Volume 13, 2004)177-195
Business Intelligence by S. Negash
APPENDIX II. A TECHNOLOGY FOR BUSINESS INTELLIGENCE: VISUALIZATION
With the flood of data available from information systems, business intelligence analysts and
decision-makers need to make sense out of the knowledge it contains. Visualization is the
process of representing data with graphical images. Unlike geographic information systems which
typically deal with physical spaces, the underlying data could, for example, represent abstract
objects, such as profit, sales, or cost. If the data is abstract, then a visual analog must be created.
Visual analogs today go far beyond the pie chart and the bar chart [Tegarten, 1999].
Visualization is used to create advanced dashboard in which large amounts of information are
presented on a single screen. Today’s results are far advanced over early dashboards such as
those shown by Houdeschel and Watson in 1987 [Houdeshel and Watson, 1987].
Visualization exploits the human visual system to extract information from data and provides an
overview of complex data sets. It identifies structure, patterns, trends, anomalies, and
relationships in data to assists in identifying the areas of "interest". That is, visualization allows BI
analysts to use their natural spatial/visual abilities to determine where further exploration should
be done and where action is required.
Visualization technologies are deployed in finance, litigation, marketing, manufacturing, training,
and organizational modeling.
APPENDIX III. EXAMPLES OF BI APPLICATIONS
The following are some examples of BI applications:
• A company that provides natural gas to homes created a dashboard that supports
operational performance metric management and allows real time decision making. In
one application of the dashboard, the number of repeat repair calls was reduced,
resulting in a saving of $1.3 million
• At a large member-owned distributor to hardware stores, use of a dashboard reduced the
amount of inventory that must be liquidated or sold as a loss leader from $60 million to
$10 million. Their BI system also allowed their member stores to see their own
performance relative to similar stores.
• The Dallas Teachers Credit Union wanted to expand. They asked two questions of the BI
system: (1) Who are our most profitable customers? 2. How far will they drive to reach
our outlets? Once they found the answer to these two questions, they were able to select
branch sites that were within the buying radius of the preferred customers.
APPENDIX IV. EXAMPLES OF COMPETITIVE ANALYSIS
The following are examples of competitive analyses:
• Texas Instruments made a $100 million acquisition based on their analysis of a
competitors potential bid, [Lavelle, 2001].
• Merck & Company developed a counter strategy to its competitor’s forth- coming product
based on competitive intelligence reports, and generated a savings of $200 million,
[Imhoff, 2003].
• Illuminet, a company that delivers advanced network, database, and billing services,
stayed a step ahead by using a vendor (QL2 Software) to retrieve information posted on
their competitors web sites [Moores, 2002].
Communications of the Association for Information Systems (Volume13, 2004) 177-195 195
Business Intelligence by S. Negash
• Most grocery chains sell their bar code scanner data to organizations such as Information
Resources Inc. (IRI) who, in turn collates the data and sells it to grocery wholesalers and
vendors. Individual firms want to find out how well their (and their competitors) special
offers, such as a 20 cent off coupon, worked in the marketplace. By examining how well
the offer worked previously, how well it worked in the current situation, and forecasting
the future effects of the promotion, a firm can decide whether to continue the offer or
change it. If it is a competitor’s offer, the forecast is used to decide whether to match or
exceed the competitor. Thus, the forecasts based on the data are converted into policy at
the tactical level.
ABOUT THE AUTHOR
Solomon Negash’s research interests include knowledge management, distance learning, and
business intelligence. His work is published in Information & Management and at conferences in
the US, Canada, Spain, and Malaysia. Dr. Negash teaches at Kennesaw State University. He has
also been on the faculties of the University of California—Riverside, Chapman University,
California State University—Fullerton, and Loyola Marymount University—Los Angeles. With an
engineering and management background, his over 20 years of industry experience include
consulting, entrepreneurship, management, and systems analysis. He worked as a business
analyst at Cambridge Technology Partners and managed his own consulting firm. He earned his
Ph.D. in Management of Information Systems from Claremont Graduate University
Copyright © 2004 by the Association for Information Systems. Permission to make digital or hard copies of
all or part of this work for personal or classroom use is granted without fee provided that copies are not
made or distributed for profit or commercial advantage and that copies bear this notice and full citation on
the first page. Copyright for components of this work owned by others than the Association for Information
Systems must be honored. Abstracting with credit is permitted. To copy otherwise, to republish, to post on
servers, or to redistribute to lists requires prior specific permission and/or fee. Request permission to publish
from: AIS Administrative Office, P.O. Box 2712 Atlanta, GA, 30301-2712 Attn: Reprints or via e-mail from
ISSN: 1529-3181
EDITOR-IN-CHIEF
Paul Gray
Claremont Graduate University
AIS SENIOR EDITORIAL BOARD
Detmar Straub
Vice President Publications
Georgia State University
Paul Gray
Editor, CAIS
Claremont Graduate University
Sirkka Jarvenpaa
Editor, JAIS
University of Texas at Austin
Edward A. Stohr
Editor-at-Large
Stevens Inst. of Technology
Blake Ives
Editor, Electronic Publications
University of Houston
Reagan Ramsower
Editor, ISWorld Net
Baylor University
CAIS ADVISORY BOARD
Gordon Davis
University of Minnesota
Ken Kraemer
Univ. of Calif. at Irvine
M.Lynne Markus
Bentley College
Richard Mason
Southern Methodist Univ.
Jay Nunamaker
University of Arizona
Henk Sol
Delft University
Ralph Sprague
University of Hawaii
Hugh J. Watson
University of Georgia
CAIS SENIOR EDITORS
Steve Alter
U. of San Francisco
Chris Holland
Manchester Bus. School
Jaak Jurison
Fordham University
Jerry Luftman
Stevens Inst.of Technology
CAIS EDITORIAL BOARD
Tung Bui
University of Hawaii
Fred Davis
U.ofArkansas, Fayetteville
Candace Deans
University of Richmond
Donna Dufner
U.of Nebraska -Omaha
Omar El Sawy
Univ. of Southern Calif.
Ali Farhoomand
University of Hong Kong
Jane Fedorowicz
Bentley College
Brent Gallupe
Queens University
Robert L. Glass
Computing Trends
Sy Goodman
Ga. Inst. of Technology
Joze Gricar
University of Maribor
Ake Gronlund
University of Umea,
Ruth Guthrie
California State Univ.
Alan Hevner
Univ. of South Florida
Juhani Iivari
Univ. of Oulu
Munir Mandviwalla
Temple University
Sal March
Vanderbilt University
Don McCubbrey
University of Denver
Emannuel Monod
University of Nantes
John Mooney
Pepperdine University
Michael Myers
University of Auckland
Seev Neumann
Tel Aviv University
Dan Power
University of No. Iowa
Ram Ramesh
SUNY-Bufallo
Maung Sein
Agder University College,
Carol Saunders
Univ. of Central Florida
Peter Seddon
University of Melbourne
Thompson Teo
National U. of Singapore
Doug Vogel
City Univ. of Hong Kong
Rolf Wigand
U. of Arkansas, Little Rock
Upkar Varshney
Georgia State Univ.
Vance Wilson
U.Wisconsin,Milwaukee
Peter Wolcott
Univ. of Nebraska-Omaha
DEPARTMENTS
Global Diffusion of the Internet.
Editors: Peter Wolcott and Sy Goodman
Information Technology and Systems.
Editors: Alan Hevner and Sal March
Papers in French
Editor: Emmanuel Monod
IS and Healthcare
Editor: Vance Wilson
ADMINISTRATIVE PERSONNEL
Eph McLean
AIS, Executive Director
Georgia State University
Samantha Spears
Subscriptions Manager
Georgia State University
Reagan Ramsower
Publisher, CAIS
Baylor University