Báo cáo khoa học: Combining theoretical analysis and experimental data generation reveals IRF9 as a crucial factor for accelerating interferon a-induced early antiviral signalling pdf
Bạn đang xem bản rút gọn của tài liệu. Xem và tải ngay bản đầy đủ của tài liệu tại đây (1.11 MB, 14 trang )
Combining theoretical analysis and experimental data
generation reveals IRF9 as a crucial factor for accelerating
interferon a-induced early antiviral signalling
Tim Maiwald
1,
*, Annette Schneider
2,
*, Hauke Busch
3
, Sven Sahle
1
, Norbert Gretz
4
,
Thomas S. Weiss
5
, Ursula Kummer
1
and Ursula Klingmu
¨
ller
2
1 Heidelberg University, Department Modeling of Biological Processes, BIOQUANT ⁄ Institute of Zoology, Germany
2 German Cancer Research Center, Division Systems Biology of Signal Transduction ⁄ BIOQUANT, DKFZ-ZMBH Alliance, Heidelberg, Germany
3 Freiburg Institute for Advanced Studies (FRIAS), Albertstraße 19 and Center for Biosystems Analysis (ZBSA), University of Freiburg, Germany
4 Heidelberg University, Medical Faculty Mannheim, Germany
5 University Medical Center Regensburg, Center for Liver Cell Research, Germany
Introduction
Invading pathogens such as viruses elicit complex
responses in host cells, and the outcome of an infection
is critically determined by the dynamics of host defence
mechanisms. Important mediators of antiviral
Keywords
antiviral signalling; interferon a; IRF9; kinetic
model; signal transduction
Correspondence
U. Klingmu
¨
ller, Division Systems Biology of
Signal Transduction, German Cancer
Research Center, Im Neuenheimer Feld
280, Heidelberg 69120, Germany
Fax: +49 6221 42 4488
Tel: +49 6221 42 4481
E-mail:
Database
The mathematical model describedhere has
been submitted to the Online Cellular
Systems Modelling Database and can be
accessed at />database/maiwald/index.html free of charge
*These authors contributed equally to this
work
(Received 19 June 2010, revised 20 August
2010, accepted 13 September 2010)
doi:10.1111/j.1742-4658.2010.07880.x
Type I interferons (IFN) are important components of the innate antiviral
response. A key signalling pathway activated by IFNa is the Janus kinase ⁄
signal transducer and activator of transcription (JAK ⁄ STAT) pathway.
Major components of the pathway have been identified. However, critical
kinetic properties that facilitate accelerated initiation of intracellular
antiviral signalling and thereby promote virus elimination remain to be
determined. By combining mathematical modelling with experimental
analysis, we show that control of dynamic behaviour is not distributed
among several pathway components but can be primarily attributed to
interferon regulatory factor 9 (IRF9), constituting a positive feedback loop.
Model simulations revealed that increasing the initial IRF9 concentration
reduced the time to peak, increased the amplitude and enhanced termina-
tion of pathway activation. These model predictions were experimentally
verified by IRF9 over-expression studies. Furthermore, acceleration of
signal processing was linked to more rapid and enhanced expression of
IFNa target genes. Thus, the amount of cellular IRF9 is a crucial
determinant for amplification of early dynamics of IFNa-mediated signal
transduction.
Abbreviations
C ⁄ EBP-b, CCAAT-enhancer-binding protein b; IFN, interferon; IRF9, interferon regulatory factor 9; ISGF3, interferon-stimulated gene factor 3;
ISG, interferon-stimulated gene; JAK, Janus kinase; PIAS, protein inhibitor of activated STATs; PKR, protein kinase R; SOCS, suppressor
of cytokine signalling; STAT, signal transducer and activator of transcription; SHP-2, SH2-containing phosphatases; TYK2, tyrosine kinase 2;
TFBS, transcription factor binding sites; USP18, ubiquitin specific peptidase 18.
FEBS Journal 277 (2010) 4741–4754 ª 2010 The Authors Journal compilation ª 2010 FEBS 4741
responses are type I interferons (IFN), which are used
in the treatment of hepatitis B and C virus infections.
However, success of the treatment is highly patient-
dependent [1]. As a rapid IFN response may be deci-
sive for a viral infection [2], it is important to identify
factors that regulate IFN signalling kinetics and that
may be a reason for patient-to-patient variations.
In general, several potential mechanisms are possible
to expedite signal transduction. As shown for the
epidermal growth factor receptor system, increasing
ligand concentrations result in earlier maximal pathway
activation and an increase in signal amplitude [3,4].
Furthermore, alterations in the activity of a kinase or
phosphatase may affect the speed of signalling pathway
activation. However, theoretical studies by Heinrich
et al. [5] indicated that kinase activity primarily regulates
signal amplitude rather than signalling time, whereas
phosphatases enhance the signalling time, but lead to a
decrease in signal amplitude. Currently, very little is
known regarding specific mechanisms that could be
exploited to accelerate IFN signalling.
A key signalling pathway activated by type I IFN is
the JAK ⁄ STAT pathway. The Janus kinases JAK1
and tyrosine kinase 2 (TYK2) are activated in response
to ligand binding to the receptor, and these kinases
phosphorylate signal transducers and activators of
transcription STAT1 and STAT2. In contrast to other
JAK ⁄ STAT signalling pathways, type I IFN signalling
additionally involves interferon regulatory factor 9
(IRF9 ⁄ p48), which, together with phosphorylated
STAT1 ⁄ STAT2 dimers, forms the interferon-stimu-
lated gene factor 3 (ISGF3) complex. ISGF3 is translo-
cated to the nucleus and activates transcription of
interferon-stimulated genes [6]. Amongst others, this
leads to induction of suppressor of cytokine signalling
(SOCS) proteins that modulate termination of pathway
activation. Furthermore, the expression of IRF9 is
induced, constituting a positive feedback loop. IRF9
plays an important role in IFNa signalling [7]. Increas-
ing the amount of IRF9 by over-expression or pre-
stimulation of cells with IFNc or interleukin-6 results
in higher levels of transcription of IFN-stimulated
genes [8–11] and an augmented antiviral response [11–
13]. However, the specific impact of IRF9 on the
dynamics of pathway activation, such as signalling
speed and extent, remains to be identified.
To unravel the highly non-linear relations determin-
ing the timing and extent of signalling pathway activa-
tion, establishment of a dynamic pathway model is
required. Previous modelling approaches analysing the
JAK ⁄ STAT pathway focussed on the impact of phos-
phatases and induced negative inhibitors [14–16] that
primarily influence pathway termination. Here, we
have developed a mathematical model of IFNa signal
transduction, including the known key players and
feedback mechanisms, to identify systems properties
that facilitate accelerated IFNa signalling. Using this
approach, IRF9 was predicted to not only increase the
amount of active ISGF3, but also to accelerate signal
transduction into the nucleus, as verified experimen-
tally by IRF9 over-expression studies. Moreover, the
accelerated signal processing also resulted in faster and
increased expression of target genes. Thus, we identified
IRF9 as a pivotal player for the speed and efficiency
of IFNa signal transduction.
Results
A data-based mathematical model of IFNa
signalling with predictive power
To investigate the dynamic properties of IFNa-medi-
ated JAK ⁄ STAT activation, we developed a mathemat-
ical model comprising the known key components,
feedback responses and constitutive regulatory mecha-
nisms (Fig. 1A, Table S1 and Appendix S1). Specifi-
cally, we included constitutive negative regulations by
general phosphatases and protein inhibitor of activated
STATs (PIAS), as well as constitutive degradation of
receptors, IRF9 and mRNA. Receptor dephosphoryla-
tion by SH2-containing phosphatase 2 (SHP-2) was
represented by a constant kinetic parameter indepen-
dent of SHP-2 concentration, as changes in SHP-2
concentration were assumed to be negligible during the
measured timescale. Furthermore, the negative feed-
back loop of ISGF3-mediated SOCS induction was
incorporated. IRF9 synthesis was included as a positive
feedback mechanism as IFN-dependent expression of
IRF9 was experimentally observed within the relevant
timescale (Fig. 1B). Further features of the model were
based on literature evidence: (i) IRF9 is constitutively
bound to unphosphorylated STAT2 in the unstimu-
lated system [17], (ii) unphosphorylated STAT1 and
STAT2 shuttle constantly between the cytoplasm and
nucleus, and nuclear import of STAT2 is increased by
IRF9 binding [18], (iii) free IRF9 is mainly localized to
the nucleus [19], and (iv) phosphorylated STAT1 ⁄
STAT2 heterodimers require IRF9 to bind IFN-stimu-
lated response elements [20]. IRF9 independent DNA-
binding of STAT heterodimers was not considered, as
these complexes bind to different DNA elements, the
c activation sites that are involved in IFNc signalling.
Thus, in the model, no gene expression occurs in the
absence of IRF9 (Table S1 and Appendix S1).
For model calibration, kinetic parameters were
taken from the literature (Table S2) or trained against
IRF9 accelerates IFNa signal transduction T. Maiwald et al.
4742 FEBS Journal 277 (2010) 4741–4754 ª 2010 The Authors Journal compilation ª 2010 FEBS
A
B
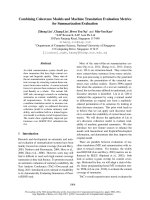
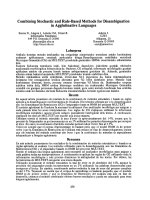
Fig. 1. Kinetic model of the IFNa signalling pathway. (A) Simplified view of the model architecture is shown, with the activation of STAT
proteins summarized as one reaction and omitting receptor endocytosis, constitutive IRF9 degradation and nuclear translocation of phosphor-
ylated STAT1 ⁄ STAT2 heterodimers. For details, see Table S1. Circle-headed lines, reaction catalysis; lines with perpendicular bars, reaction
inhibition; single-dotted arrows, transcription mRNA to IRF9 ⁄ SOCS; TFBS, transcription factor binding site. The scheme was generated using
CellDesigner [53]. (B) Dynamic behaviour of IFNa signalling. Activation of cytoplasmic pJAK1, pSTAT1 and nuclear IRF9 measured by quanti-
tative immunoblotting after stimulating Huh7.5 cells with 500 UÆmL
)1
IFNa. To facilitate direct comparison, the same scale was used on the
y axis for the experimental data as used for the model simulation. Minor levels of basal phosphorylation could not be eliminated by starva-
tion for 3 h. For phosphorylated JAK1, the background signal (defined as the signal for the immunoblot in areas other than the protein bands)
was subtracted to better distinguish background noise from the actual signal. The background level in the data for phosphorylated STAT pro-
teins was low, so background corrections did not alter the results. A representative plot is shown in each case, and the experiment was
repeated at least three times (see Fig. S3A for additional data). The error bars represent a technical relative error of 18%, derived from multi-
ple measurements (Fig. S1). Filled circles, experimental data; dashed lines, smoothing splines; a.u., arbitrary units. The model simulation
(line) for pJAK1, pSTAT1 and IRF9 was performed using COPASI [23]. The simulations are within the range of data reproducibility.
T. Maiwald et al. IRF9 accelerates IFNa signal transduction
FEBS Journal 277 (2010) 4741–4754 ª 2010 The Authors Journal compilation ª 2010 FEBS 4743
experimental data (Fig. 1B), with all kinetic parame-
ters being estimated within a physiologically meaning-
ful range. Model simulations start in the steady state,
without any IFNa-dependent phosphorylation of
signalling components. The minor amounts of basal
phosphorylation of STAT1 shown in the data
(Fig. 1B) were not considered for calibration. This
phosphorylation was not affected by 3 h starvation, a
time period that is sufficient for decay of IFNa sig-
nalling in Huh7.5 cells, and therefore appeared to be
independent of a major IFNa stimulus. The initial
concentrations of STAT1, STAT2, JAK1, TYK2 and
IRF9 were experimentally determined (Fig. S2 and
Table S3). Experiments were performed in Huh7.5
human hepatocarcinoma cells, which show dynamic
behaviour comparable to that of primary human
hepatocytes (Fig. S3A,C). Previous studies suggested
that approximately 30% of the total amount of
STAT molecules is phosphorylated after IFNa stimu-
lation [21]. Finally, the major signalling peak was
assumed to occur between 20 and 60 min after
IFNa stimulation. The inclusion of various feedback
mechanisms is necessary for analysis of their specific
impact, but leads to an underdetermined system due
to the number of unknown kinetic parameters. How-
ever, the established model is consistent with the
experimental data (Fig. 1B), and permits qualitative
predictions.
Identification of IRF9 as an accelerator of IFNa
signalling
To systematically identify components that control the
timing and extent of IFNa signalling, a sensitivity
analysis was performed with initial protein concentra-
tions as input (Fig. 2A). As output, both the peak time
and the integrated response of the DNA-bound
pSTAT1–pSTAT2–IRF9 (ISGF3) complex were analy-
sed. These system quantities that represent the speed
and the extent of signal transduction were selected as
they are likely to be crucial for an efficient antiviral
response.
In contrast to other systems, for which control is
widely distributed [22], only a few molecules controlled
the systems behaviour of IFNa signalling. Among the
identified proteins, nuclear phosphatases had a pro-
nounced effect, positively influencing the peak time,
but greatly decreasing the integrated response, in line
with previous theoretical studies [5]. A higher ligand
dose resulted in increased signal amplitude, but had
only a minor effect on signal duration, as confirmed
experimentally (Fig. S3B). Of the signal transducers,
STAT1 and IRF9 exerted the greatest control. STAT1
had a positive effect on the integrated response, but
negatively influenced the peak time. IRF9 was the only
factor that had a substantial positive effect on the peak
time and also increased the integrated response.
A
B
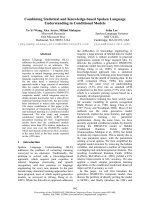
Fig. 2. Sensitivity analysis for peak time and integrated responses. Initial concentrations of all players were varied to calculate their control
coefficient on the kinetic behaviour of the system. (A) Sensitivity analysis using the original parameter set. (B) Global sensitivity analysis
using 998 parameter sets.
IRF9 accelerates IFNa signal transduction T. Maiwald et al.
4744 FEBS Journal 277 (2010) 4741–4754 ª 2010 The Authors Journal compilation ª 2010 FEBS
To confirm that the results derived by the sensitivity
analysis were not restricted to the original parameter
set, the same approach was repeated using diverse
parameter sets. For this purpose, a random search
implemented in the optimization task of the simulation
software copasi [23] was used to vary all model
parameters between ±50% of their original value. As
fitting constraints, the resulting kinetic behaviours had
to reproduce the experimental data (Fig. 1B). Using
this process, 998 parameter sets matching the given
criteria were obtained. Further analysis of these data
sets showed that the kinetic parameters could vary
quite substantially and still reproduce the experimental
data. Therefore, it is important to not only examine
parameter sensitivities at a single point in parameter
space, but also to use a more global approach. The
obtained parameter sets were used for a global sensi-
tivity analysis. As shown in Fig. 2B, the most sensitive
component in both analyses was IRF9, supporting
its central role. The influence of IFNa on the time
of the signalling peak differed: in contrast to the
previous analysis, increasing IFN concentrations led to
a delayed peak for most parameter sets (Fig. 2B).
However, in the experimental data the peak time for
different interferon doses was comparable (Fig. S3B),
and thus it was reasonable to retain the original
parameter set for further analysis. In conclusion, major
sensitivities were conserved throughout the parameter
space, confirming that IRF9 has an important impact
on the kinetic behaviour of the system, independent of
specific parameter sets.
We performed additional model simulations to quali-
tatively examine the impact of large variations in IRF9
expression levels on the dynamic behaviour of IFNa
signalling, as sensitivity analyses describe only small
changes at single points within the parameter space.
Indeed, a major increase in IRF9 levels accelerated
signal transduction from the cytoplasm to the nucleus,
resulting in a greater amount of active ISGF3 in the
nucleus at earlier time points (Fig. 3A). Furthermore,
our model predicted a steeper signalling decline after
the peak for cells with elevated IRF9 levels. To deter-
mine whether this effect is the result of up-regulated
transcription of negative inhibitors (SOCS proteins),
we removed SOCS1 induction in silico. Without this
negative feedback, signal termination was attenuated
in the IRF9 over-expressing cells, and de novo IRF9
synthesis in wild-type cells accounted for enhanced
signalling during the analysed timescale (Fig. S4A).
To experimentally validate the model predictions,
IRF9 was stably over-expressed in Huh7.5 cells by
lentiviral transduction (Fig. S5). The phosphorylation
kinetics of nuclear STAT1 and STAT2 in response to
stimulation with 500 UÆmL
)1
IFNa were determined
by quantitative immunoblotting (Fig. 3B). In line with
the model analysis, cells over-expressing IRF9 showed
a higher and earlier activation peak in the nucleus as
well as a steeper peak decline compared to wild-type
cells. To determine whether different IRF9 induction
rates have similar effects, we varied the parameter for
IRF9 synthesis in silico. More rapid IRF9 synthesis
resulted in enhanced IFNa signalling, and eliminating
the positive feedback dampened the response
(Fig. S4B). Complete absence of IRF9 was predicted
to lead to a reduction in the amounts of phosphory-
lated STAT proteins (Fig. S4C).
In principle, the effects of IRF9 could be achieved
by two mechanisms. IRF9 could decelerate dephos-
phorylation of activated STAT1 ⁄ 2, as phosphorylated
STAT1 ⁄ 2 complexes can only bind specifically to
DNA in combination with IRF9, and DNA-bound
STAT proteins are protected from nuclear phosphatase
activity [24]. This mechanism was implemented in the
model. As a potential alternative mechanism, nuclear
import of phosphorylated STAT1 ⁄ 2 could be increased
upon interaction with IRF9. This is based on the
observation that IRF9 possesses a strong constitutive
nuclear localization signal recognized by a variety of
importins, whereas the nuclear localization signal of
phosphorylated STAT1 ⁄ 2 heterodimers is only recog-
nized by importin a-5 [25]. Therefore, complexes
harbouring both types of nuclear localization signal
would have an increased chance of interacting with a
matching importin, resulting in enhanced nuclear
translocation kinetics.
We performed model simulations to assess the
impact of both effects. In silico analysis indicated that
increasing IRF9-dependent nuclear import kinetics
while neglecting IRF9-mediated phosphatase protec-
tion could not represent the experimental data.
However, a model describing the observed dynamics
solely on the basis of IRF9-dependent phosphatase
protection of DNA-bound ISGF3 was necessary and
sufficient to reproduce the observed kinetic data
(Fig. 3C).
Hence, our analysis identified IRF9 as crucial for
both rapid and efficient IFNa-mediated signal trans-
duction, and suggests an increased probability of
DNA-binding of ISGF3 as the underlying mechanism.
Over-expression of IRF9 accelerates and increases
IFNa-stimulated gene expression
To test whether the accelerated and enhanced nuclear
presence of phosphorylated STAT1 ⁄ 2 proteins upon
IRF9 over-expression resulted in altered gene activation
T. Maiwald et al. IRF9 accelerates IFNa signal transduction
FEBS Journal 277 (2010) 4741–4754 ª 2010 The Authors Journal compilation ª 2010 FEBS 4745
kinetics, we analysed the expression of IFNa-stimulated
genes by quantitative real-time PCR. RNA levels of
the antiviral genes protein kinase R (PKR) [26] and
interferon stimulated gene 56 (ISG56) [27], as well as the
genes encoding negative inhibitors SOCS1 [28] and ubi-
quitin specific peptidase (USP18), were determined at
various time points for up to 24 h. USP18 is a protease
that cleaves the IFN-induced, ubiquitin-like modifier
ISG15 from its target proteins [29], and was also
reported recently to block phosphorylation of JAK1
[30].
The examined genes were strongly induced by IFNa
(Fig. 4A). Interestingly, each gene analysed displayed
different expression kinetics. SOCS1 exhibited very fast
induction followed by rapid repression. USP18, on the
other hand, displayed increased expression for up to
24 h. Similar to USP18, the antiviral genes ISG56 and
PKR showed prolonged up-regulation. Interestingly,
for all genes investigated, induction of gene expression
was faster when IRF9 levels were elevated, consistent
with the general mRNA induction predicted by the
model (Fig. S4D). For ISG56, SOCS1 and USP18,a
A
B
C
Fig. 3. IRF9 controls the dynamics of IFNa signalling. (A) Model prediction of IFNa-dependent pSTAT1 ⁄ pSTAT2 accumulation in the nucleus,
which is equivalent to the kinetics of ISGF3 (pSTAT1-pSTAT2-IRF9). Simulations (lines) were performed for wild-type cells (wt) and for cells
with 32-fold IRF9 over-expression (IRF9oe). (B) Experimental validation of the model prediction. Wild-type Huh7.5 cells (wt) or Huh7.5 cells
stably over-expressing IRF9 32-fold (IRF9oe) were stimulated with 500 UÆmL
)1
IFNa, and phosphorylation of nuclear STAT proteins was mea-
sured by quantitative immunoblotting (see Fig. S5). To facilitate direct comparison, the same scale was used on the y axis for the experi-
mental data as used for the model simulation. Over-expression of a control protein (GFP) had no effect on the dynamic behaviour (Fig. S6).
The error bars represent a technical relative error of 18%, derived from multiple measurements (Fig. S1). Filled circles, experimental data;
dashed lines, smoothing splines; a.u., arbitrary units. (C) In silico analysis of two potential mechanisms underlying the effect of IRF9. Simula-
tion of DNA-bound ISGF3 and pSTAT1–pSTAT2 heterodimers in the nucleus, representing situations where IRF9 leads to increased nuclear
import of pSTAT1–pSTAT2 or provides protection from phosphatase degradation.
IRF9 accelerates IFNa signal transduction T. Maiwald et al.
4746 FEBS Journal 277 (2010) 4741–4754 ª 2010 The Authors Journal compilation ª 2010 FEBS
high IRF9 level resulted in an increased peak ampli-
tude, but the peak amplitude was unaltered for PKR.
The integrated response was larger for each of the four
genes when IRF9 was overexpressed, with a more pro-
nounced difference during the first 4 h (Fig. 4A).
To confirm that the observed effect was not
restricted to the tested genes, we investigated the glo-
bal induction of IFNa-stimulated genes using a time-
resolved microarray (Fig. 4B,C). For data analysis, we
selected genes that showed an increased relative
α
α
α
α
A
BC
–2
–2
–2
–2
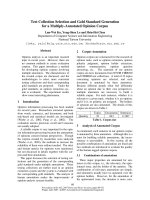
Fig. 4. IRF9 controls the dynamics of IFNa-induced gene expression. Huh7.5 wild-type cells stably transduced with an empty vector (wt) or
IRF9-over-expressing cells (IRF9oe) were stimulated with 500 UÆmL
)1
IFNa, and RNA was extracted at the indicated time points. (A) Quanti-
tative real-time PCR analysis of four sample genes. For each gene, the integrated response was calculated for early (4 h) and late (24 h) time
points. (B,C) Time-resolved microarray analysis performed with one replicate per time point. (B) Kinetics of representative genes in Huh7.5
wild-type cells stably transduced with an empty vector (wt) or in IRF9-over-expressing cells (IRF9oe) (C) Scatter plot showing the difference
in gene induction time and mean fold expression in control or IRF9-over-expressing cells. Positive values indicate accelerated and augmented
gene expression in IRF9oe cells. The genes indicated show an increased relative expression upon IFNa stimulation in either wild-type or
IRF9-over-expressing cells and have a difference in gene induction time of less than 6 h (257 genes). SOCS1 and IRF9 are also included.
There is a clear trend for faster and augmented gene expression in the IRF9-over-expressing cells, as demonstrated by the positive slope of
a linear model y = b + m*x, which was fitted to the data points. The variables x and y indicate the time difference of activation and the
mean differential expression, respectively. The slope (m = 0.08; P value = 0.00006, t test) and intercept (b = 0.25; P value < 2e-16, t test)
were estimated using the lm() function in R, version 2.11.1 ().
T. Maiwald et al. IRF9 accelerates IFNa signal transduction
FEBS Journal 277 (2010) 4741–4754 ª 2010 The Authors Journal compilation ª 2010 FEBS 4747
expression in both wild-type and IRF9-over-expressing
cells upon stimulation with IFNa. A gene ontology
analysis using DAVID [31] showed that these 284
genes are related to immune and virus response as well
as antigen processing and presentation, as expected
(Table S4). Gene expression time series were character-
ized with respect to the differences in mean fold
expression and temporal regulation (see Experimental
procedures). There was an overall positive correlation
between the level of gene expression and the expression
kinetics: genes that were more strongly up-regulated in
the IRF9-over-expressing cells were also induced ear-
lier. Remarkably, this was true for the majority of the
genes in the IRF9-over-expressing cells compared to
wild-type cells (160 out of 257). One exception was
IRF9 itself, as it could not be induced much beyond
the already high expression level in over-expressing
cells. Taken together, these data demonstrate that an
elevated amount of IRF9 not only results in higher
levels of transcription, but also in accelerated expres-
sion of IFNa target genes.
Discussion
Here we describe the development of a comprehensive
model of IFNa signalling and its experimental valida-
tion. The aim of our modelling approach was to
qualitatively predict the interplay between various
molecules and feedback mechanisms, requiring consid-
eration of all known pathway components. Obviously,
a mathematical model that includes all known nega-
tive and positive feedbacks represents an underdeter-
mined system as it contains too many parameters that
cannot be reliably estimated from the experimental
data. To verify the predictive power of our model, a
sensitivity analysis of 998 parameter sets describing
the experimental data was performed, and the results
obtained were compared to those for the original
parameter set (Fig. 2A,B). The observations were
comparable, indicating that they are intrinsic proper-
ties of the model structure. The robustness of sensitiv-
ity against single parameter changes has been
described by Gutenkunst et al. [32], suggesting that
model predictions are reasonable when they are
derived from collective fits and can only be improved
by precise and complete measurements of all kinetic
parameters. According to the sensitivity analysis,
IRF9 is a decisive factor in IFNa signalling as it rep-
resents the only component that both augments and
accelerates antiviral gene expression. This was con-
firmed by in silico analysis simulating IRF9 over-
expression and subsequently experimentally validated
(Fig. 3A,B). Our approach focused on the qualitative
analysis of mechanisms that determine signalling speed
and the extent of pathway activation. The model was
used to design experiments that would be most infor-
mative, and the experimental data were in qualitative
agreement with the model predictions, although some
deviations in quantitative terms were observed, such
as smaller differences between peaks in experimental
data compared to the model prediction. Importantly,
the main characteristics of signalling kinetics could be
validated.
Increasing the initial IRF9 concentration by over-
expression resulted in higher levels of phosphorylated
STAT proteins in the nucleus, and consequently
augmented expression of IFNa target genes. This is
consistent with previous reports describing the
impact of IRF9 on the amount of active ISGF3 [8–11].
However, in contrast to previous studies, we analysed
the IFNa response in a time-resolved manner. We
showed that enhanced IFNa-induced gene expression
not only applies at isolated time points but also for
the overall integrated response. In addition, we demon-
strated that IRF9 is also crucial for the speed of the
IFNa response, with higher IRF9 levels accelerating
signal transduction and gene expression. Theoretically,
these effects of IRF9 could be achieved by two
mechanisms: by increased nuclear import of the signal
transducers or by IRF9-mediated protection from
nuclear phosphatases. Model analysis excluded acceler-
ated nuclear import and indicated protection from
nuclear phosphatases as the underlying mechanism.
These mechanisms are difficult to address experimen-
tally, but, by disentangling the involved processes, the
mathematical modelling approach provides important
insights for further studies.
Both in wildtype and IRF9 overexpressing cells, the
analysed genes showed different expression kinetics.
Possible mechanisms explaining this behaviour are
varying production rates and differences in mRNA
stability. Furthermore, IFN-stimulated transcription
factors may account for the sustained activation of
certain genes, constituting positive feedback loops.
Regulatory networks in which individual genes are
regulated by a cascade of multiple transcription fac-
tors were recently shown to play an important role in
the antiviral response [33]. Here, SOCS1 expression
was rapidly activated and repressed, whereas the acti-
vation of USP18 was sustained. These observations
are in agreement with a recent report stating that
SOCS1 is responsible for early inhibition of IFNa sig-
nalling, whereas USP18 mediates late inhibition [34].
The sustained response could be explained by an addi-
tional positive feedback. As shown in previous studies,
expression of the IRF9 gene is regulated through a
IRF9 accelerates IFNa signal transduction T. Maiwald et al.
4748 FEBS Journal 277 (2010) 4741–4754 ª 2010 The Authors Journal compilation ª 2010 FEBS
positive feedback loop by the IFN-stimulated tran-
scription factor CCAAT-enhancer-binding protein b
(C ⁄ EBP-b) [35]. The prolonged up-regulation of other
IFN-stimulated genes could be mediated by IRF7,
which is produced in response to IFNa and is able to
bind promoters of IFN-inducible genes [36]. The exis-
tence of positive feedback mechanisms could be a gen-
eral design principle in IFN signalling to enhance the
antiviral response. In contrast to oncogenic pathways,
augmented IFN signalling is not detrimental to an
organism, as it does not lead to uncontrolled cell pro-
liferation, but rather to apoptosis [37].
While we were performing experiments in Huh7.5
cells to validate the model predictions, the enhanced
IFN response as an effect of increased IRF9 levels was
also demonstrated in various cell types, suggesting a
general mechanism [11,12]. Individual cells in a cell
population may elicit different responses [38]. Never-
theless, we aimed to develop a population-based
model, as the IFNa response primarily occurs at the
tissue level, comprising a population of individual cells.
Additionally, regulation of gene expression is likely to
differ between individuals. Therefore, variations in
either IRF9 initial concentrations or the IRF9 induc-
tion rate may be one reason for patient-to-patient vari-
ations in responses to IFNa therapy. As demonstrated
by model simulations, not only higher IRF9 levels, but
also faster IRF9 synthesis, significantly augment early
IFN signalling. Consequently, the balance between
positive and negative feedback loops (e.g. IRF9 ⁄
SOCS) may be decisive.
As a rapid IFN response could be crucial for a viral
infection [2], the IRF9 level in a cell may play a
pivotal role. In line with this, IRF9 was shown to be
targeted by several viruses in order to interfere with
the cellular antiviral response, as demonstrated for
human papillomavirus [39,40], reovirus [41], adeno-
virus [12], hepatitis B virus [42] and human cytomega-
lovirus [43]. Moreover, it was shown that elevated
IRF9 levels increase the antiviral response [10,12].
Additionally, it was recently reported that IRF9 is
necessary for the anti-proliferative activity of IFNa,as
only RNAi against IRF9, but not against STAT1,
inhibited IFNa-mediated apoptosis [44].
In conclusion, our modelling approach, in combi-
nation with experimental analysis, confirmed that ele-
vated IRF9 starting levels are a crucial determinant
for amplified IFNa-mediated antiviral signalling,
and additionally identified the IRF9 level to be vital
for a rapid response. As a key regulator shaping
the early phase of IFNa signalling, IRF9 repre-
sents an appealing target for innovative therapeutic
approaches.
Experimental procedures
Cells and time-course experiments
Huh7.5 cells (a kind gift from C. M. Rice, Laboratory of
Virology and Infectious Disease, Rockefeller University,
NY) were cultivated in Dulbecco’s modified Eagle’s
medium (DMEM; Invitrogen, Carlsbad, CA, USA) supple-
mented with 10% fetal bovine serum (Invitrogen) and 1%
penicillin ⁄ streptomycin (Invitrogen). One day before com-
mencement of a time-course experiment, 1.7 · 10
6
cells
were seeded into 6 cm dishes. Prior to stimulation with
IFNa, the cells were washed three times by removing the
culture medium and replacing it with DMEM, and after-
wards cultivated in starvation medium for 3 h [DMEM
supplemented with 1 mgÆmL
)1
BSA (Sigma-Aldrich, St Louis,
MO, USA) and 25 mm Hepes pH 7.0 (Invitrogen)].
To stimulate cells, human leukocyte IFNa (R&D Systems,
Minneapolis, MN, USA) was added to the medium to a
final concentration of 500 UÆmL
)1
. For each time point,
the contents of one dish were lysed using 1% Nonidet P-40
lysis buffer (1% Nonidet P-40, 150 mm NaCl, 20 mm Tris
pH 7.4, 10 m m NaF, 1 mm EDTA pH 8.0, 1 mm ZnCl
2
pH 4.0, 1 mm MgCl
2
,1mm Na
3
VO
4
, 10% glycerol, freshly
supplemented with 2 lgÆmL
)1
aprotinin and 200 lgÆmL
)1
4-(2-aminoethyl)-benzensulfonylfluoride), and the lysates
were used for immunoprecipitation or directly analysed by
SDS ⁄ PAGE. For cell fractionation, cells were lysed using
0.4% Nonidet P-40 cytoplasmic lysis buffer (0.4% Noni-
det P-40, 10 mm Hepes pH 7.9, 10 mm KCl, 0.1 mm
EDTA, 0.1 mm EGTA, freshly supplemented with
2 lgÆmL
)1
aprotinin, 200 lgÆmL
)1
4-(2-aminoethyl)-benzen-
sulfonylfluoride, 1 mm dithiothreitol, 1 mm NaF, 0.1 mm
Na
3
VO
4
), and vortexed for 10 s. After centrifugation
(1 min at 17 900 g,4°C), supernatants were used as the
cytoplasmic fraction and the nuclear pellet was resus-
pended in nuclear lysis buffer (20 m m Hepes pH 7.9, 25%
glycerin, 400 mm NaCl, 1 mm EDTA, 1 mm EGTA, freshly
supplemented with 2 lgÆmL
)1
aprotinin, 200 lgÆmL
)1
4-(2-aminoethyl)-benzensulfonylfluoride, 1 mm dithiothreitol,
1mm NaF, 0.1 mm Na
3
VO
4
) by repeated vortexing. The
suitability of the procedure was verified by confirming the
presence of the nuclear marker protein poly [ADP-ribose]
polymerase 1 and the cytoplasmic marker protein Eps15 in
the corresponding fractions.
Primary human hepatocytes were isolated and cultivated
in serum-free Williams’ Medium E (Biochrom AG, Berlin,
Germany) [45]. The viability of isolated hepatocytes was
determined by trypan blue exclusion. Only cell preparations
with a viability > 80% were used for experiments. The iso-
lated cells were seeded on collagen type I-coated culture
dishes at a density of 1.2 · 10
5
cells per cm
2
. Tissue sam-
ples from human liver resection were obtained from
patients undergoing partial hepatectomy for metastatic
liver tumor secondary to colorectal cancer. Experimental
T. Maiwald et al. IRF9 accelerates IFNa signal transduction
FEBS Journal 277 (2010) 4741–4754 ª 2010 The Authors Journal compilation ª 2010 FEBS 4749
procedures were performed according to the guidelines of
the charitable state-controlled foundation Human Tissue
and Cell Research, with the patient’s informed consent [46],
as approved by the local ethical committee.
The day after isolation, the primary hepatocytes were cul-
tivated for 2 days in Williams Medium E supplemented with
2mml-glutamine (Invitrogen), 100 nm dexomethasone
(Sigma) and 1% penicillin ⁄ streptomycin (Invitrogen). Prior
to stimulation with IFNa, the cells were washed three times
by removing the culture medium and replacing it with
Williams Medium E and afterwards cultivated in starvation
medium for 3 h (Williams Medium E supplemented with
2mml-glutamine). The time-course experiment was per-
formed according to the protocol for Huh7.5 cells.
Quantitative immunoblotting
For immunoprecipitation, the lysates were incubated with
anti-JAK1 serum (Upstate Millipore, Billerica, MA, USA)
and anti-TYK2 polyclonal IgGs (Upstate Millipore) and
protein A–Sepharose beads (GE Healthcare, Chalfont, NJ,
United Kingdom). For cellular lysates, protein concentra-
tions were measured using the BCA assay (Pierce, Thermo
Fisher Scientific Inc., Waltham, MA, USA). Immunoprecipi-
tated proteins, cytoplasmic (70–80 lg) or nuclear lysates
(45 lg) were loaded in a randomized manner on a 10%
SDS ⁄ polyacrylamide gel as described previously [47], sepa-
rated by electrophoresis and transferred to poly(vinylidene
difluoride) (STATs, IRF9) or nitrocellulose membranes
(JAK1, TYK2). Proteins were immobilized using Ponceau S
solution (Sigma-Aldrich) followed by immunoblotting anal-
ysis using anti-phosphotyrosine monoclonal IgG 4G10
(Upstate Millipore) for the phosphorylation signal of im-
munoprecipitated JAK1 and TYK2, anti-phospho-STAT1
IgG (Cell Signaling Technologies, Danvers, MA, USA),
anti-phospho-STAT2 IgG (Cell Signaling Technologies)
and anti-IRF9 IgG (BD Bioscience, Franklin Lakes, NJ,
USA). Antibodies were removed by treating the blots with
b-mercaptoethanol and SDS. Reprobing was performed
using anti-JAK1 (Cell Signaling Technologies), anti-TYK2
(Upstate Millipore), anti-STAT1 and anti-STAT2 (Upstate
Millipore). For normalization, IgGs against calnexin
(Stressgen, Enzo Life Sciences, Plymouth Meeting, PA,
USA) and poly [ADP-ribose] polymerase 1 (Roche, Basel,
Switzerland) were used. Secondary horseradish peroxidase-
conjugated IgGs (anti-rabbit HRP, anti-goat HRP,
protein A HRP) were purchased from GE Healthcare.
Immunoblots were incubated with enhanced chemilumines-
cence (ECL) or ECL Advance substrate (Amersham), and
signals were detected using a CCD camera (LumiImager F1
workstation; Roche). This ensured measurements were in
the linear range, avoiding saturation effects. Data were
quantified using lumianalyst 3.1 software (Roche).
Quantitative immunoblotting data were processed using
gelinspector software [48]. The following normalizers were
used: GST-TYK2DC or GST-JAK1DN for pJAK1, JAK1,
pTYK2 and TYK2, calnexin for pSTAT1, STAT1, pSTAT2,
STAT2 and IRF9, in the cytoplasm and poly [ADP-ribose]
polymerase 1 for pSTAT1, STAT1, pSTAT2, STAT2 and
IRF9 in the nucleus. To smooth spline estimates of the data,
MATLAB () csaps-splines with a
smoothness between 0.7 and 0.9 were used.
Plasmids, recombinant proteins and lentiviral
transduction
Recombinant proteins were used as normalizers and as refer-
ences to determine the number of molecules per cell. To
generate N-terminally GST- and SBP-tagged constructs, the
pGEX system (GE Healthcare) and the derived pSBPEX sys-
tem, in which glutathione S-transferase (GST) was replaced
by strepatavidin binding tag (SBP), were used. To construct
GST-TYK2DC, the N-terminal FERM and SH2 domain of
TYK2 (amino acid 1–586) were amplified by PCR, using
human TYK2 cDNA (Open Biosystems, Huntsville, AL,
USA, cDNA number 4591726) as template. The resulting
fragment was cloned into the BamHI–EcoRI site of pGEX-
2T. GST-JAK1DN was generated by amplifying human
JAK1 cDNA (a kind gift from I. Behrmann, Life Sciences
Research Unit, University of Luxembourg) from the SH2
domain to the C-terminus (amino acids 421–1150). The
resulting fragment was cloned into the BamHI–EcoRI site of
pGEX-2T. SBP-STAT1DN was generated by amplifying
human STAT1 cDNA (a kind gift from H. Hauser,
Helmholtz Centre for Infection Research, Braunschweig,
Germany), to yield a product corresponding to amino acids
131–750. The resulting fragment was cloned into the
BamHI–EcoRI site of pSBPEX-2T. SBP-STAT2DN was gen-
erated by amplifying human STAT2 cDNA (a kind gift from
H. Hauser, Helmholtz Centre for Infection Research, Braun-
schweig. Germany), resulting in a product corresponding to
amino acids 133–851. The resulting fragment was cloned into
the BamHI–EcoRI site of pSBPEX-2T. To express the
recombinant proteins, the expression plasmids were trans-
formed into competent Escherichia coli BL21(DE3) Codon-
PlusRIL (Stratagene, Agilent, Santa Clara, CA, USA), and
proteins were purified using glutathione–Sepharose beads for
GST-tagged proteins, or streptavidin–Sepharose beads for
SBP-tagged proteins. GST-tagged IRF9 was kindly provided
by Rainer Zawatzky (German Cancer Research Center, Divi-
sion of Viral Transformation Mechanisms, Germany).
For over-expression studies, IRF9 cDNA was cloned into
the lentiviral expression vector pRRLSIN.cPPT.PGK-
GFP.WPRE (deposited in the non-profit plasmid repository
Addgene, number 12252) by PCR amplification of pCMV-
Sport6-IRF9 (Open Biosystems) and digestion with BamHI
and SalI, re placing the gene encoding GFP (green fluoresce nt
protein) and resulting in pRRLSIN.cPPT.PGK-IRF9.WPRE.
To ge nerate pRRLSIN.cPPT.PGK-MCS.WPRE, a multiple
cloning s ite with the restriction sites BmtI, PacI, SmaI, PstI,
IRF9 accelerates IFNa signal transduction T. Maiwald et al.
4750 FEBS Journal 277 (2010) 4741–4754 ª 2010 The Authors Journal compilation ª 2010 FEBS
NdeI and BclI was introduced into the BamHI–SalI locus of
pRRLSIN.cPPT.PGK-GFP.WPRE, replacing the GFP gene.
Lentiviral expression vectors in combination with the pack-
aging plasmids pRSVRev (Addgene plasmid 12253) and
pMDLg ⁄ pRRE (Addgene plasmid 12251) and the envelope
plasmid pMD2.G (Addgene plasmid 12259) were tran-
siently transfected into 293T cells using the calcium phos-
phate method. For this, a mix of plasmid DNA and CaCl
2
(2.5 m) was added to 2· HBS (280 mm NaCl, 50 mm
Hepes, 1.5 mm Na
2
HPO
4
, pH 7.05), forming a precipitate.
The suspension was transferred dropwise to the cells, with
the culture medium with 25 lm chloroquine. Around 16 h
after transfection, the medium was changed to 8 mL
DMEM, 10% fetal bovine serum, 1% penicillin ⁄ streptomycin
in a 10 cm dish, and the virus-containing supernatant was
collected 48 h after transfection and filtered through a
0.45 mm filter. For over-expression experiments, 1 · 10
5
Huh7.5 cells were seeded into six-well plates, and 24 h later
cells were infected with 500 lL of virus supernatant diluted
in 500 lL medium containing 8 lgÆmL
)1
Polybrene
(Sigma-Aldrich). The medium was changed 6 h post-infec-
tion, and cells were subsequently allowed to proliferate.
Flow cytometry
To analyse intracellular IRF9 expression, cells were fixed
with 4% paraformaldehyde in NaCl ⁄ P
i
, washed with
NaCl ⁄ P
i
and 0.3% BSA, and then permeabilized with 0.1%
saponin (Sigma-Aldrich), 0.3% BSA and NaCl ⁄ P
i
. The cells
were incubated with anti-IRF9 IgGs (Santa Cruz, CA,
USA, antibody 10793) as primary antibody and anti-rabbit
Alexa Fluor 680 (Invitrogen) as secondary antibody, and
analysed by flow cytometry using a FACSCalibur (Becton
Dickinson, Franklin Lakes, NJ, USA). As a control, cells
were incubated with the secondary antibody only.
RNA analysis
Huh7.5 wild-type cells or cells over-expressing IRF9 were
starved for 3 h and stimulated using IFNa for 0, 1, 2, 3, 4,
8, 12 or 24 h, or left untreated as a control. Per time point
and cell-type, total RNA of cells in three independent
dishes was isolated using an RNeasy Plus Mini Kit (Qia-
gen, Hilden, Germany). The RNA was used for the quanti-
tative real-time PCR and microarray analysis.
To generate cDNA, 1 lg of total RNA was transcribed
using a QuantiTect reverse transcription kit (Qiagen).
Quantitative PCR was performed using a LightCycler 480
(Roche) in combination with the hydrolysis-based Universal
Probe Library (UPL) platform (Roche). Primer pairs were
generated using the automated UPL Assay Design Center
(Roche). Crossing point values were calculated using the
second-derivative maximum method in the lightcycler
480 Basic Software (Roche). PCR efficiency correction was
performed for each PCR set-up individually based on a
dilution series of template cDNA. Relative concentrations
were normalized using hypoxanthine-guanine phosphoribo-
syltransferase (HPRT) as reference gene.
The microarray analysis was performed using the
Affymetrix (Santa Clara, CA, USA) Human GeneChip 1.0
ST array system according to the manufacturer’s instruc-
tions. Microarrays used in this paper will be uploaded to
the Gene Expression Omnibus ( />geo).
Raw microarray data were processed using the R envi-
ronment together with the Aroma.affymetrix R package
[49]. Normalization was performed using the robust multi-
chip average (RMA) [50] for background adjustment, quan-
tile normalization and summarization. Subsequent gene
annotation was performed using the Human Gene ST 1.0
annotation file (HuGene-1_0-st-v1.na30.hg19.transcript.csv)
from Affymetrix, and the 22 118 transcript cluster IDs that
have an assigned gene were used for further analysis. The
fold expression of each gene was calculated relative to the
untreated controls at 0 h for wild-type Huh7.5 and IRF9-
over-expressing cells, respectively.
The quality of the Human Gene ST 1.0 arrays was
checked based on the normalized unscaled standard error
and relative log expression of all chips [51]. The normalized
unscaled standard error indicates the standard error esti-
mate distributions obtained for each gene on each array
when performing RMA analysis. Normalization ensures
that the median standard error across all arrays is 1 for
each gene. Problematic chips are identified on the basis of
an increased median residuum. The relative log expression
compares the expression level for each chip with the median
expression of all chips in the experiment. From a biological
point of view, the expression of only a small proportion of
genes changes across experimental conditions. Hence, the
chip-wise gene expression distribution should be centered
around the same values with a small inter-quartile range.
Large deviations of relative log expression box plots from
zero and large inter-quartile ranges of the expression distri-
butions indicate problematic chips. Normalized unscaled
standard error and relative log expression analyses (Fig. S7)
show that all microarrays have acceptable error bounds.
Estimation of gene induction times
We estimated the gene induction times by fitting the
mRNA fold expression g(t) to a logistic function:
gðtÞ¼a
1
1 þ expðb À ctÞ
Parameters a, b and c were estimated using a Levenberg–
Marquardt non-linear least-squares algorithm. The start of
gene regulation was defined as the time of maximal change
in acceleration of the fitted function: i.e. the up-regulation
time for each gene was defined as the time of maximal
acceleration of the logistic function g(t), which is calculated
T. Maiwald et al. IRF9 accelerates IFNa signal transduction
FEBS Journal 277 (2010) 4741–4754 ª 2010 The Authors Journal compilation ª 2010 FEBS 4751
from the first maximum of the third derivative of g(t) [33].
The mean difference in gene expression time series was cal-
culated from the mean of the fold expression differences at
the respective experiment time points.
Modelling
The IFNa model was created and graphical outputs of
kinetic behaviours of the model were produced using Cop-
asi [23]. All reactions are defined as ordinary differential
equations. Time course data were computed using the
deterministic LSODA algorithm [52] provided by Copasi.
LSODA solves systems dy ⁄ dt = f with a dense or banded
Jacobian when the problem is stiff, but automatically
selects between non-stiff (Adams) and stiff (BDF) methods.
It uses the non-stiff method initially, and dynamically mon-
itors data in order to decide which method to use. A
detailed overview of the specific reactions defined in the
model is provided in Table S1, and kinetic parameters are
given in Table S2. The SBML version of the model is
provided in Appendix S1, and will be deposited in the Bio-
models Database ( Sensi-
tivity analyses of the model were performed by numerical
differentiation of simulation results on the basis of finite
differences. Obtaining several valid parameter sets was
achieved by using the random search algorithm implemen-
ted in the optimization task of the simulation software
copasi. All model parameters were varied randomly
between ±50% of their original value. For selection, the
resulting kinetic behaviours had to match the experimental
data. Matching was determined on the basis of several
criteria. First, the amount of maxima in the kinetic behav-
iour had to be identical. Second, the initial and final con-
centration, as well as the time and height of the peak for
each simulated species, had to fit into a ±20% threshold of
the measured data. Of 10 000 evaluated parameter sets,
approximately 1000 valid sets were retrieved.
Acknowledgements
We thank Katrin Hu
¨
bner, Marcel Schilling and
Simone Rosenberger (German Cancer Research Cen-
ter, Division of Viral Transformation Mechanisms,
Germany) for fruitful discussions, and Sebastian Bohl,
Thomas Ho
¨
fer (German Cancer Research Center,
Modeling of biological systems, Germany) and Jens
Timmer [University of Freiburg, FRIAS (Freiburg
Institute for advanced studies), Germany] for critically
reading the manuscript. We are grateful to Rainer Za-
watzky, Ralf Bartenschlager (Heidelberg University,
Department of Molecular Virology, Germany), Charles
M. Rice, Iris Behrmann, Hansjo
¨
rg Hauser and Didier
Trono (E
´
cole polytechnique fe
´
de
´
rale de Lausanne
EPFL, Lab of virology and genetics, Switzerland) for
the supplied reagents. We thank Sandra Manthey and
Maria Saile for excellent technical assistance. This
work was funded by the German Ministry of Educa-
tion and Research through the FORSYS centre Viro-
Quant and by the Excellence Initiative of the German
Federal and State Governments.
References
1 Manns MP, McHutchison JG, Gordon SC, Rustgi VK,
Shiffman M, Reindollar R, Goodman ZD, Koury K,
Ling M & Albrecht JK (2001) Peginterferon alfa-2b
plus ribavirin compared with interferon alfa-2b plus
ribavirin for initial treatment of chronic hepatitis C:
a randomised trial. Lancet 358, 958–965.
2 Sarasin-Filipowicz M, Oakeley EJ, Duong FH,
Christen V, Terracciano L, Filipowicz W & Heim MH
(2008) Interferon signaling and treatment outcome in
chronic hepatitis C. Proc Natl Acad Sci USA 105,
7034–7039.
3 Sasagawa S, Ozaki Y, Fujita K & Kuroda S (2005) Pre-
diction and validation of the distinct dynamics of tran-
sient and sustained ERK activation. Nat Cell Biol 7,
365–373.
4 Schoeberl B, Pace EA, Fitzgerald JB, Harms BD, Xu L,
Nie L, Linggi B, Kalra A, Paragas V, Bukhalid R et al.
(2009) Therapeutically targeting ErbB3: a key node in
ligand-induced activation of the ErbB receptor–PI3K
axis. Sci Signal 2, ra31.
5 Heinrich R, Neel BG & Rapoport TA (2002) Mathe-
matical models of protein kinase signal transduction.
Mol Cell 9, 957–970.
6 Platanias LC (2005) Mechanisms of type-I- and type-II-
interferon-mediated signalling. Nat Rev Immunol 5,
375–386.
7 Bluyssen AR, Durbin JE & Levy DE (1996) ISGF3c
p48, a specificity switch for interferon activated tran-
scription factors. Cytokine Growth Factor Rev 7,
11–17.
8 Bandyopadhyay SK, Kalvakolanu DV & Sen GC
(1990) Gene induction by interferons: functional
complementation between trans-acting factors induced
by alpha interferon and gamma interferon. Mol Cell
Biol 10, 5055–5063.
9 Levy DE, Lew DJ, Decker T, Kessler DS & Darnell JE Jr
(1990) Synergistic interaction between interferon-a and
interferon-c through induced synthesis of one subunit of
the transcription factor ISGF3. EMBO J 9, 1105–1111.
10 Tamada Y, Nakao K, Nagayama Y, Nakata K,
Ichikawa T, Kawamata Y, Ishikawa H, Hamasaki K,
Eguchi K & Ishii N (2002) p48 Overexpression
enhances interferon-mediated expression and activity
of double-stranded RNA-dependent protein kinase in
human hepatoma cells. J Hepatol 37, 493–499.
IRF9 accelerates IFNa signal transduction T. Maiwald et al.
4752 FEBS Journal 277 (2010) 4741–4754 ª 2010 The Authors Journal compilation ª 2010 FEBS
11 Weihua X, Hu J, Roy SK, Mannino SB &
Kalvakolanu DV (2000) Interleukin-6 modulates
interferon-regulated gene expression by inducing the
ISGF3c gene using CCAAT ⁄ enhancer binding
protein-beta (C ⁄ EBP-b). Biochim Biophys Acta 1492 ,
163–171.
12 Leonard GT & Sen GC (1997) Restoration of interferon
responses of adenovirus E1A-expressing HT1080 cell
lines by overexpression of p48 protein. J Virol 71,
5095–5101.
13 Lewis JA, Huq A & Shan B (1989) Beta and gamma
interferons act synergistically to produce an antiviral
state in cells resistant to both interferons individually.
J Virol 63, 4569–4578.
14 Smieja J, Jamaluddin M, Brasier AR & Kimmel M
(2008) Model-based analysis of interferon-b induced
signaling pathway. Bioinformatics 24, 2363–2369.
15 Yamada S, Shiono S, Joo A & Yoshimura A (2003)
Control mechanism of JAK ⁄ STAT signal transduction
pathway. FEBS Lett 534, 190–196.
16 Zi Z, Cho KH, Sung MH, Xia X, Zheng J & Sun Z
(2005) In silico identification of the key components and
steps in IFN-c induced JAK-STAT signaling pathway.
FEBS Lett 579, 1101–1108.
17 Martinez-Moczygemba M, Gutch MJ, French DL &
Reich NC (1997) Distinct STAT structure promotes
interaction of STAT2 with the p48 subunit of the
interferon-a-stimulated transcription factor ISGF3.
J Biol Chem 272, 20070–20076.
18 Banninger G & Reich NC (2004) STAT2 nuclear
trafficking. J Biol Chem 279, 39199–39206.
19 Lau JF, Parisien JP & Horvath CM (2000) Interferon
regulatory factor subcellular localization is determined
by a bipartite nuclear localization signal in the DNA-
binding domain and interaction with cytoplasmic reten-
tion factors. Proc Natl Acad Sci USA 97, 7278–7283.
20 Wesoly J, Szweykowska-Kulinska Z & Bluyssen HA
(2007) STAT activation and differential complex forma-
tion dictate selectivity of interferon responses. Acta
Biochim Pol 54, 27–38.
21 Vinkemeier U (2004) Getting the message across,
STAT! Design principles of a molecular signaling
circuit. J Cell Biol 167, 197–201.
22 Hornberg JJ, Binder B, Bruggeman FJ, Schoeberl B,
Heinrich R & Westerhoff HV (2005) Control of MAPK
signalling: from complexity to what really matters.
Oncogene 24, 5533–5542.
23 Hoops S, Sahle S, Gauges R, Lee C, Pahle J, Simus N,
Singhal M, Xu L, Mendes P & Kummer U (2006) COP-
ASI – a COmplex PAthway SImulator. Bioinformatics
22, 3067–3074.
24 Meyer T, Marg A, Lemke P, Wiesner B & Vinkemeier U
(2003) DNA binding controls inactivation and nuclear
accumulation of the transcription factor Stat1. Genes Dev
17, 1992–2005.
25 Reich NC (2007) STAT dynamics. Cytokine Growth
Factor Rev 18, 511–518.
26 Balachandran S, Roberts PC, Brown LE, Truong H,
Pattnaik AK, Archer DR & Barber GN (2000) Essential
role for the dsRNA-dependent protein kinase PKR in
innate immunity to viral infection.
Immunity 13, 129–141.
27 Terenzi F, Saikia P & Sen GC (2008) Interferon-induc-
ible protein, P56, inhibits HPV DNA replication by
binding to the viral protein E1. EMBO J 27, 3311–
3321.
28 Alexander WS (2002) Suppressors of cytokine signalling
(SOCS) in the immune system. Nat Rev Immunol 2,
410–416.
29 Malakhov MP, Malakhova OA, Kim KI, Ritchie KJ &
Zhang DE (2002) UBP43 (USP18) specifically removes
ISG15 from conjugated proteins. J Biol Chem 277,
9976–9981.
30 Malakhova OA, Kim KI, Luo JK, Zou W, Kumar KG,
Fuchs SY, Shuai K & Zhang DE (2006) UBP43 is a
novel regulator of interferon signaling independent of
its ISG15 isopeptidase activity. EMBO J 25, 2358–2367.
31 Huang da W, Sherman BT & Lempicki RA (2009) Sys-
tematic and integrative analysis of large gene lists using
DAVID bioinformatics resources. Nat Protoc 4, 44–57.
32 Gutenkunst RN, Waterfall JJ, Casey FP, Brown KS,
Myers CR & Sethna JP (2007) Universally sloppy
parameter sensitivities in systems biology models. PLoS
Comput Biol 3, 1871–1878.
33 Zaslavsky E, Hershberg U, Seto J, Pham AM, Marquez S,
Duke JL, Wetmur JG, Tenoever BR, Sealfon SC &
Kleinstein SH (2010) Antiviral response dictated by cho-
reographed cascade of transcription factors. J Immunol
184, 2908–2917.
34 Sarasin-Filipowicz M, Wang X, Yan M, Duong FH,
Poli V, Hilton DJ, Zhang DE & Heim MH (2009)
Alpha interferon induces long-lasting refractoriness of
JAK-STAT signaling in the mouse liver through induc-
tion of USP18 ⁄ UBP43. Mol Cell Biol 29, 4841–4851.
35 Li H, Gade P, Xiao W & Kalvakolanu DV (2007) The
interferon signaling network and transcription factor
C ⁄ EBP-b. Cell Mol Immunol 4, 407–418.
36 Honda K, Takaoka A & Taniguchi T (2006) Type I
interferon [corrected] gene induction by the interferon
regulatory factor family of transcription factors. Immu-
nity 25, 349–360.
37 Chawla-Sarkar M, Lindner DJ, Liu YF, Williams BR,
Sen GC, Silverman RH & Borden EC (2003) Apoptosis
and interferons: role of interferon-stimulated genes as
mediators of apoptosis. Apoptosis 8, 237–249.
38 Apostolou E & Thanos D (2008) Virus infection
induces NF-jB-dependent interchromosomal associa-
tions mediating monoallelic IFN-b gene expression. Cell
134, 85–96.
39 Antonsson A, Payne E, Hengst K & McMillan NA
(2006) The human papillomavirus type 16 E7 protein
T. Maiwald et al. IRF9 accelerates IFNa signal transduction
FEBS Journal 277 (2010) 4741–4754 ª 2010 The Authors Journal compilation ª 2010 FEBS 4753
binds human interferon regulatory factor-9 via a novel
PEST domain required for transformation. J Interferon
Cytokine Res 26, 455–461.
40 Koromilas AE, Li S & Matlashewski G (2001)
Control of interferon signaling in human papilloma-
virus infection. Cytokine Growth Factor Rev 12,
157–170.
41 Zurney J, Kobayashi T, Holm GH, Dermody TS &
Sherry B (2009) Reovirus mu2 protein inhibits inter-
feron signaling through a novel mechanism involving
nuclear accumulation of interferon regulatory factor 9.
J Virol 83, 2178–2187.
42 Nakao K, Nakata K, Yamashita M, Tamada Y,
Hamasaki K, Ishikawa H, Kato Y, Eguchi K & Ishii N
(1999) p48 (ISGF-3c) is involved in interferon-a-
induced suppression of hepatitis B virus enhancer-1
activity. J Biol Chem 274, 28075–28078.
43 Miller DM, Zhang Y, Rahill BM, Waldman WJ &
Sedmak DD (1999) Human cytomegalovirus inhibits
IFN-a-stimulated antiviral and immunoregulatory
responses by blocking multiple levels of IFN-a signal
transduction. J Immunol 162, 6107–6113.
44 Tsuno T, Mejido J, Zhao T, Schmeisser H, Morrow A
& Zoon KC (2009) IRF9 is a key factor for eliciting the
antiproliferative activity of IFN-a. J Immunother 32,
803–816.
45 Weiss TS, Pahernik S, Scheruebl I, Jauch KW &
Thasler WE (2003) Cellular damage to human hepato-
cytes through repeated application of 5-aminolevulinic
acid. J Hepatol 38 , 476–482.
46 Thasler WE, Weiss TS, Schillhorn K, Stoll PT,
Irrgang B & Jauch KW (2003) Charitable state-con-
trolled foundation Human Tissue and Cell Research:
ethic and legal aspects in the supply of surgically
removed human tissue for research in the academic
and commercial sector in Germany. Cell Tissue Bank
4, 49–56.
47 Schilling M, Maiwald T, Bohl S, Kollmann M, Kreutz C,
Timmer J & Klingmuller U (2005) Quantitative data
generation for systems biology: the impact of
randomisation, calibrators and normalisers. Syst Biol
152, 193–200.
48 Schilling M, Maiwald T, Bohl S, Kollmann M, Kreutz C,
Timmer J & Klingmuller U (2005) Computational
processing and error reduction strategies for standardized
quantitative data in biological networks. FEBS J 272,
6400–6411.
49 Bengtsson H, Simpson K, Bullard J & Hansen K (2008)
aroma.affymetrix: A Generic Framework in R for Ana-
lyzing Small to Very Large Affymetrix Data Sets in
Bounded Memory. Department of Statistics, University
of California, Berkeley, CA.
50 Irizarry RA, Bolstad BM, Collin F, Cope LM, Hobbs B
& Speed TP (2003) Summaries of Affymetrix GeneChip
probe level data. Nucleic Acids Res 31, e15.
51 Heber S & Sick B (2006) Quality assessment of Affyme-
trix GeneChip data. OMICS 10, 358–368.
52 Petzold L (1983) Automatic selection of methods for
solving stiff and nonstiff systems of ordinary differential
equations. SIAM J Sci Stat Comput 4, 136–148.
53 Kitano H, Funahashi A, Matsuoka Y & Oda K (2005)
Using process diagrams for the graphical representation
of biological networks. Nat Biotechnol 23, 961–966.
Supporting information
The following supplementary material is available:
Fig. S1. Determination of the technical error inherent
in the immunoblotting technique.
Fig. S2. Protein quantification of key pathway compo-
nents.
Fig. S3. Additional data describing the dynamics of
IFNa signalling in Huh7.5 cells and primary human
hepatocytes.
Fig. S4. In silico analysis of changes in feedback con-
trol and their effects on kinetic behaviours of various
components.
Fig. S5. Characterization of IRF9-over-expressing
Huh7.5 cells.
Fig. S6. Additional time course data for IRF9-over-
expressing Huh7.5 cells.
Fig. S7. Microarray quality assessment using normal-
ized unscaled standard error and relative log expres-
sion plots.
Table S1. Equation overview of the kinetic model
describing the IFNa signalling pathway.
Table S2. Overview of kinetic parameters of the pre-
sented model and the sources used as reference values.
Table S3. Initial concentrations of model species.
Table S4. Gene ontology analysis of the 284 genes with
an increased relative expression upon IFNa stimula-
tion in both wild-type and IRF9-over-expressing cells.
Appendix S1. Model description.
This supplementary material can be found in the
online version of this article.
Please note: As a service to our authors and readers,
this journal provides supporting information supplied
by the authors. Such materials are peer-reviewed and
may be re-organized for online delivery, but are not
copy-edited or typeset. Technical support issues arising
from supporting information (other than missing files)
should be addressed to the authors.
IRF9 accelerates IFNa signal transduction T. Maiwald et al.
4754 FEBS Journal 277 (2010) 4741–4754 ª 2010 The Authors Journal compilation ª 2010 FEBS