Báo cáo khoa học: Structural flexibility in Trypanosoma brucei enolase revealed by X-ray crystallography and molecular dynamics pdf
Bạn đang xem bản rút gọn của tài liệu. Xem và tải ngay bản đầy đủ của tài liệu tại đây (444.95 KB, 13 trang )
Structural flexibility in Trypanosoma brucei enolase
revealed by X-ray crystallography and molecular dynamics
Marcos V. de A. S. Navarro
1,
*
,‡
, Sandra M. Gomes Dias
1,
*
,§
, Luciane V. Mello
2,3,
*,
Maria T. da Silva Giotto
1,†
, Sabine Gavalda
4,
–, Casimir Blonski
4
, Richard C. Garratt
1
and Daniel J. Rigden
2
1 Instituto de Fı
´
sica de Sa˜o Carlos, Universidade de Sa˜o Paulo, Sa˜o Carlos SP, Brazil
2 School of Biological Sciences, University of Liverpool, UK
3 Northwest Institute for Bio-Health Informatics, University of Liverpool, UK
4 Groupe de Chimie Organique Biologique, Universite
´
Paul Sabatier, Toulouse, France
Enolase (2-phospho-d-glycerate hydrolase, EC 4.2.1.11)
catalyses the reversible dehydration of d-2-phospho-
glycerate to phosphoenolpyruvate (PEP) and partici-
pates in both glycolysis and gluconeogenesis. In
common with most glycolytic enzymes, enolases from a
wide variety of organisms, including Archaea, Bacteria
Keywords
crystal structure; drug design; enolase;
molecular dynamics; structural flexibility
Correspondence
D. J. Rigden, School of Biological Sciences,
Crown Street, University of Liverpool,
Liverpool L69 7ZB, UK
Fax: +44 151 7954406
Tel: +44 151 7954467
E-mail:
Website: />*These authors contributed equally to this
work
†Deceased
Present address
‡Laborato
´
rio Nacional de Luz Sı
´
ncrotron,
Campinas, SP, Brazil
§Department of Molecular Medicine,
College of Veterinary Medicine, Cornell
University, Ithaca, NY, USA
–Department of Molecular Mechanisms of
Mycobacterial Infections, Institut de Phar-
macologie et de Biologie Structurale, CNRS,
UPS (UMR5089), Toulouse, France
(Received 5 June 2007, revised 25 July
2007, accepted 3 August 2007)
doi:10.1111/j.1742-4658.2007.06027.x
Enolase is a validated drug target in Trypanosoma brucei. To better charac-
terize its properties and guide drug design efforts, we have determined six
new crystal structures of the enzyme, in various ligation states and confor-
mations, and have carried out complementary molecular dynamics simula-
tions. The results show a striking structural diversity of loops near the
catalytic site, for which variation can be interpreted as distinct modes of
conformational variability that are explored during the molecular dynamics
simulations. Our results show that sulfate may, unexpectedly, induce full
closure of catalytic site loops whereas, conversely, binding of inhibitor
phosphonoacetohydroxamate may leave open a tunnel from the catalytic
site to protein surface offering possibilities for drug development. We also
present the first complex of enolase with a novel inhibitor 2-fluoro-2-phos-
phonoacetohydroxamate. The molecular dynamics results further encour-
age efforts to design irreversible species-specific inhibitors: they reveal that
a parasite enzyme-specific lysine may approach the catalytic site more
closely than crystal structures suggest and also cast light on the issue of
accessibility of parasite enzyme-specific cysteines to chemically modifying
reagents. One of the new sulfate structures contains a novel metal-binding
site IV within the catalytic site cleft.
Abbreviations
EV, eigenvector; FPAH, 2-fluoro-2-phosphonoacetohydroxamate; PAH, phosphonoacetohydroxamate; PDB, protein databank; PEP,
phosphoenolpyruvate.
FEBS Journal 274 (2007) 5077–5089 ª 2007 The Authors Journal compilation ª 2007 FEBS 5077
and Eukarya, are highly conserved [1]. The catalytic site
is particularly well conserved, leading to broadly similar
kinetic parameters for enzymes of different origins [2,3].
The quaternary structure of enolase is typically a
homodimer, although some bacteria apparently contain
octameric enzymes [4,5].
Each subunit of enolase contains an eightfold b ⁄ a
barrel domain preceded by an N-terminal a + b
domain [6]. The catalytic site is contained completely
within a single subunit and lies at the interface of the
two domains: monomeric enolase is catalytically active
[7]. Catalysis results from acid–base chemistry involving
a Lys-Glu dyad [8,9]. Also essential is the binding of
two divalent metal ions to distinct sites: the first ‘con-
formational’ site being required for substrate binding
and the second ‘catalytic’ site, occupied after substrate
has bound, stabilizing the reaction intermediate [6].
This ordered binding is accompanied by dramatic rear-
rangements of three protein loops lying near the cata-
lytic site. Note that, although the conventional loop
nomenclature is maintained here, regular secondary
structure is sometimes present in these regions. Briefly,
when the catalytic site is occupied by sulfate, phosphate
or phosphoglycolate, all three loops typically adopt an
open conformation, as seen, for example, in our previ-
ous Trypanosoma brucei enolase structure [10]. When
occupied by substrate, or the phosphonoacetohydroxa-
mate (PAH) inhibitor, and two metal ions, the loops
are generally all in a closed conformation, as in some
yeast structures [11]. Intermediate semiclosed confor-
mations have been observed when one metal ion is
absent or in some complexes with PEP [12,13].
As well as its key roles in glycolysis and gluconeo-
genesis, enolase, in common with other glycolytic
enzymes [14], has a remarkable number of ‘moonlight-
ing’ roles in diverse organisms that are unrelated to its
catalytic activity [15]. These include roles in the RNA
degradosome in Escherichia coli [16], as a structure
lens protein (s-crystallin) in the eye [17], as a transcrip-
tion factor in both animals [18] and plants [19] and, on
cell surfaces, as a receptor for plasminogen [15]. In this
last role, the expression of enolase on the surface of
streptococci is particularly interesting, where its inter-
action with host plasminogen is presumed to facilitate
entry of the parasite into host tissues [20]. Very
recently, the enolase of the trypanosomatid parasite
Leishmania mexicana has also been detected on the cell
surface [21]. A role for enolase as plasminogen recep-
tor in this organism is highly plausible because inter-
action between parasite and plasminogen has been
demonstrated [22].
Our interest in T. brucei enolase [2,10] stems from
the promise of the glycolytic pathway as a target for
drugs against parasitic protozoa [23]. With few excep-
tions, homologues of the enzymes involved are present
in the human host, and a premium is placed on seek-
ing and exploiting structural differences between para-
site and host proteins. Irreversible inhibition is
particularly desirable because it would be impervious
to high substrate levels that could displace competitive
inhibitors [23]. Using parasite enzyme-specific residues
(e.g. lysines in both cases), selective inhibitors against
aldolase [24] and phosphofructokinase [25] have been
developed. Despite bearing chemically reactive groups,
by combining high affinity and low reactivity, opti-
mized inhibitors of this kind should have minimal
effects on other proteins in vivo. Indeed, a prodrug
version of an aldolase inhibitor kills parasite cells
without detectable cytotoxicity against human MRC-5
cells [26].
Like other glycolytic enzymes, T. brucei enolase has
been validated as a drug target: RNA interference of
enolase in the bloodstream form of the parasite leads
to an effect on its growth within 24 h and death com-
mences at approximately 48 h [27]. Encouragingly, the
same study also demonstrated that a reduction in eno-
lase activity to approximately 15–20% of its original
level was sufficient for cell death to occur. This sug-
gests that incomplete inhibition of this enzyme in vivo
might prove sufficient for effective treatment. The pres-
ence of homologous enolase isoenzymes in the human
host raises the complication of selectivity. In this
respect, enolase is not the best target because the para-
site and host enzymes share 58% sequence identity.
Nevertheless, modelling showed that there are three
particularly interesting T. brucei enzyme residues, two
cysteines (numbered 147 and 241) and lysine 155, near
to the catalytic site, which are not conserved in the
human enzymes [2] (Fig. S3). The chemical characteris-
tics of the side chains of these residues offer the poten-
tial for species-selective permanent target inactivation
by appropriately designed covalent inhibitors. The
T. brucei crystal structure suggested that the cysteines
were almost entirely solvent inaccessible, yet, most sur-
prisingly, at least Cys147 could be chemically modified
by iodoacetamide with consequent enzyme inhibition
[10]. In that crystal structure, Lys155 is pointed away
from the catalytic site, being unfavourably positioned
to make additional interactions with a catalytic site-
bound inhibitor.
In the present study, we present six new enolase
structures that enhance our understanding of the struc-
tural and dynamic properties of the T. brucei enolase
catalytic site, which is essential for further drug design.
The new structures demonstrate that the enzyme can
adopt three distinct catalytic site structures in the
Structural flexibility in T. brucei enolase M. V. A. S. Navarro et al.
5078 FEBS Journal 274 (2007) 5077–5089 ª 2007 The Authors Journal compilation ª 2007 FEBS
sulfate-bound form, including one containing a novel
metal binding site. Furthermore, they show structural
heterogeneity in their inhibitor-bound forms, highlight-
ing the potential to extend future inhibitors out of
the ligand-binding pocket. We also present extensive
molecular dynamics simulations aiming to address how
the apparently buried cysteine residues achieve solvent
accessibility and show that Lys155 may indeed offer a
useful alternative possibility for covalent inhibition.
Results and Discussion
Overview of the new structures
Characteristics and statistics of data collection and
refinement for the six new structures are presented in
Table 1. The crystal form is the same in each case,
namely the C222
1
form previously reported [10],
although the precipitant used was PEG 1000 rather
than the PEG monomethylether 550. In the subsequent
analyses, we compare these structures with the previ-
ously published sulfate-bound structure, refined to
2.35 A
˚
, and containing Zn
2+
ions bound to sites I and
III [10], which we refer to here as sulfate_1. The new
structures, all obtained by co-crystallization, are all of
significantly better resolution than sulfate_1, in partic-
ular a complex with PAH inhibitor that diffracted well
to 1.65 A
˚
. In common with previous structures, from
T. brucei and other organisms, a single Arg residue,
numbered 400 in T. brucei, lies in the disallowed region
of the Ramachandran plot [10]. Among the three
important catalytic site loops previously described (and
discussed further below), there is only one that makes
a crystal contact. This involves Glu272 of loop 3, its
last residue and the most distant from the catalytic
site. Thus, we can be confident that the conformations
observed represent readily achieved structures of the
native enzyme, rather than crystal packing artefacts. In
our initial sulfate_1 structure, density did not allow for
chain tracing of two stretches, from Thr41-Gly42 and
Thr260-Pro266, regions that are frequently poorly
ordered in other enolase structures. With the exception
of sulfate_2, all the structures presented here could be
unambiguously fully traced. In sulfate_2, density did
not allow for the tracing of the polypeptide chain
between Asp251 and Gln273 inclusive. As with sul-
fate_1, one or two artefactual residues preceding the
N-terminal Met of the natural sequence could be
traced in each new structure, and these result from
thrombin cleavage of the His-tag used in purification
(see Experimental procedures). In the three inhibitor-
bound structures, artefactual Zn
2+
ions bound, with
partial occupancy (0.5–0.7), at the crystal packing
interface to residues ‘His0’ and Glu27, and to His283
from a crystal symmetry-related chain.
The new structures are diverse in the contents of their
catalytic sites, both in terms of substrate ⁄ inhibitor and
in terms of bound metal (Table 1). The two new sulfate
complexes and the previous sulfate-bound structure
were all achieved at highly similar crystallization condi-
tions (Table 1). As such, there is no clear explanation
why they should differ in conformation (see below) and
we view their structural diversity as being the result of
‘freezing out’ of similarly accessible catalytic site
conformations. Substrate (PEP) and inhibitor (phos-
phonoacetohydroxamate, PAH) [28] bind with their
phospho and phosphono groups, respectively, occupy-
ing the same position as that occupied by sulfate in the
earlier sulfate_1 structure [10]. Schematic diagrams of
the interactions of inhibitors and metal ions with eno-
lase are given in Fig. S4. The binding mode of PEP
seen is essentially the same fully closed conformation as
that seen for yeast enolase [protein databank (PDB)
code 1one][29]. One PAH structure is also fully closed,
as in an earlier yeast complex (PDB code 1ebg) [11],
whereas the second, as discussed below, represents a
novel conformation for bound PAH. Electron density
maps for each complex are given in Fig. S5.
The novel compound 2-fluoro-2-phosphonoaceto-
hydroxamate (FPAH), a derivative with a pK
a
value
more resembling that of the phosphate of substrate
PEP, was also synthesized and its complex determined.
It is a competitive inhibitor of enolase which, despite
its lower pK
a
value compared to PAH, binds more
poorly with a K
i
at pH 7.2 of 1.4 lm compared to
approximately 15 nm for PAH (see supplementary
Doc. S1 and Figs S1 and S2) [30]. It binds in the same
way as PEP and PAH with an electron density suggest-
ing that both isomers of the R,S racemic mixture bind
equally well (Fig. S5). Despite the uniformity of ligand
binding, protein structure varies considerably at the
active site in the new set of structures. Rather than try
to explain their differences in the typical qualitative
way (i.e. open, closed, semiopen, loose, etc.), we
attempt a more quantitative description.
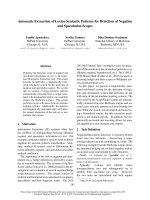
As shown in Figs 1 and 2, the principal conforma-
tional differences between the structures lie in three
catalytic site loops, 1–3, corresponding to those high-
lighted in many other studies. However, unlike the
results obtained in a similar analysis for Saccharo-
myces cerevisiae crystal structures (data not shown), a
fourth peak for the region from residues 215–220 is
present. This loop is a neighbour of loop 2 and moves
in a coordinated way in T. brucei but not in yeast
structures. Because loop 4 is distant from the catalytic
site, it is not discussed further.
M. V. A. S. Navarro et al. Structural flexibility in T. brucei enolase
FEBS Journal 274 (2007) 5077–5089 ª 2007 The Authors Journal compilation ª 2007 FEBS 5079
Table 1. Crystallisation conditions, metal content, data collection statistics and refinement statistics for structures of T. brucei enolase.
Name of structure
Sulfate_1
a
Sulfate_2 Sulfate_3 PEP PAH_1 PAH_2 FPAH
Crystallization conditions 0.1
M Mes pH 6.5, 0.1 M Mes pH 6.5, 0.1 M Mes pH 6.5, 0.1 M Mes pH 6.5, 0.1 M Mes pH 6.5, 0.1 M Mes pH 5.0, 0.1 M Mes pH 5.0,
10 m
M ZnSO
4
,10mM ZnSO
4
,10mM ZnSO
4
,10mM ZnSO
4
,10mM ZnSO
4
,10mM ZnCl
2
,10mM ZnCl
2
,
25% PEGMME550 10% PEG1000 10% PEG1000 10% PEG1000 10% PEG1000 10% PEG1000 10% PEG1000
Metal content
Metal ion sites occupied at catalytic site 1, 3 1, 4 1, 2 1, 2 1, 2 1, 2 1, 2
Occupancy of catalytic site metals 1.0, 0.7 1.0, 1.0 0.9, 0.8 1.0, 1.0 1.0, 1.0 1.0, 1.0 1.0, 1.0
Data collection
Space group C222
1
C222
1
C222
1
C222
1
C222
1
C222
1
C222
1
Unit cell dimensions 74.02 73.62 74.77 73.99 73.86 74.95 74.81
a (A
˚
)
b (A
˚
) 110.54 111.26 111.17 110.72 109.28 110.76 110.64
c (A
˚
) 109.1 109.97 108.98 109.3 107.95 109.22 109.01
Low resolution diffraction limit (A
˚
) 38.8 26.0 26.1 25.0 28.0 17.8 21.0
High resolution diffraction limit (A
˚
) 2.3 1.90 1.90 2.00 1.65 1.90 1.80
Lower resolution limit of highest
resolution bin
2.38 2.02 2.02 2.11 1.74 2.02 1.99
Completeness (%) 97.2 (93.4)
b
99.0 (96.7) 99.4 (100.0) 99.8 (100.0) 95.5 (91.4) 98.8 (96.1) 99.9 (100)
I ⁄ r(I ) 14.2 (1.9) 17.0 (3.9) 15.2 (2.2) 12.9 (1.9) 26.4 (3.9) 16.1 (3.1) 23.3 (4.3)
Multiplicity 4.7 (4.5) 3.2 (3.2) 4.9 (4.8) 2.9 (2.8) 8.3 (8.3) 4.6 (4.6) 7.6 (7.7)
R
merge
(%) 6.52 (46.8) 5.8 (54.2) 5.7 (49.7) 6.4 (54.5) 5.5 (40.9) 7.0 (40.3) 5.6 (43.5)
Refinement
Number of water molecules 240 308 382 179 421 257 356
Number of reflections 17334 (1942) 33900 (4812) 33961 (4764) 28944 (4161) 47566 (6562) 33851 (4700) 40063 (5784)
R (%) 21.0 (28.5) 21.4 (27.1) 16.4 (25.3) 17.3 (24.7) 16.5 (32.4) 16.5 (20.7) 16.2 (22.2)
R
free
(%) 25.1 (33.7) 25.0 (30.0) 20.6 (33.7) 22.4 (37.1) 20.3 (39.7) 20.5 (30.1) 20.6 (31.3)
Mean temperature factor B (A
˚
2
) 43.7 28.0 21.2 37.2 29.6 24.3 27.9
All atoms
Protein 42.7 28.1 20.1 37.3 28.5 23.9 27.2
Ligand 71.3 33.1 16.1 30.2 22.7 28.9 21.0
Zinc 56.2 39.0 21.6 33.9 27.9 29.2 25.5
Solvent 42.7 26.9 29.9 36.1 38.5 29.9 35.5
rmsd from ideal values 0.007 0.019 0.015 0.018 0.017 0.016 0.018
Bond lengths (A
˚
)
Bond angles (°) 1.4 1.672 1.505 1.680 1.668 1.487 1.611
Ramachandran (%)
c
Most favoured regions 86.4 89.8 89.4 91.1 90.0 90.0 90.5
Additional allowed regions 13.4 9.0 10.3 8.4 9.5 9.8 8.9
Generously allowed regions 0 0.9 0 0.3 0.3 0 0.3
Disallowed regions 0.3 0.3 0.3 0.3 0.3 0.3 0.3
a
See [10]; PDB code 1oep.
b
Values within parentheses are for the highest resolution bin.
c
Calculated with PROCHECK [50].
Structural flexibility in T. brucei enolase M. V. A. S. Navarro et al.
5080 FEBS Journal 274 (2007) 5077–5089 ª 2007 The Authors Journal compilation ª 2007 FEBS
Borrowing a technique more commonly associated
with molecular dynamics studies, we analysed the con-
formational differences in the new set of structures
using essential dynamics [31]. This also allowed us to
visualize to what extent the resulting modes of confor-
mational variability were explored during molecular
dynamics simulations (see later). The positions of the
six new structures projected onto eigenvectors (EVs) 1
and 2 are shown in Fig. 3A. Visual inspection of the
maximum and minimum projections of EV1 shows
A
B
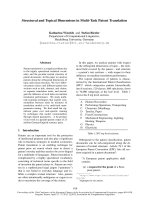
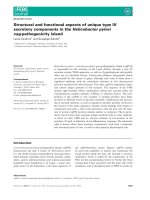
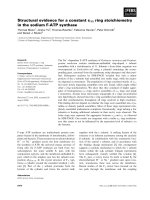
Fig. 3. (A) Projections of the six new crystal structures and molec-
ular dynamics trajectories on to EVs 1 and 2 resulting from the
essential dynamics analysis. Blue circles are used for sulfate struc-
tures [open for sulfate_1* (see Experimental procedures), filled for
sulfate_3], green triangles for PAH complexes (open for PAH_1,
filled for PAH_2), a magenta square for the PEP structure and an
orange diamond for the FPAH complex. Black dots mark the
PEP + 2 Mg trajectory and red dots the single Mg trajectory start-
ing from the same PEP complex protein conformation. Dots are
shown at 2 ps intervals along the trajectory. (B) Path of the single
Mg trajectory, indicated at 20 ps intervals, showing a structural
switch at approximately 5 ns from a closed (low values for EVs 1
and 2) to an open structure (high EVs). The trajectory start is
marked with a circle whereas the end is indicated by a square.
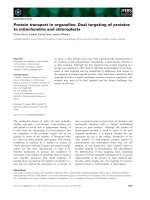
Fig. 2. Comparison of sulfate_1, sulfate_2, PEP and PAH_1 struc-
tures, coloured, respectively, in shades of green, blue, magenta
and orange. The FPAH ligand position closely resembles that of
PAH_1. A complete cartoon representation of sulfate_2 is shown.
Backbone structure is shown for the other three structures only for
loops 1–4, which are labelled. Note the gaps in loops 1 and 3 of
the sulfate_1 structure and the loop 3 gap in the sulfate_2 struc-
ture. Side chains of Lys155 and His156 are shown as sticks, as are
the structures’ respective ligands showing the overlay of bound sul-
fate with phospho and phosphono groups. Zinc atoms are shown
as spheres occupying the labelled sites I–IV. Black dashes mark
the hydrogen bonding interactions of His156 with PEP or with met-
als in sites III or IV in the sulfate_1 and sulfate_2 structures,
respectively.
Fig. 1. Multi-rms plot of the enolase structures in Table 1 produced
with
LSQMAN[56]. The multi-rms value is defined as the rms value of
the distances between all unique pairs of Ca atoms for a given resi-
due. Loops 1–4 (see text) are labelled. Note that the value for a
section of loop 3 is artificially low in a stretch, coloured grey, for
which density did not allow tracing of the chain in either of the
open forms, sulfate_1 or sulfate_2.
M. V. A. S. Navarro et al. Structural flexibility in T. brucei enolase
FEBS Journal 274 (2007) 5077–5089 ª 2007 The Authors Journal compilation ª 2007 FEBS 5081
that it captures the coordinated closure of loops 1–4
over the catalytic site. The structure sulfate_2 (high
value of EV1 projection) has the loops in a fully open
conformation whereas, in the other structures, they
close over the active site. EV2 splits this group of five
to two sets, with positive projection values signifying
structures in which His156 remains outside the cata-
lytic site, whereas negative values mean that His156
enters the site so that the enzyme achieves a catalyti-
cally competent conformation. A comparison of sul-
fate_1, sulfate_2, PEP and PAH_1 structures is shown
in Fig. 2.
Unexpected variability in inhibitor complex
structures
Comparison of the substrate and inhibitor complexes
shows that the His156-out and His156-in structures are
equally represented, the former by PAH_1 and FPAH
and the latter by PEP and PAH_2. This appears to be
the first time that an enolase-PAH complex has crys-
tallised in a nonfully closed conformation. The PAH_1
and PAH_2 structures were crystallised at different pH
values. We therefore considered whether varying
charge on the phosphono groups of the substrate, with
which His156 interacts on entering the catalytic site,
could be responsible. However, the negative charge on
the PAH phosphono group would be greater at
pH 6.5, at which the His-out structure was obtained,
compared to crystallization at pH 5.0 of the His-in
PAH structure. Furthermore, a greater negative charge
would be expected on the phosphono group of FPAH
than of PAH due to the lower pK
a
value of the fluoro
derivative, yet the FPAH structure was also His-out.
The pK
a
of His165 is not known experimentally,
although an observed value of 5.9 has been ascribed
to it in the yeast enzyme [32]. If this is true, then its
ionization state will also differ at pH values of 5.0 and
6.5. A greater attraction for bound PAH of the more
positively charged His165 is consistent with the His-in
structure observed at pH 5.0 (PAH_2) and the His-out
PAH_1 structure observed at pH 6.5. However, con-
sideration of the ionization state of His165 does not
explain why the FPAH structure at pH 5.0 should be
His-out. There is no obvious explanation for this
structural difference, leading to the conclusion that the
His-in and His-out conformations may be similarly
energetically favourable and perhaps only chance leads
to the freezing of one or the other in a given crystal.
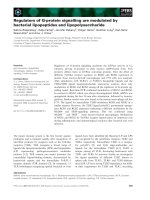
The previously unsuspected existence of His-out
inhibitor-bound conformations has important implica-
tions for further ligand design. In the fully closed,
His-in conformation, the ligand is fully enclosed in a
substrate-sized cavity with little potential for the design
of a larger inhibitor of better affinity or selectivity. By
contrast, as shown in Fig. 4, the outward pointing
His156 conformation leaves a tunnel open leading
from the protein surface down to the bound ligand.
This allows ‘growing room’ for a catalytic site-bound
inhibitor, enabling access to a larger number of target
residues and hence increasing the chance of achieving
selectivity for the parasite enzyme over the human
counterpart.
EV3 from the essential dynamics analysis splits the
two His-out structures, PAH_1 and FPAH (data not
shown). The difference between these can be described
as a localized twist of loop 2 containing His156. In this
case, an explanation is forthcoming. The fluorine atom
of one of the isomers of the racemic FPAH makes a
close nonbonded contact (3.0 A
˚
) with Gln164, induc-
ing a small displacement of the entire loop. Although
evidently non-natural, the existence of this loop con-
formation emphasizes just how conformationally plas-
tic the catalytic sites loops are.
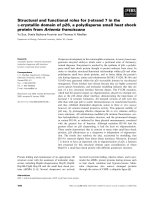
Fig. 4. A tunnel leading to the catalytic site
is present in PAH_1 (left) but not in PAH_2
(right). A semitransparent surface is shown,
uniformly coloured with the exception of the
surface contributions from bound PAH (col-
oured magenta), Lys155 (dark grey) and
His156 (light grey). These residues and the
ligand are shown as sticks.
Structural flexibility in T. brucei enolase M. V. A. S. Navarro et al.
5082 FEBS Journal 274 (2007) 5077–5089 ª 2007 The Authors Journal compilation ª 2007 FEBS
Sulfate complexes and a novel metal binding
site IV
The protein conformation most similar to the sulfate_1
structure [10] is sulfate_2 (Table 1) to which 405 Ca
atoms could be fit with an rmsd of 0.4 A
˚
and a maxi-
mum displacement of 2.0 A
˚
at position 276, a surface
residue distant from the catalytic site. Remarkably,
however, the sulfate_2 structure binds its two zinc ions
differently to sulfate_1. Both have fully occupied I
sites, the so-called conformational site [6], but
although sulfate_1 showed the position of the inhibi-
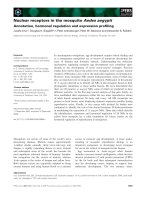
tory metal site III, the sulfate_2 structure reveals a
further novel metal-binding site IV at the enolase
catalytic site. As with site III, the metal in site IV is
ligated by His156 but, whereas metal in site III is also
bound by Gln164, Glu165 and Glu208, His156 is the
only protein ligand of the metal in site IV (Fig. 5).
Zinc ions bound by single protein ligands are compar-
atively rare in the Metalloprotein Database [33] but
there are several other examples. The Zn
2+
ion in
site IV is fully occupied and there appears to be no
doubt regarding the identity of this feature in the elec-
tron density map: there are no other components of
the crystallization solution that could be responsible.
Additionally, anomalous scattering maps reveal clear,
although somewhat noisy, density for both metal sites
(Fig. S6A). The density is similar to that observed for
the sulfur atoms of cysteine and methionine residues,
which have similar scattering power to zinc at the
wavelength used (1.54 A
˚
) (Fig. S6B). The zinc ion in
site IV is further ligated by five solvent molecules with
interatomic separations of 1.75–2.20 A
˚
(Fig. 5). The
B-factor of the metal ion in site IV of 41.3 is close to
that of the ligating nitrogen atom of His156 (39.2).
The His156 conformations in the sulfate_1 and sul-
fate_2 structures differ by only 21° at the v
1
rotation,
but by a 180° flip of the imidazole ring because the
Ne2 atom is involved in both cases (Fig. 2). The occu-
pation of site IV is unexpected because site III, with
additional, negatively charged ligands, would be
expected to have a higher affinity for the metal. We
can be confident that site III, and not site IV, corre-
sponds to the inhibitory metal site characterized kineti-
cally because the H156A mutant of the S. cerevisiae
enzyme retains an inhibitory site with one third of the
native enzyme’s affinity [34]. Such a mutant would
simply lack a site IV because the His side chain con-
tributes its only protein coordination. Nevertheless, it
remains possible that binding to site IV contributes to
the inhibition of enolase at elevated metal concentra-
tions.
The sulfate_3 structure closely resembles the PEP
and PAH_2 structures, with loops 1–4 fully closed. Its
Ca atoms can be fit to those of the PEP complex to
produce an rmsd of 0.23 A
˚
. Additionally, its two zinc
ions in sites I and II superimpose on those of the PEP
complex, as does the sulfate on the phospho group of
PEP (Fig. 2). It is unusual for occupation of the cata-
lytic site by a small sulfate or phosphate to be suffi-
cient to support full closure. This situation was seen in
one subunit of the E. coli structure, but the influence
of crystal packing was suspected [35]. More recently,
one subunit of the asymmetric human neuron enolase
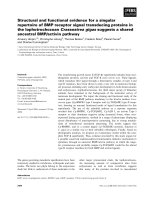
Fig. 5. Coordination of zinc ions occupying
metal site I and novel site IV (labelled) in the
sulfate_2 structure. Side chains and sulfate
are shown as sticks, water molecules and
Zn
2+
ions as spheres, coloured cyan and
grey, respectively. Electron density from a
metal-deleted F
o
–F
c
omit map contoured at
10 r is shown in magenta. Density in a
2F
o
–F
c
map (shades of blue) is contoured at
1 r in the vicinity of site IV, and at 2 r
around the sulfate and metal site I.
M. V. A. S. Navarro et al. Structural flexibility in T. brucei enolase
FEBS Journal 274 (2007) 5077–5089 ª 2007 The Authors Journal compilation ª 2007 FEBS 5083
was demonstrated to adopt the closed conformation
while containing only phosphate or sulfate [36].
Molecular dynamics simulations
The static description of crystal structures is incom-
plete for many proteins but particularly so in the case
of enolase. Not only do multiple structures from sev-
eral species demonstrate large conformational changes
at the catalytic site but also, in the case of the T. bru-
cei enzyme, crystal structures show Cys147 and Cys241
to be entirely buried in the second layer of protein resi-
dues below the base of the catalytic site [10] whereas
experimental data show that at least Cys147 can be
modified by iodoacetamide with resulting protein
inactivation [10]. To explore this and other issues, we
carried out 10 ns duration molecular dynamics simula-
tions on two fully solvated dimeric enolase structures,
the PEP complex and a PEP structure derivative with
active site contents removed to leave a single divalent
metal ion, the ‘conformational’ ion in site I. In each
case, Zn
2+
was replaced by the more physiologically
relevant Mg
2+
.
Initial modeling also highlighted Lys155 as a residue
near the catalytic site, present only in enolases from
T. brucei and Leishmania major, Euglena gracilis and
Treponema pallidum, which could be a target for irre-
versible modification by a suitable inhibitor. Such an
inhibitor would likely occupy the catalytic site; thus,
we assessed how closely the Lys155 side chain
approached ligands in that site. In the previous sul-
fate_1 structure [10], the Nf atom of Lys155 was far,
around 12 A
˚
, from the catalytic site-bound sulfate. In
the new PEP, PAH and FPAH structures, the Nf
atom is separated from the phospho(no) group by
approximately 7.5 A
˚
. Remarkably, although the posi-
tion of its neighbour, His156 varies dramatically
among these structures (Fig. 2), the position of the Nf
atom is constant (Figs 2 and 4), making a hydrogen
bond with the backbone carbonyl of Ala39. Encourag-
ingly, Lys155 lies at the mouth of the tunnel leading
from the protein surface to the bound ligand in the
His-out structures (Fig. 4). As such, it would lie near
to an expanded inhibitor occupying that tunnel. The
molecular dynamics results show that it approaches
the catalytic site even more closely. The separations of
its Nf atom and the oxygen atoms of the PEP phos-
pho group were monitored throughout the PEP trajec-
tory and reached values as low as 6.5 A
˚
. Clearly, the
prospects for the exploitation of this parasite-specific
residue are much better than first supposed.
To address the issue of Cys solvent accessibility, the
solvent-accessible surface area of Cys147 and Cys241
was monitored in both subunits throughout the molec-
ular dynamics simulations. It is already known that
the presence of PEP or PAH does not affect the chemi-
cal modification of the cysteines, suggesting that
iodoacetamide and other reagents do not access the
cysteines via the catalytic site. Examination of the
structures shows that the modifiable cysteine(s), and
the adjacent conserved buried water molecules [10], lie
quite close to the opposite surface of the protein. Only
the side chain of the penultimate residue, Trp428 sepa-
rates them from bulk solvent. The Trp side chain
remains firmly in place throughout the course of our
simulations, and neither buried water molecule
exchanges with bulk solvent, but nevertheless transient
displacement of the Trp side chain remains the most
likely means of access to the cysteines by modifying
reagents. Given that modification is a slow process
[10], it may be that the timescale of our simulations is
simply too short for it to be observed. Also, the actual
presence of the rather hydrophobic reagents, rather
than pure bulk solvent, may be necessary to induce the
necessary structural alterations that allow access, as
seen in other systems [37].
The trajectories were mapped onto the EVs obtained
by analysis of the crystal structures (Fig. 3) to deter-
mine to what extent these modes of structural variabil-
ity are explored. The PEP complex simulation remains
in the vicinity of the starting point. There is little ten-
dency toward the His156-out conformation (high val-
ues of EV2) and no evidence at all of coordinated loop
opening (high values of EV1). Because we have so far
only observed the His156-out conformation with inhib-
itors, and not with substrate, it may be that the
His156-out is favoured only for the former ligands for
reasons that remain unclear (see above). The results
for the single Mg trajectory (obtained by removing
PEP and the site II metal from the PEP complex struc-
ture) are intriguingly different. After exploring the
neighbourhood of the starting conformation for
approximately 5 ns, there is a transition (Fig. 3B) and
the protein explores an area of much higher values for
both EV1 (centred around 0.6) and EV2 (centred
around 0.2). This implies that, in the absence of PEP
and site II metal, there is a shift towards a more open
structure along both the coordinated loop dimension
(EV1) and the His156-out dimension (EV2). The tra-
jectory reaches the EV1 value of the open sulfate_1*
structure (maximum 1.73) and exceeds the EV2 values
of the His156-out inhibitor complexes (maximum
0.45). These results are fully consistent with the pre-
vailing notion of an ordered mechanism for enolase
[38]. With only metal site I occupied, the enzyme
adopts an open conformation (high values of EVs 1
Structural flexibility in T. brucei enolase M. V. A. S. Navarro et al.
5084 FEBS Journal 274 (2007) 5077–5089 ª 2007 The Authors Journal compilation ª 2007 FEBS
and 2) but with substrate present, and site II occupied
is stable in a closed conformation (lower values of EVs
1 and 2) in which catalytic residues align precisely for
reaction to occur. The mapping of the trajectories onto
EV3 (not shown), confirms that the twisted His156-out
loop induced by the fluorine atoms in the FPAH is a
conformation not explored naturally and therefore an
unfavourable one. This suggests that the lower pK
a
value of that inhibitor, compared to parent PAH,
comes at an energetic cost, consistent with the higher
experimental K
i
of FPAH (Doc. S1, Figs S1–S2).
Conclusions
Although previous work has painted a picture of flexi-
ble loops near the enolase catalytic site, the diversity
of structures observed for the T. brucei enzyme, in a
single crystal form and at broadly similar pH values, is
impressive. Particularly notable are the findings that
sulfate occupation of the catalytic site alone can lead
to full closure of all loops whereas, for reasons
unknown, other sulfate-bound structures are open and
exhibit unexpected diversity of metal binding [10]. Sim-
ilarly, occupation with the inhibitor PAH (or our
novel fluorinated PAH derivative) need not lead to full
closure of catalytic site loops, leaving open a tunnel
allowing for the design of enlarged inhibitors occupy-
ing more than the immediate vicinity of the small,
enclosed catalytic site. Equally encouraging for future
drug design is the discovery that a potentially modifi-
able Lys155 side chain lies near to this tunnel, not far
from the catalytic site as previously supposed [10]. Our
molecular dynamics results fail to demonstrate the
appearance of a channel exposing the modifiable cyste-
ine residue(s) to solvent, consistent with modification
being a slow process. In summary, our results empha-
size the importance of a full understanding of the
dynamic properties of a drug target for the effective
design of tight-binding and specific ligands.
Experimental procedures
Chemical synthesis
Phosphonoacetohydroxamate, lithium salt (PAH) and the
corresponding fluoro analog (FPAH) were obtained from
the diethylphosphonoacetic acid and the diethyl-2-fluoro-
phosphonoacetic acid, respectively, using an improved
reaction sequence distinct from that previously described
[28]. Diethyl-2-fluoro-phosphonoacetic was obtained by
saponification of the triethyl-2-fluoro-phosphonoacetate.
Diethylphosphonoacetic acid and the diethyl-2-fluoro-phos-
phonoacetic acid were linked to O-benzylhydroylamine in
the presence of 1-(3-dimethylaminopropyl)-3-ethylcarbodii-
mide and 4-di(methylamino)pyridine [39] to obtain the pro-
tected form of PAH and FPAH. The next step consisted
of the deprotection of these compounds by a catalytic
hydrogenation on Pd ⁄ BaSO
4
[40] followed by the deprotec-
tion of the phosphonate group by bromotrimethylsilane
[41]. Neutralization of the resulting acid derivatives with
LiOH provided the expected products PAH and FPAH as
lithium salts in 28% and 15% overall yield, respectively.
X-ray crystallography
Recombinant T. brucei enolase was expressed and purified
as previously described [2]. Briefly, bacterial cells (E. coli
BL21(DE3)pLysS strain) harbouring the recombinant
pET28a plasmid were grown at 37 °C until an attenuance
(D) at 600 nm of approximately 0.5 was reached and protein
expression was induced with 1 mm isopropyl thio-b-d-galac-
toside for 20 h at 30 °C. After centrifugation at 5000 g in a
Sorvall RC26 plus centrifuge with Sorvall GS-3 rotor, the
harvested cells were resuspended in TEA buffer, lysed
through alternating cycles of freezing–thawing and then
centrifuged. The resulting clarified supernatant was directly
subjected to nickel–nitrilotriacetic acid (Qiagen, Valencia,
CA, USA) affinity chromatography and the purified fusion
protein was treated with thrombin to remove the His-tag.
Crystallization was carried out based on the reported
conditions for T. brucei enolase [2], but using PEG1000 as
precipitant rather than PEG monomethylether 550. Ortho-
rhombic C222
1
crystals were obtained by the hanging drop
method using a reservoir solution of 10% (w ⁄ v) PEG1000,
0.01 m ZnSO
4
or ZnCl
2
, and 0.1 m Mes, pH 5.0–6.5, with
or without ligand at a concentration of 20 mm. Before
data collection, crystals of native T. brucei enolase were
immersed in the cryo-solution (mother liquor, 20% ethylene
glycol) with or without 20 mm of ligand (PEP, PAH or
FPAH) for 5 min and flash-cooled. X-ray diffraction data
were collected from two native crystals (referred to as sul-
fate_2 and sulfate_3 in Table 1) and four ligand-cocrystal-
lised crystals (referred to as PEP, PAH_1, PAH_2 and
FPAH in Table 1) using a Mar345 image plate detector
(X-Ray Research GmbH, Norderstedt, Germany) mounted
on a Rigaku UltraX 18 generator (Rigaku Corporation,
Tokyo, Japan) or at the MX1 beam line at the Laborato
´
rio
Nacional de Luz Sı
´
ncrotron (Campinas, Brazil) using Mar-
CCD 125 mm detector and radiation at 1.431 A
˚
(PAH_1).
All data sets were processed and scaled with the software
mosflm [42] and scala [43] from the ccp4 suite [44].
The structures were straightforwardly solved by molecu-
lar replacement with the software molrep [45], using the
previously determined T. brucei enolase structure (PDB
code 1oep) as the search model. The resulting molecular
replacement solutions were subjected to interactive rounds
of manual rebuilding into 2F
o
–F
c
and F
o
–F
c
electron
density maps using coot [46] and restrained refinement
M. V. A. S. Navarro et al. Structural flexibility in T. brucei enolase
FEBS Journal 274 (2007) 5077–5089 ª 2007 The Authors Journal compilation ª 2007 FEBS 5085
implemented in refmac [47]. The ligands were built into
difference electron density maps using coot. As with the pre-
viously reported T. brucei structure, intense positive peaks in
the difference maps were observed near the active site and
were modelled as metal ions. Their identities and occupancy
were determined based on the resulting maps and B-factors.
Water molecules were located automatically with the pro-
gram warp [48]. An additional, partially occupied (occu-
pancy 0.5–0.7) and artefactual metal site involving a His
residue at position ‘0’ (i.e. immediately preceding the natural
initiator Met within the tail downstream of the thrombin
cleavage site in the N-terminal extension containing the His
tag) was observed at a crystal lattice interface between in the
PAH and FPAH complexes. In all cases, final rounds of
refinement were carried out with the entire subunit defined as
a translation ⁄ libration ⁄ screw group in the modelling of
anisotropy within refmac. Isotropic B-factors were calcu-
lated from the refined translation ⁄ libration ⁄ screw parameters
and residual isotropic B-factors with tlsanl [49]. Stereo-
chemical parameters were analysed with procheck [50].
Details of the data collection and refinement statistics are
shown in Table 1. The PDB [51] codes for the new structures
are: sulfate_2 (2ptw), sulfate_3 (2ptx), PEP (2pty), PAH_1
(1ptz), PAH_2 (2pu0) and FPAH (2pu1).
Molecular dynamics
Molecular dynamics simulations of 10 ns duration each were
performed on the PEP complex structure, and also a structure
in which the PEP and site II metal had been removed leaving
a single metal ion in site I. The molecular dynamics calcula-
tions employed the gromacs simulation suite [52] using the
force field appropriate for proteins in water. Sodium ions were
added to the simulation system to compensate for the net neg-
ative charge of the protein. The simulation was carried out in
a cubic box with a minimal distance between solute and box
edge of 0.7 nm. Periodic boundary conditions were used. The
topology file for PEP was built using the small-molecule
topology generator prodrg [53], followed by manual exami-
nation. The crystal structures were relaxed by the default
protocol of energy minimization and 100 ps of position-
restrained molecular dynamics, in which the protein is
restrained to its starting conformation, prior to the start of
the simulations proper. After approximately 2000 ps of the
simulation proper, both trajectories were stable, fluctuating at
Ca rms deviations from the starting structure of approxi-
mately 0.18 nm (PEP + 2 Mg trajectory) and 0.22 nm (single
Mg trajectory). Monitoring of interatomic distances was
performed using other gromacs programs whereas solvent
accessible surface areas were calculated using dssp [54].
Other methods
Essential dynamics analysis [31] of a set of crystal struc-
tures (Table 1) was performed with programs from the
gromacs package [52]. Because the sulfate_2 structure
lacked a large number of loop 3 residues, it was omitted
from the set. However, the well-defined loop 1 of sulfate_2
was used to fill the gap of two residues (Thr41 and Gly42)
in the sulfate_1 structure, leaving only the gap in loop 3
from Thr260-Pro266. The sulfate_1 and sulfate_2 structures
are similar overall and in the vicinity enabling a simple
splicing of these two residues. Limited energy minimization
of residues 40–43 of the result with modeller 9 [55] was
carried out to regularize bond lengths and angles. The
spliced version of sulfate_1, called sulfate_1*, was used in
the essential dynamics analysis. The essential dynamics
method is based on the diagonalization of the covariance
matrix of atomic fluctuations, which yields a set of eigen-
values and EVs. The EVs indicate directions in a 3n-dimen-
sional space (where n ¼ the number of atoms in the
protein) and describe concerted fluctuations of the atoms.
The eigenvalues reflect the magnitude of the fluctuation
along the respective EVs. Structural superpositions and
other conformational analyses were performed using lsq-
man [56] and mustang [57]. Structural figures were made
with pymol [58].
Acknowledgements
We are grateful to Paul Michels for useful discussions
regarding this manuscript. An early part of this work
was supported by the European Commission through
its INCO-DEV programme (contract ICA4-CT-2001-
10075).
References
1 Fothergill-Gilmore LA & Michels PA (1993) Evolution
of glycolysis. Prog Biophys Mol Biol 59, 105–235.
2 Hannaert V, Albert MA, Rigden DJ, da Silva Giotto
MT, Thiemann O, Garratt RC, Van Roy J, Opperdoes
FR & Michels PA (2003) Kinetic characterization,
structure modelling studies and crystallization of Try-
panosoma brucei enolase. Eur J Biochem 270, 3205–
3213.
3 Qin J, Chai G, Brewer JM, Lovelace LL & Lebioda L
(2006) Fluoride inhibition of enolase: crystal structure
and thermodynamics. Biochemistry 45, 793–800.
4 Brown CK, Kuhlman PL, Mattingly S, Slates K, Calie
PJ & Farrar WW (1998) A model of the quaternary
structure of enolases, based on structural and evolution-
ary analysis of the octameric enolase from bacillus sub-
tilis. J Protein Chem 17, 855–866.
5 Schurig H, Rutkat K, Rachel R & Jaenicke R (1995)
Octameric enolase from the hyperthermophilic
bacterium Thermotoga maritima: purification,
characterization, and image processing. Protein Sci 4,
228–236.
Structural flexibility in T. brucei enolase M. V. A. S. Navarro et al.
5086 FEBS Journal 274 (2007) 5077–5089 ª 2007 The Authors Journal compilation ª 2007 FEBS
6 Lebioda L, Stec B & Brewer JM (1989) The structure of
yeast enolase at 2.25-A resolution. an 8-fold beta +
alpha-barrel with a novel beta beta alpha alpha (beta
alpha)6 topology. J Biol Chem 264, 3685–3693.
7 Holleman WH (1973) The use of absorption optics to
measure dissociation of yeast enolase into enzymatically
active monomers. Biochim Biophys Acta 327, 176–185.
8 Sims PA, Larsen TM, Poyner RR, Cleland WW & Reed
GH (2003) Reverse protonation is the key to general
acid–base catalysis in enolase. Biochemistry 42, 8298–
8306.
9 Sims PA, Menefee AL, Larsen TM, Mansoorabadi SO
& Reed GH (2006) Structure and catalytic properties of
an engineered heterodimer of enolase composed of one
active and one inactive subunit. J Mol Biol 355, 422–
431.
10 da Silva Giotto MT, Hannaert V, de Vertommen
DAS, Navarro MV, Rider MH, Michels PA, Garratt
RC & Rigden DJ (2003) The crystal structure of try-
panosoma brucei enolase: visualisation of the inhibi-
tory metal binding site III and potential as target for
selective, irreversible inhibition. J Mol Biol 331, 653–
665.
11 Wedekind JE, Poyner RR, Reed GH & Rayment I
(1994) Chelation of serine 39 to Mg
2+
latches a gate at
the active site of enolase: structure of the bis(Mg
2+
)
complex of yeast enolase and the intermediate analog
phosphonoacetohydroxamate at 2.1-A resolution.
Biochemistry 33, 9333–9342.
12 Zhang E, Brewer JM, Minor W, Carreira LA &
Lebioda L (1997) Mechanism of enolase: the crystal
structure of asymmetric dimer enolase-2-phospho-
D-glycerate ⁄ enolase-phosphoenolpyruvate at 2.0 A reso-
lution. Biochemistry 36, 12526–12534.
13 Lebioda L & Stec B (1991) Mechanism of enolase: the
crystal structure of enolase-Mg2(+)-2-phosphoglycer-
ate ⁄ phosphoenolpyruvate complex at 2.2-A resolution.
Biochemistry 30, 2817–2822.
14 Kim JW & Dang CV (2005) Multifaceted roles of glyco-
lytic enzymes. Trends Biochem Sci 30, 142–150.
15 Pancholi V (2001) Multifunctional alpha-enolase: its
role in diseases. Cell Mol Life Sci 58, 902–920.
16 Py B, Higgins CF, Krisch HM & Carpousis AJ (1996)
A DEAD-box RNA helicase in the Escherichia coli
RNA degradosome. Nature 381, 169–172.
17 Wistow GJ, Lietman T, Williams LA, Stapel SO, de
Jong WW, Horwitz J & Piatigorsky J (1988) Tau-crys-
tallin ⁄ alpha-enolase: one gene encodes both an enzyme
and a lens structural protein. J Cell Biol 107, 2729–
2736.
18 Feo S, Arcuri D, Piddini E, Passantino R & Giallongo
A (2000) ENO1 gene product binds to the c-myc pro-
moter and acts as a transcriptional repressor: relation-
ship with myc promoter-binding protein 1 (MBP-1).
FEBS Lett 473, 47–52.
19 Lee H, Guo Y, Ohta M, Xiong L, Stevenson B & Zhu
JK (2002) LOS2, a genetic locus required for cold-
responsive gene transcription encodes a bi-functional
enolase. EMBO J 21, 2692–2702.
20 Pancholi V & Fischetti VA (1998) Alpha-enolase, a
novel strong plasmin (ogen) binding protein on the
surface of pathogenic streptococci. J Biol Chem 273,
14503–14515.
21 Quinones W, Pena P, Domingo-Sananes M, Caceres A,
Michels PAM, Avilan L & Concepcion JL (2007) Leish-
mania mexicana: molecular cloning and characterization
of enolase. Exp Parasitol 116, 241–251.
22 Avilan L, Calcagno M, Figuera M, Lemus L, Puig J &
Rodriguez AM (2000) Interaction of Leishmania
mexicana promastigotes with the plasminogen-plasmin
system. Mol Biochem Parasitol 110, 183–193.
23 Verlinde CL, Hannaert V, Blonski C, Willson M, Perie
JJ, Fothergill-Gilmore LA, Opperdoes FR, Gelb MH,
Hol WG & Michels PA (2001) Glycolysis as a target for
the design of new anti-trypanosome drugs. Drug Resist
Updat 4, 50–65.
24 Dax C, Duffieux F, Chabot N, Coincon M, Sygusch
J, Michels PA & Blonski C (2006) Selective irrevers-
ible inhibition of fructose 1,6-bisphosphate aldolase
from Trypanosoma brucei. J Med Chem 49, 1499–
1502.
25 Claustre S, Denier C, Lakhdar-Ghazal F, Lougare A,
Lopez C, Chevalier N, Michels PA, Perie J & Willson M
(2002) Exploring the active site of Trypanosoma brucei
phosphofructokinase by inhibition studies: specific irre-
versible inhibition. Biochemistry 41
, 10183–10193.
26 Azema L, Lherbet C, Baudoin C & Blonski C (2006)
Cell permeation of a trypanosoma brucei aldolase inhib-
itor: evaluation of different enzyme-labile phosphate
protecting groups. Bioorg Med Chem Lett 16, 3440–
3443.
27 Albert MA, Haanstra JR, Hannaert V, Van Roy J,
Opperdoes FR, Bakker BM & Michels PA (2005)
Experimental and in silico analyses of glycolytic flux
control in bloodstream form Trypanosoma brucei. J Biol
Chem 280, 28306–28315.
28 Anderson VE, Weiss PM & Cleland WW (1984) Reac-
tion intermediate analogues for enolase. Biochemistry
23, 2779–2786.
29 Larsen TM, Wedekind JE, Rayment I & Reed GH
(1996) A carboxylate oxygen of the substrate bridges
the magnesium ions at the active site of enolase: struc-
ture of the yeast enzyme complexed with the equilibrium
mixture of 2-phosphoglycerate and phosphoenolpyr-
uvate at 1.8 A resolution. Biochemistry 35, 4349–4358.
30 Gavalda S (2005) L’e
´
nolase de Trypanosoma brucei:
synthe
`
se et etude du mode d’action d’inhibiteurs. The
`
se,
Universite
´
Paul Sabatier De Toulouse.
31 Amadei A, Linssen AB & Berendsen HJ (1993) Essen-
tial dynamics of proteins. Proteins 17, 412–425.
M. V. A. S. Navarro et al. Structural flexibility in T. brucei enolase
FEBS Journal 274 (2007) 5077–5089 ª 2007 The Authors Journal compilation ª 2007 FEBS 5087
32 Vinarov DA & Nowak T (1998) pH dependence of the
reaction catalyzed by yeast mg-enolase. Biochemistry 37,
15238–15246.
33 Castagnetto JM, Hennessy SW, Roberts VA, Getzoff
ED, Tainer JA & Pique ME (2002) MDB: the metallo-
protein database and browser at the scripps research
institute. Nucleic Acids Res 30, 379–382.
34 Vinarov DA & Nowak T (1999) Role of His159 in yeast
enolase catalysis. Biochemistry 38, 12138–12149.
35 Kuhnel K & Luisi BF (2001) Crystal structure of the
Escherichia coli RNA degradosome component enolase.
J Mol Biol 313, 583–592.
36 Chai G, Brewer JM, Lovelace LL, Aoki T, Minor W &
Lebioda L (2004) Expression, purification and the 1.8
angstroms resolution crystal structure of human neuron
specific enolase. J Mol Biol 341, 1015–1021.
37 Tsfadia Y, Friedman R, Kadmon J, Selzer A, Nachliel E
& Gutman M (2007) Molecular dynamics simulations of
palmitate entry into the hydrophobic pocket of the fatty
acid binding protein. FEBS Lett 581, 1243–1247.
38 Poyner RR, Cleland WW & Reed GH (2001) Role of
metal ions in catalysis by enolase: an ordered kinetic
mechanism for a single substrate enzyme. Biochemistry
40, 8009–8017.
39 Pelletier JC & Hesson DP (1995) A mild preparation
of amino acid N-acylsulfonamides. Synlett 11, 1141–
1142.
40 Nikam SS, Komberg BE, Johnson DR & Doherty AM
(1995) Synthesis of hydroxamic acids: Pd ⁄ BaSO4 as a
new catalyst for the deprotection of O-benzyl hydroxa-
mates. Tetrahedron Lett 36, 197–200.
41 McKenna CE, Higa MT, Cheung HH & McKenna M
(1977) The facile dealkylation of phosphonic acid
dialkyl esters by bromotrimethylsilane. Tetrahedron
Lett 2, 155.
42 Leslie AGW (1992) Recent changes to the MOSFLM
package for processing film and image plate data. Joint
CCP4 + ESF-EACMB Newsletter on Protein Crystal-
lography, Number 26.
43 Evans PR (1997) SCALA. Jnt CCP4 ⁄ ESF-EACMB
Newslett Protein Crystallogr 33, 22–24.
44 Collaborative Computational Project Number 4
(1994) The CCP4 suite: programs for protein crystal-
lography. Acta Crystallogr D Biol Crystallogr 50,
760–763.
45 Vagin A & Teplyakov A (1997) MOLREP: an auto-
mated program for molecular replacement. J Appl Cryst
30, 1022–1025.
46 Emsley P & Cowtan K (2004) Coot: model-building
tools for molecular graphics. Acta Crystallogr D Biol
Crystallogr 60, 2126–2132.
47 Murshudov GN, Vagin AA & Dodson EJ (1997)
Refinement of macromolecular structures by the maxi-
mum-likelihood method. Acta Crystallogr D Biol Crys-
tallogr 53, 240–255.
48 Perrakis A, Sixma TK, Wilson KS & Lamzin VS (1997)
wARP: improvement and extension of crystallographic
phases by weighted averaging of multiple-refined
dummy atomic models. Acta Crystallogr D Biol Crystal-
logr 53, 448–455.
49 Howlin B, Butler SA, Moss DS, Harris GW & Driessen
HPC (1993) TLSANL: TLS parameter analysis program
for segmented anisotropic refinement of macromolecular
structures. J Appl Cryst 26, 622–624.
50 Laskowski RA, MacArthur MW, Moss DS & Thornton
JM (1993) PROCHECK: a program to check the stereo-
chemical quality of protein structures. J Appl Cryst 26,
283–291.
51 Berman H, Henrick K, Nakamura H & Markley JL
(2007) The worldwide protein data bank (wwPDB):
ensuring a single, uniform archive of PDB data. Nucleic
Acids Res 35, D301–D303.
52 Van Der Spoel D, Lindahl E, Hess B, Groenhof G,
Mark AE & Berendsen HJ (2005) GROMACS: fast,
flexible, and free. J Comput Chem 26, 1701–1718.
53 van Aalten DM, Bywater R, Findlay JB, Hendlich M,
Hooft RW & Vriend G (1996) PRODRG, a program
for generating molecular topologies and unique molecu-
lar descriptors from coordinates of small molecules.
J Comput Aided Mol Des 10, 255–262.
54 Kabsch W & Sander C (1983) Dictionary of protein sec-
ondary structure: pattern recognition of hydrogen-
bonded and geometrical features. Biopolymers 22, 2577–
2637.
55 Sali A & Blundell TL (1993) Comparative protein mod-
elling by satisfaction of spatial restraints. J Mol Biol
234, 779–815.
56 Kleywegt GJ (1999) Experimental assessment of differ-
ences between related protein crystal structures. Acta
Crystallogr D Biol Crystallogr 55, 1878–1884.
57 Konagurthu AS, Whisstock JC, Stuckey PJ & Lesk AM
(2006) MUSTANG: a multiple structural alignment
algorithm. Proteins 64, 559–574.
58 DeLano WL (2002) The PyMOL molecular graphics
system on the world wide web. Available at
.
59 Wallace AC, Laskowski RA & Thornton JM (1995)
LIGPLOT: a program to generate schematic dia-
grams of protein–ligand interactions. Protein Eng 8,
127–134.
Supplementary material
The following supplementary material is available
online:
Doc S1. Kinetic characterization of the inhibition of
T. brucei enolase by FPAH.
Fig. S1. Lineweaver–Burk plots for T. brucei enolase in
the presence of FPAH.
Structural flexibility in T. brucei enolase M. V. A. S. Navarro et al.
5088 FEBS Journal 274 (2007) 5077–5089 ª 2007 The Authors Journal compilation ª 2007 FEBS
Fig. S2. Secondary plots derived from Lineweaver–
Burk plots for T. brucei enolase in the presence of
FPAH.
Fig. S3. Alignment of enolases from human and try-
panosomatids.
Fig. S4.
LIGPLOT [59] figures of the interactions with
enzyme of ligands in the new complexes.
Fig. S5. Stereo figures generated with
PYMOL showing
electron density for ligands in the new complexes.
Fig. S6. Anomalous scattering maps for the sulfate_3
structure at 1.54 A
˚
.
This material is available as part of the online article
from
Please note: Blackwell Publishing is not responsible
for the content or functionality of any supplementary
materials supplied by the authors. Any queries (other
than missing material) should be directed to the corre-
sponding author for the article.
M. V. A. S. Navarro et al. Structural flexibility in T. brucei enolase
FEBS Journal 274 (2007) 5077–5089 ª 2007 The Authors Journal compilation ª 2007 FEBS 5089