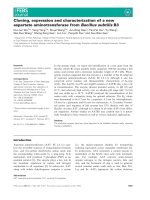
Báo cáo khoa học: Apo a-lactalbumin and lysozyme are colocalized in their subsequently formed spherical supramolecular assembly doc
Bạn đang xem bản rút gọn của tài liệu. Xem và tải ngay bản đầy đủ của tài liệu tại đây (360.11 KB, 9 trang )
Apo a-lactalbumin and lysozyme are colocalized in their
subsequently formed spherical supramolecular assembly
Michae
¨
l Nigen, Thomas Croguennec, Marie-Noe
¨
lle Madec and Saı
¨
d Bouhallab
INRA, Agrocampus Rennes, France
Protein aggregation into various nano- to micrometre
architectural assemblies, including amorphous aggre-
gates, clusters, fibrils, tubes and spherical particles, is a
widespread phenomenon in biological science [1–4].
However, the mechanism underlying protein aggrega-
tion is not fully understood, and the control of protein
aggregation into well-defined supramolecular structures
is highly relevant in different scientific fields: biotech-
nology [5], medical science [6,7] and microbiology [8].
Proteins have also been shown to be an interesting
material in nanotechnology for the engineering and
development of novel biomaterials through the control
of supramolecular structure design [9–11]. Starting
from globular proteins, the formation of supramolecu-
lar structures depends on the environmental conditions
(temperature, pH, ionic strength, use of denaturants)
that affect protein stability [12,13]. When placed under
favourable conditions, proteins are able to self-assem-
ble into complex structures. For instance, (partially)
unfolded proteins can form fibrils, aggregates or spher-
ical particles under mild denaturing conditions when
the pH of the solution is varied. At pH values far from
the isoelectric point, where the protein is highly
charged, the formation of fibres is favoured [14–17].
By contrast, close to the isoelectric point, spherical
particles, in addition to classical amorphous aggre-
gates, can be obtained [15,18].
In comparison with the above studies, fewer investi-
gations have been carried out on the formation of
well-defined supramolecular structures from a mixture
Keywords
assembly; a-lactalbumin; lysozyme;
microscopy; microsphere
Correspondence
S. Bouhallab, INRA, Agrocampus Rennes,
UMR 1253, Science & Technologie du Lait
et de l’Œuf, 65 rue de Saint Brieuc,
F-35042 Rennes cedex, France
Fax: +33 2 23 48 53 50
Tel: +33 2 23 48 57 42
E-mail:
(Received 31 August 2007, revised 4 October
2007, accepted 5 October 2007)
doi:10.1111/j.1742-4658.2007.06130.x
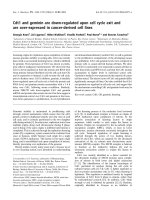
We have reported previously that the calcium-depleted form of bovine
a-lactalbumin (apo a-LA) interacts with hen egg-white lysozyme (LYS) to
form spherical supramolecular structures. These supramolecular structures
contain an equimolar ratio of the two proteins. We further explore here
the organization of these structures. The spherical morphology and size
of the assembled LYS ⁄ apo a-LA supramolecular structures were demon-
strated using confocal scanning laser microscopy and scanning electron
microscopy. From confocal scanning laser microscopy experiments with
labelled proteins, it was found that LYS and apo a-LA were perfectly colo-
calized and homogeneously distributed throughout the entire three-dimen-
sional structure of the microspheres formed. The spatial colocalization of
the two proteins was also confirmed by the occurrence of a fluorescence
resonance energy transfer phenomenon between labelled apo a-LA and
labelled LYS. Polarized light microscopy analysis revealed that the micro-
spheres formed differ from spherulites, a higher order semicrystalline struc-
ture. As the molecular mechanism initiating the formation of these
microspheres is still unknown, we discuss the potential involvement of a
LYS ⁄ apo a-LA heterodimer as a starting block for such a supramolecular
assembly.
Abbreviations
apo a-LA, calcium-depleted a-lactalbumin; CSLM, confocal scanning laser microscopy; FITC, fluorescein isothiocyanate; FRET, fluorescence
resonance energy transfer; LYS, hen egg-white lysozyme; RBITC, rhodamine B isothiocyanate; SEM, scanning electron microscopy.
FEBS Journal 274 (2007) 6085–6093 ª 2007 The Authors Journal compilation ª 2007 FEBS 6085
of proteins, even though it has been shown to be a
promising approach to the design of new architectural
assemblies [19]. Recently, Biesheuvel et al. [20] have
shown that well-organized spherical particles between
oppositely charged lysozyme (native and succinylated
lysozyme) can be formed. At the same time, we dem-
onstrated the formation of spherical particles between
calcium-depleted a-lactalbumin (apo a-LA) and chemi-
cally unmodified hen egg-white lysozyme (LYS) [3].
LYS and a-lactalbumin are two related proteins of 129
and 123 amino acid residues, respectively, which share
a similar three-dimensional structure, including four
disulfide bonds [21–23]. These proteins differ particu-
larly in their opposing isoelectric points (the pI value
of lysozyme is 10.7, whereas that of a-lactalbumin is
near 4–5) and their calcium-binding properties (a-lact-
albumin has a specific calcium-binding site). Interest-
ingly, the formation of spherical particles containing
the two proteins in an equimolar ratio was favoured at
pH 7.5 under conditions in which apo a-LA adopts
a molten globule conformation (temperature above
30 °C) [3].
In the current study, we extend this work to provide
more insight into the supramolecular organization of
LYS ⁄ apo a-LA into spherical particles, called here
LYS ⁄ apo a-LA microspheres. Using a combination of
two microscopic techniques, confocal scanning laser
microscopy (CSLM) and scanning electron microscopy
(SEM), we demonstrate that these microspheres are
totally filled, with perfect spatial colocalization of both
proteins, LYS and apo a-LA.
Results
In our previous work, we reported the ability of
LYS and apo a-LA to form microspheres at pH 7.5
as long as the protein molar ratio exceeded 0.2 [3].
A molar ratio of unity was selected in the present
work to further characterize the microspheres
formed.
Visualization of microspheres by CSLM
The use of CSLM to characterize microspheres result-
ing from the interaction between LYS and apo a-LA
required the labelling of both proteins with two differ-
ent specific dyes. The fluorescent dyes fluorescein iso-
thiocyanate (FITC) and rhodamine B isothiocyanate
(RBITC) were covalently linked to apo a-LA and
LYS, respectively. About 5% of apo a-LA or LYS
contained one mole of FITC or RBITC per mole of
protein, respectively, as assessed by mass spectrometry
analyses (results not shown). To examine the influence
of labelling on protein interaction and the formation
of microspheres, LYS and apo a-LA were mixed using
only one labelled protein. Figure 1 presents the CSLM
images of the mixtures of apo a-LA-FITC with unla-
belled LYS (Fig. 1A) and unlabelled apo a-LA with
LYS-RBITC (Fig. 1B) at 45 °C. In both cases, regular
spheres with a diameter in the range 1–4 lm were
observed in accordance with previous observations [3].
The microspheres were either green (FITC) or red
(RBITC) according to the fluorescent dye used for the
labelling reaction. Consequently, neither the labelling
of apo a-LA with FITC, nor the labelling of LYS with
RBITC, influenced the interaction or self-association
phenomenon between apo a-LA and LYS at 45 °C.
Moreover, the labelling level of both proteins ( 5%)
was sufficient to allow the observation and character-
ization of microspheres by CSLM. From these images,
the surface of the microspheres seemed to be rather
smooth without any visible protuberances. During
these experiments, a coalescence phenomenon was also
observed between the microspheres (Fig. 1).
In Fig. 2, the images acquired using optical micros-
copy and CSLM are compared. This comparison was
AB
Fig. 1. Confocal scanning laser micrographs
of microspheres prepared from apo a-LA-
FITC and unlabelled LYS (A) or unlabelled
apo a-LA and LYS-RBITC (B). Microspheres
were obtained by mixing LYS (0.1 m
M) with
apo a-LA (0.1 m
M)in30mM Tris ⁄ HCl buffer,
pH 7.5, containing 15 m
M NaCl, and incu-
bated for 30 min at 45 °C. Scale bars ¼ 5 lm.
Arrows indicate microspheres undergoing
coalescence.
Properties of assembled a-lactalbumin and lysozyme M. Nigen et al.
6086 FEBS Journal 274 (2007) 6085–6093 ª 2007 The Authors Journal compilation ª 2007 FEBS
a good tool to determine the localization of the
labelled and unlabelled areas within the microspheres.
In this experiment, microspheres were formed using
both labelled proteins. Figure 2A shows an image of
the microspheres taken using optical microscopy.
Good spherical structures were observed with a slightly
bright white ring surrounding the microspheres. The
image of the same (x, y) plane taken using CSLM is
shown in Fig. 2B. In this image, the spherical particles
are orange, resulting from the combination of the fluo-
rescence signals of the two labelled proteins incorpo-
rated into the microspheres. After the superimposition
of both optical microscopy and CSLM images, the
bright white ring surrounding the microspheres was
still observed, but without any fluorescence signal
(Fig. 2C). Consequently, no proteins were localized in
this area. This ring, only observed using optical
microscopy, was probably generated from the light
scattering of microspheres during optical microscopy
observation.
Organization of LYS and apo a-LA within
microspheres by CSLM
To investigate the distribution of apo a-LA and LYS,
the microspheres were formed with both labelled
proteins, and the fluorescence intensity of FITC and
RBITC was measured across the spheres (Fig. 3). For
this study, the three-dimensional structure of the micro-
spheres was generated using the accumulation of sev-
eral images along the z axis for a given (x, y) plane.
Figure 3A shows the plane corresponding to the mid-
dle of the microspheres as an example of slices along
the z axis. Figure 3B shows the normalized fluores-
cence intensity measured along the dotted line depicted
in Fig. 3A. The two spectra showed the same behav-
iour along the entire line, with emission detected only
at the microsphere area. The size of the microsphere
determined using the two relative fluorescence intensity
curves (Fig. 3B), as well as from the image, was about
ABC
Fig. 2. Visualization of the microspheres generated from labelled proteins (apo a-LA-FITC and LYS-RBITC) using optical microscopy (A),
confocal scanning laser microscopy (B) and the superimposition of the two images (C). Scale bars ¼ 2 lm.
A
B
Fig. 3. Confocal scanning laser micrographs of microspheres pre-
pared from apo a-LA-FITC and LYS-RBITC (A), and fluorescence
intensity of FITC (green line) and RBITC (red line) along the dotted
line (B). Scale bar ¼ 3 lm.
M. Nigen et al. Properties of assembled a-lactalbumin and lysozyme
FEBS Journal 274 (2007) 6085–6093 ª 2007 The Authors Journal compilation ª 2007 FEBS 6087
3 lm. The superimposition of the curves representing
the relative fluorescence intensity of FITC and RBITC
showed a similar distribution of apo a-LA-FITC and
LYS-RBITC in the microspheres. Furthermore, the
relative fluorescence intensity was constant for both
dyes across the microspheres. Consequently, the
labelled apo a-LA and LYS were homogeneously dis-
tributed throughout the microspheres. This feature was
observed whatever plane of the microsphere was stud-
ied along the z axis (results not shown). The distribu-
tion of the two labelled proteins inside the structures
indicated that the microspheres formed were filled with
both proteins. No vacuoles containing solvent or air
were observed throughout the internal structure of the
microspheres.
The localization of both proteins was explored in
more detail by simultaneous excitation of the two dyes
in the same sample (Fig. 4). The recorded images
resulting from the signals of FITC and RBITC are
shown in Fig. 4A and 4B, respectively. These two
images were very similar, with the visualization of the
same spheres in the same area of the image. Further-
more, the size of the spheres observed with FITC
(Fig. 4A) was identical to the size of the spheres
observed with RBITC (Fig. 4B). The superimposition
of the two sets of images is presented in Fig. 4C. In
this image, all the spheres were orange; neither green
nor red emissions were observed. Consequently, apo
a-LA and LYS are colocalized throughout the micro-
spheres.
Further evidence of the colocalization of the two
proteins in the microspheres was drawn from fluores-
cence emission spectra. When microspheres containing
both labelled proteins were excited at 543 nm, one
spectrum with a maximum emission wavelength at
584 nm was recovered (Fig. 5A). This spectrum was
attributed to the emission of RBITC, as the same
emission spectrum was obtained after excitation at
543 nm of LYS-RBITC ⁄ apo a-LA microspheres
(Fig. 5A). By contrast, excitation at 488 nm of the
microspheres containing both labelled proteins resulted
in an emission spectrum containing two maxima at
wavelengths of 524 and 584 nm (Fig. 5B). Only one
maximum at a wavelength of 522 nm was recovered
from the emission spectrum following excitation at
ABC
Fig. 4. Confocal scanning laser micrographs
of microspheres prepared from apo a-LA-
FITC and LYS-RBITC. Excitation of the dyes:
488 nm for FITC (A); 543 nm for RBITC (B);
488 and 543 nm (C). Scale bars ¼ 5 lm.
0
0.2
0.4
0.6
0.8
1
1.2
525 575 625 675 725
Emission wavelength (nm)
Relative fluorescence intensity (AU)
A
0
0.2
0.4
0.6
0.8
1
1.2
475 525 575 625 675
Emission wavelength (nm)
Relative fluorescence intensity (AU)
B
Fig. 5. Emission spectra of LYS-RBITC ⁄ apo a-LA (gray) and LYS-
RBITC ⁄ apo a-LA-FITC (black) excited at 543 nm (A), and LYS ⁄
apo a-LA-FITC (gray) and LYS-RBITC ⁄ apo a-LA-FITC (black) excited
at 488 nm (B).
Properties of assembled a-lactalbumin and lysozyme M. Nigen et al.
6088 FEBS Journal 274 (2007) 6085–6093 ª 2007 The Authors Journal compilation ª 2007 FEBS
488 nm of the microspheres formed from the mixture
of LYS⁄ apo a-LA-FITC (Fig. 5B). In addition, no
emission signal from FITC was observed after the
excitation at 543 nm of LYS ⁄ apo a-LA-FITC micro-
spheres (results not shown). Consequently, the two
maxima at wavelengths of 524 and 584 nm in the emis-
sion spectrum of the microspheres containing both
labelled proteins can be attributed to the emission of
FITC and RBITC, respectively. In a control experi-
ment, no emission signal was detected after excitation
of LYS-RBITC ⁄ apo a-LA microspheres at 488 nm, as
reported previously by Lamprecht et al. [24]. Conse-
quently, the occurrence of an unexpected emission
signal at 584 nm (Fig. 5B) could be attributed to
fluorescence resonance energy transfer (FRET) from
FITC to RBITC: a quantity of the energy from the
emission of FITC was transferred and absorbed by
RBITC, acting as excitation energy. The FRET phe-
nomenon occurs only when dyes are close to one
another, within the 1–10 nm range [25]. Moreover, it
should be noted that the relative fluorescence intensity
of the pick corresponding to FITC was lower than that
of RBITC, underlying the high-energy transfer yield.
The FRET phenomenon between FITC and RBITC
confirms the good colocalization of apo a-LA and
LYS within the microspheres, the proteins being sepa-
rated by less than 10 nm.
Characterization of the microsphere surface
by SEM
The morphology and external structure of the micro-
spheres were studied using SEM. The scanning elec-
tron micrographs in Fig. 6 show that the microspheres
have a diameter in the range 1–4 lm (Fig. 6A,B), in
good agreement with the microsphere diameter deter-
mined by confocal microscopy and optical microscopy.
The microspheres seemed to have a compact and den-
sely packed structure with a coarse surface (Fig. 6B,C)
without any protuberances. The surface of the micro-
spheres exhibited a somewhat specific organization
(Fig. 6C), consisting of a relatively rough network that
was shown to be made up of both proteins (CSLM
observations). Such a rough appearance of the micro-
spheres could be linked to the evaporation of water
during the dehydration step needed for SEM observa-
tions.
Coalescence between microspheres was also observed
using SEM. The coalescence phenomenon between
three microspheres is shown in Fig. 7A. Different
stages of the coalescence phenomenon are shown in
this image. The two larger microspheres are at an ear-
lier stage of the coalescence phenomenon, whereas the
coalescence phenomenon is almost complete in the
large microsphere in the middle and the smaller one
AB C
Fig. 6. Scanning electron micrographs of microspheres generated from LYS and apo a-LA at different magnifications: (A) · 2000; scale
bar ¼ 10 lm; (B) · 20 000; scale bar ¼ 1 lm; (C) · 100 000; scale bar ¼ 0.2 lm. Microspheres were obtained by mixing LYS (0.1 m
M) with
apo a-LA (0.1 m
M)in30mM Tris ⁄ HCl buffer, pH 7.5, containing 15 mM NaCl, and incubated for 30 min at 45 °C.
AB
Fig. 7. Scanning electron micrographs
showing the coalescence phenomenon
between microspheres prepared from LYS
and apo a-LA at different magnifications: (A)
· 10 000; (B) · 20 000. Scale bars ¼ 1 lm.
M. Nigen et al. Properties of assembled a-lactalbumin and lysozyme
FEBS Journal 274 (2007) 6085–6093 ª 2007 The Authors Journal compilation ª 2007 FEBS 6089
on the right, as also shown in Fig. 7B. At the begin-
ning, the two microspheres seem to coalesce with the
formation of a groove between them, which appears
darker on the image. Then, the microspheres continue
to coalesce, with the disappearance of the groove
between them at the end of this phenomenon; one of
the two microspheres seems to be absorbed by the sec-
ond, as shown in Fig. 7A,B. The coalescence observed
between these microspheres appears as a ‘swallowing
up’ phenomenon.
Discussion
Understanding specific associations between proteins is
fundamental to all aspects of life, as well as to the gen-
eration of novel biomaterials of interest for the phar-
maceutical and food industries. Well-ordered amyloid
fibres, characterized by a canonical cross-b structure
and the frequent presence of repetitive hydrophobic or
polar interactions along the fibrillar axis, and classical
irregular amorphous aggregates are the main protein
assemblies that have been extensively studied. Spheri-
cal particles constitute a recent type of supramolecular
structure that is formed during protein self-assembly
under slightly stressed conditions. Recently, we have
reported the occurrence of spheres following the inter-
action and assembly of two small globular proteins,
LYS and apo a-LA, under specific physicochemical
conditions. Optical microscopic observations showed
that, at 45 °C and pH 7.5, the LYS ⁄ apo a-LA assem-
bly leads to the formation of microspheres, with a size
range from 1 to 4 lm. The present study provides the
first characterization of the external and internal struc-
tures of these original microspheres. Using CSLM, we
observed that these microspheres are filled structures,
with the two hydrated proteins well distributed
throughout the spherical particle and without solvent
vesicles in the internal structure. Spherical supramolec-
ular structures exhibiting different properties depend-
ing on the nature of the biopolymer and the
experimental conditions have been reported for other
protein systems. For instance, spherical filled structures
similar to those described here have been reported to
occur during the fibrillation process of tropoelastin
[26]. It has been shown that tropoelastin alone in solu-
tion is able to form microspheres containing hydrated
proteins when hydrophobic patches are exposed onto
the protein surface at temperatures above 29 °C.
Otherwise, higher order semicrystalline spheres, called
spherulites, have been observed during protein self-
assemblies. For instance, these particular supramole-
cular structures have been reported in the case of
heat-treated b-lactoglobulin [15] or bovine insulin [17].
One of the main properties of spherulites is that they
exhibit, under a polarized light microscope, a typical
Maltese cross pattern of light extinction, which is
caused by the difference in refractive index between
the plane axis and the perpendicular axis. Polarized
light microscopy analysis ruled out the occurrence of
such spherulite forms in our protein system (results not
shown). As in the case of tropoelastin [26], it is assumed
that the LYS ⁄ apo a-LA microspheres are likely to grow
in an outward manner and to reach a critical size, at
which no more protein molecules can be incorporated.
However, the precise internal organization is still
unknown; in particular, how solvent molecules are
sequestered and how both proteins are arranged in the
three-dimensional network. Studies are currently in
progress to further explore the internal structure of the
microspheres formed, as well as the mechanism of their
formation, using cryo-high-resolution SEM and time-
resolved small-angle X-ray scattering. At a mechanical
level, it is widely established that a ‘nucleated growth
mechanism’ prevails during biopolymer self-assembly
processes [6]. Such a nucleation and growth process can
be described either by the classical theory of hetero-
geneous nucleation or by an aggregation mechanism
involving primary particles [27].
We have demonstrated here that LYS and apo a-LA
are perfectly colocalized in the microspheres, as dem-
onstrated by the CSLM image and by the energy
transfer from the apo a-LA-FITC fluorescence emis-
sion to LYS-RBITC (FRET phenomenon). This result
corroborates our recent finding concerning the equi-
molar quantity of LYS and apo a-LA in the micro-
spheres, whatever the initial LYS ⁄ apo a-LA molar
ratio in the bulk [3]. Thus, mechanistically speaking, it
appears likely that the microspheres formed are com-
posed of an assembly of an elementary dimeric entity
containing a molecule of LYS and a molecule of
apo a-LA. The occurrence of a heterodimer form
between lysozyme and a-lactalbumin at neutral pH has
already been observed by Ibrahim et al. [28]. Our pro-
posal is that this dimeric form plays a central role in
the nucleation and ⁄ or growth steps to form the final
structures. If confirmed, such a growth mechanism will
strongly support the work by Dima and Thirumalai
[29] showing the crucial role of dimerization in protein
aggregation and self-propagation.
Two main hypotheses are generally proposed as the
requirement for the aggregation and assembly process
of a globular protein [6]: (a) conformational change,
leading to the formation of an unfolded state with
decreased stability; (b) the formation of an oligomeric
structure between native protein conformations which
enhances the association process. As the formation of
Properties of assembled a-lactalbumin and lysozyme M. Nigen et al.
6090 FEBS Journal 274 (2007) 6085–6093 ª 2007 The Authors Journal compilation ª 2007 FEBS
LYS ⁄ apo a-LA microspheres requires both partial
unfolding of apo a-LA, obtained at a temperature
above 27 °C [30], and probably the formation of a
heterodimer as a starting block, our protein system is
a special case in which the two events occur together.
In conclusion, the LYS ⁄ apo a-LA system constitutes
a good model to highlight the mechanistic keys
required for a fundamental understanding of the events
involved in protein self-assembly (driving forces, nat-
ure and energy of the interactions) leading to different
supramolecular structures [3], and for the control and
orientation of protein interactions and cluster forma-
tion. We are convinced that an understanding of the
behaviour of this system will shed new light on the
relationships between interactions at the molecular
level and the architecture of the generated supramolec-
ular structures. Studies on the mechanism of the for-
mation and association of the heterodimer between the
two proteins are underway.
Experimental procedures
Materials
Commercial lysozyme (LYS) was purchased from Ovonor
and contained 95% LYS and 3% chloride ions.
Holo a-lactalbumin (holo a-LA) was purified from bovine
whey as reported by Caussin et al. [31]. Apo a-lactalbumin
(apo a-LA) was prepared by dialysis of a solution of
holo a-LA against deionized water at pH 3 during 48 h at
4 °C using a 6–8000 Da nominal cut-off membrane (Spec-
trum Laboratories, Gardena, CA, USA) in order to remove
calcium ions. Then, the pH of the apo a -LA solution was
adjusted to pH 7 with 1 m NaOH and freeze-dried; the
apo a-LA powder contained less than 2% calcium. FITC
and RBITC were purchased from Sigma-Aldrich (L’Isle
d’Abeau Chesnes, France).
Protein labelling
LYS and apo a-LA were labelled separately using two
different covalently linking fluorescent dyes: FITC and
RBITC were used for apo a-LA and LYS labelling, respec-
tively. The labelling was achieved as follows. Aqueous solu-
tions of 0.2 mm LYS and 0.2 mm apo a-LA were adjusted
to pH 8.5 using 1 m NaOH and filtered through a 0.2 lm
membrane. Subsequently, 100 lL of the dye solution,
dissolved in dimethylsulfoxide at a concentration of
1mgÆmL
)1
, was added to the protein solution. The cross-
linking reaction occurred at room temperature under gentle
stirring during 3 h. Then, the solutions were first dialysed
against 10 mm Tris ⁄ HCl, 0.6 m NaCl buffer, pH 7, to
remove free dyes, and second against deionized water at
pH 7 using a dialysis membrane (Spectrum Laboratories)
with a nominal cut-off of 6–8000 Da. The solutions were
then centrifuged at 12 000 g for 30 min and the superna-
tants were recovered and freeze-dried.
Preparation of LYS
⁄
apo a-LA mixtures
Stock solutions of labelled and unlabelled LYS and
apo a-LA were prepared by solubilization of protein pow-
der in 30 m m Tris ⁄ HCl, 15 mm NaCl buffer, pH 7.5, and
filtered through a 0.2 lm membrane. The protein concen-
tration was determined by measuring the absorbance at
280 nm using extinction coefficients of 2.01 and 2.64 LÆg
)1
cm
)1
for apo a-LA and LYS, respectively.
Mixtures of LYS ⁄ apo a-LA with a molar ratio of unity at
45 °C were prepared using stock solutions of labelled and
unlabelled LYS and apo a-LA. The final protein concentra-
tion in the mixtures was 0.2 mm. Mixtures containing at least
one labelled protein were used for CSLM studies, whereas
only unlabelled proteins were used for SEM studies. In this
study, all the microscopic analyses were performed after
equilibration of the protein mixtures at 45 °C for 30 min.
CSLM and optical microscopy
A Nikon C1Si laser scanning confocal imaging system on
an inverted TE2000-E microscope (Nikon, Champigny-sur-
Marne, France), equipped with a differential interference
contrast unit and argon ion and helium ⁄ neon lasers emitting
at 488 and 543 nm, respectively, was used to investigate the
organization of LYS and apo a-LA within microspheres.
All optical and fluorescence confocal data were acquired
with a · 100 objective (oil immersion; numeric aperture,
1.40). CSLM studies were performed using the standard
mode for the acquisition of images and the spectral mode
for the acquisition of the spectra of the dyes. For the acqui-
sition of images using the standard mode, FITC and RBITC
were excited at 488 and 543 nm, respectively, and the emit-
ted light from FITC and RBITC was recovered at 515 ⁄ 30
and 590 ⁄ 50 nm, respectively. For the acquisition of spectra,
the spectral imaging system C1si was used. FITC and
RBITC were excited at 488 and 543 nm, respectively, and
the emission spectra of both dyes were recovered using a
multianode PMT made up of 32 channels with a resolution
of 5 nm. The microspheres were analysed under optical and
polarized light using a differential interference contrast unit
which enhances the contrast between the object and the
background using the 543 nm line of the helium ⁄ neon laser.
The software used for the CSLM and optical images was
EZ-C1 version 3.40 (Nikon).
SEM
Mixtures of apo a-LA and LYS, prepared at 45 °C, were
deposited on an ester cellulose membrane. Samples were
M. Nigen et al. Properties of assembled a-lactalbumin and lysozyme
FEBS Journal 274 (2007) 6085–6093 ª 2007 The Authors Journal compilation ª 2007 FEBS 6091
fixed in 30 mm Tris ⁄ HCl, 15 mm NaCl buffer, pH 7.5, con-
taining 2.5% (v ⁄ v) glutaraldehyde for 1 h at room tempera-
ture. Then, the samples were dehydrated using successive
ethanol solutions at 50%, 75%, 85%, 95% and 100%
(elapsed time per solution, 5 min). Following dehydration,
the samples were critical point dried using carbon dioxide,
and coated with gold. The experiments were performed
using a JEOL JSM 6301F field emission scanning electron
microscope with an accelerating voltage of 9 kV (JEOL,
Tokyo, Japan).
Acknowledgements
The authors would like to thank J. Le Lannic
(CMEBA, Rennes, France) for his contribution to the
acquisition of SEM images, and D. Molle
´
(UMR1253
INRA, Rennes, France) for performing mass spec-
trometry analyses.
References
1 Goers J, Permyakov SE, Permyakov EA, Uversky VN &
Fink AL (2002) Conformational prerequisites for
a-lactalbumin fibrillation. Biochemistry 41, 12546–12551.
2 Majhi PR, Ganta RR, Vanam RP, Seyrek E, Giger K
& Dubin PL (2006) Electrostatically driven protein
aggregation: b-lactoglobulin at low ionic strength.
Langmuir 22, 9150–9159.
3 Nigen M, Croguennec T, Renard D & Bouhallab S
(2007) Temperature affects the supramolecular struc-
tures resulting from a-lactalbumin–lysozyme interaction.
Biochemistry 46, 1248–1255.
4 Stradner A, Sedgwick H, Cardinaux F, Poon WCK,
Egelhaaf SU & Schurtenberger P (2004) Equilibrium
cluster formation in concentrated protein solutions and
colloids. Nature 432, 492–495.
5 Yon JM (1996) The specificity of protein aggregation.
Nat Biotechnol 14, 1231.
6 Chiti F & Dobson CM (2006) Protein misfolding, func-
tional amyloid, and human disease. Annu Rev Biochem
75, 333–366.
7 Gazit E (2002) A possible role for p-stacking in the self-
assembly of amyloid fibrils. FASEB J 16, 77–83.
8 Chapman MR, Robinson LS, Pinkner JS, Roth R,
Heuser J, Hammar M, Normark S & Hultgren SJ
(2002) Role of Escherichia coli curli operons in directing
amyloid fiber formation. Science 295, 851–855.
9 Sanguansri P & Augustin MA (2006) Nanoscale materi-
als development – a food industry perspective. Trends
Food Sci Technol 17, 547–556.
10 Zhang S, Marini DM, Hwang W & Santoso S (2002)
Design of nanostructured biological materials through
self-assembly of peptides and proteins. Curr Opin Chem
Biol 6, 865–871.
11 Zhang S (2003) Fabrication of novel biomaterials
through molecular self-assembly. Nat Biotechnol 21,
1171–1178.
12 Jahn TR & Radford SE (2007) Folding versus aggrega-
tion: Polypeptide conformations on competing path-
ways. Arch Biochem Biophys, doi:10.1016 ⁄ j.abb.2007.05.
015.
13 Kelly JW (1998) The alternative conformations of amy-
loidogenic proteins and their multi-step assembly path-
ways. Curr Opin Struct Biol 8, 101–106.
14 Bolder SG, Hendrickx H, Sagis LMC & van der Linden
E (2006) Fibril assemblies in aqueous whey protein
mixtures. J Agric Food Chem 54, 4229–4234.
15 Bromley EHC, Krebs MRH & Donald AM (2005)
Aggregation across the length-scales in b-lactoglobulin.
Faraday Discuss 128, 13–27.
16 Krebs MRH, Wilkins DK, Chung EW, Pitkeathly MC,
Chamberlain AK, Zurdo J, Robinson CV & Dobson
CM (2000) Formation and seeding of amyloid fibrils
from wild-type hen lysozyme and a peptide fragment
from the b-domain. J Mol Biol 300, 541–549.
17 Krebs MRH, Bromley EHC, Rogers SS & Donald AM
(2005) The mechanism of amyloid spherulite formation
by bovine insulin. Biophys J 88, 2013–2021.
18 Krebs MRH, Devlin GL & Donald AM (2007) Protein
particulates: another generic form of protein aggrega-
tion? Biophys J 92, 1336–1342.
19 Padilla JE, Colovos C & Yeates TO (2001) Nanohedra:
using symmetry to design self assembling protein cages,
layers, crystals, and filaments. Proc Natl Acad Sci USA
98, 2217–2221.
20 Biesheuvel PM, Lindhoud S, de Vries R & Cohen Stuart
MA (2006) Phase behavior of mixtures of oppositely
charged nanoparticles: heterogeneous Poisson–Boltz-
mann cell model applied to lysozyme and succinylated
lysozyme. Langmuir 22, 1291–1300.
21 Greene LH, Grobler JA, Malinovskii VA, Tian J,
Acharya KR & Brew K (1999) Stability, activity and
flexibility in a-lactalbumin. Protein Eng 12, 581–587.
22 Iyer LK & Qasba PK (1999) Molecular dynamics simu-
lation of a-lactalbumin and calcium binding c-type lyso-
zyme. Protein Eng 12, 129–139.
23 Qasba PK & Kumar S (1997) Molecular divergence of
lysozymes and a-lactalbumin. Crit Rev Biochem Mol 32,
255–306.
24 Lamprecht A, Schafer UF & Lehr C-M (2000) Charac-
terization of microcapsules by confocal laser scanning
microscopy: structure, capsule wall composition and
encapsulation rate. Eur J Pharm Biopharm 49, 1–9.
25 Hallworth R, Currall B, Nichols MG, Wu X & Zuo J
(2006) Studying inner ear protein–protein interactions
using FRET and FLIM. Brain Res 1091, 122–131.
26 Clarke AW, Arnspang EC, Mithieux SM, Korkmaz E,
Braet F & Weiss AS (2006) Tropoelastin massively
Properties of assembled a-lactalbumin and lysozyme M. Nigen et al.
6092 FEBS Journal 274 (2007) 6085–6093 ª 2007 The Authors Journal compilation ª 2007 FEBS
associates during coacervation to form quantized pro-
tein spheres. Biochemistry 45, 9989–9996.
27 Burgess DJ (1990) Practical analysis of complex
coacervate systems. J Colloid Interface Sci 140, 227–
238.
28 Ibrahim HR, Taniyama N & Aoki T (2004) Distinct
dimerization between a-lactalbumin and lysozyme
exhibiting novel antimicrobial activity against Gram-
positive and Gram-negative bacteria. Lett Drug Des
Discov 1, 101–109.
29 Dima RI & Thirumalai D (2002) Exploring protein
aggregation and self-propagation using lattice models:
phase diagram and kinetics. Protein Sci 11, 1036–1049.
30 Griko YV & Remeta DP (1999) Energetics of solvent
and ligand-induced conformational changes in a-lactal-
bumin. Protein Sci 8, 554–561.
31 Caussin F, Famelart MH, Maubois JL & Bouhallab S
(2003) Mineral modulation of thermal aggregation and
gelation of whey proteins: from b-lactoglobulin model
system to whey protein isolate. Lait 83, 353–364.
M. Nigen et al. Properties of assembled a-lactalbumin and lysozyme
FEBS Journal 274 (2007) 6085–6093 ª 2007 The Authors Journal compilation ª 2007 FEBS 6093