Báo cáo khoa học: Lithium increases PGC-1a expression and mitochondrial biogenesis in primary bovine aortic endothelial cells ppt
Bạn đang xem bản rút gọn của tài liệu. Xem và tải ngay bản đầy đủ của tài liệu tại đây (856.74 KB, 17 trang )
Lithium increases PGC-1a expression and mitochondrial
biogenesis in primary bovine aortic endothelial cells
Ian T. Struewing, Corey D. Barnett, Tao Tang and Catherine D. Mao
Graduate Center for Nutritional Sciences, University of Kentucky, Lexington, USA
Lithium is commonly used as a therapeutic agent in
the treatment of bipolar disorder (or maniac depres-
sion) [1], and as a mimic of Wnt signaling both in vivo
and in vitro [2]. The beneficial effects of lithium in
the treatment of bipolar disorder are thought to be
due to a combination of activation of the Wnt ⁄ b-catenin
signaling pathway, via inhibition of the glycogen syn-
thase kinase-3b (GSK3b) [3], and depletion of the
intracellular inositol pool via the inhibition of various
enzymes in the phosphoinositide pathways, for example,
the rate-limiting enzyme inositol monophospha-
tase 1 (IMPase-1) [4,5]. In addition, evidence suggests
that lithium is neuroprotective and is beneficial in the
treatment of ischemia–reperfusion injuries and neuro-
degenerative diseases, including Alzheimer’s, Parkin-
son’s and Huntington’s disease [6]. For Huntington’s
disease, it has been proposed that lithium increases
the degradation of aggregated Hungtintin-mutated
Keywords
cell signaling; CREB; FOXO; gene
expression; mitochondria
Correspondence
C. D. Mao, Graduate Center for Nutritional
Sciences, University of Kentucky, 900
Limestone Street, Lexington, KY 40536,
USA
Fax: +1 859 257 3646
Tel: +1 859 323 4933, Ext. 81377
E-mail:
(Received 14 January 2007, revised 13
March 2007, accepted 23 March 2007)
doi:10.1111/j.1742-4658.2007.05809.x
Lithium is a therapeutic agent commonly used to treat bipolar disorder
and its beneficial effects are thought to be due to a combination of activa-
tion of the Wnt ⁄ b-catenin pathway via inhibition of glycogen synthase kin-
ase-3b and depletion of the inositol pool via inhibition of the inositol
monophosphatase-1. We demonstrated that lithium in primary endothelial
cells induced an increase in mitochondrial mass leading to an increase in
ATP production without any significant change in mitochondrial efficiency.
This increase in mitochondrial mass was associated with an increase in the
mRNA levels of mitochondrial biogenesis transcription factors: nuclear res-
piratory factor-1 and -2b, as well as mitochondrial transcription factors A
and B2, which lead to the coordinated upregulation of oxidative phos-
phorylation components encoded by either the nuclear or mitochondrial
genome. These effects of lithium on mitochondrial biogenesis were inde-
pendent of the inhibition of glycogen synthase kinase-3b and independent
of inositol depletion. Also, expression of the coactivator PGC-1a was
increased, whereas expression of the coactivator PRC was not affected.
Lithium treatment rapidly induced a decrease in activating Akt-Ser473
phosphorylation and inhibitory Forkhead box class O (FOXO1)-Thr24
phosphorylation, as well as an increase in activating c-AMP responsive ele-
ment binding (CREB)-Ser133 phosphorylation, two mechanisms known to
control PGC-1a expression. Together, our results show that lithium induces
mitochondrial biogenesis via CREB ⁄ PGC-1a and FOXO1 ⁄ PGC-1a cas-
cades, which highlight the pleiotropic effects of lithium and reveal also
novel beneficial effects via preservation of mitochondrial functions.
Abbreviations
BAEC, bovine aortic endothelial cell; COX, cytochrome c oxidase; CREB, c-AMP responsive element binding; DCF, 2¢-7¢-dichlorofluorescein;
FOXO, Forkhead box class O; GSK3, glycogen synthase kinase; IMP, inositol monophosphatase; LPS, lipopolysaccharide; MTP, mitochondria
transmembrane potential; NRF, nuclear respiratory factor; OXPHOS, oxidative phosphorylation; PGC, peroxisome proliferators-activated
receptor-gamma coactivator; PRC, PGC-1a-related coactivator; TFAM, transcription factor A mitochondria; TFB, transcription factor B; UCP,
uncoupling protein.
FEBS Journal 274 (2007) 2749–2765 ª 2007 The Authors Journal compilation ª 2007 FEBS 2749
proteins via autophagy in an IMPase-1-dependent manner
[7]. By contrast, the preconditioning and protective
effects of lithium in brain and heart ischemia–reper-
fusion injury models appear to depend upon the inhi-
bition of GSK3b [8,9]. Although much attention has
been paid to the inhibitory effects of lithium on
GSK3b and IMPase-1 activity, lithium acts as a com-
petitive inhibitor of numerous Mg
2+
-dependent fac-
tors, transporters and enzymes, including a key
glycolytic enzyme, phosphoglucomutase [10]. Such a
wide spectrum of potential targets is consistent with
the narrow range of lithium doses that can be used
therapeutically in the absence of toxicity and with lim-
ited side effects [1].
GSK3b plays a pivotal role in the canonical Wnt ⁄
b-catenin signaling pathway by phosphorylating and
targeting b-catenin to the proteasomal degradation
pathway in the absence of Wnt signals. In the presence
of Wnt signals, GSK3b becomes phosphorylated on
Ser9 and is inactivated, allowing the cytosolic stabilization
and nuclear translocation of b-catenin. In the nucleus,
b-catenin interacts with the TCF ⁄ LEF transcription
factors and activates the transcription of genes involved
in cell proliferation and adhesion [11]. Lithium, via
inhibition of GSK3b, increases b-catenin ⁄ TCF tran-
scriptional activity and induces proliferation in various
tumor cell lines [2,12]. By contrast, lithium did not
induce proliferation or activation of the transcriptional
activity of b-catenin ⁄ TCF complexes in primary bovine
aortic endothelial cells (BAEC), but rather induced
G
2
⁄ M cell-cycle arrest leading to a cell senescence-like
phenotype [13]. In these cells, lithium treatment activa-
ted the tumor suppressor p53 resulting in increased
expression of the cyclin-dependent kinase inhibitor
p21
cip
at both the mRNA and protein levels; this was
found to be independent of depletion of the intracellu-
lar inositol pool [13]. Similarly, an increase in p21
cip
protein stability was also seen in human endothelial
cells in response to lithium and this was shown to be
dependent upon inhibition of GSK3b [14]. The antipro-
liferative effects of lithium have also been seen in other
primary cells, including human umbilical vein endothel-
ial cells [15], vascular smooth muscle cells [13], lens epi-
thelial cells [16], and some tumor cell lines such as B16
melanoma [17] and P19 embryonal carcinoma cells [18].
Both GSK3b and p53 have been shown to localize
to mitochondria. GSK3b was localized to the mito-
chondria of cerebellar cells [19] and enrichment of act-
ive GSK3b in mitochondria and nuclei has also been
observed in neuronal cells [20]. In the immortalized
neuronal cell line SH-SY5Y, mitochondrial and active
GSK3b was shown to interact with p53 and thereby
promote the pro-apoptotic activities of p53 [21].
By contrast, activation ⁄ inhibition of GSK3b was
shown to control glycolysis–oxidative phosphorylation
(OXPHOS) coupling and apoptosis in HeLa tumor
cells via the release ⁄ binding of hexokinase II from the
mitochondria outer membrane [22]. However, these
effects appear to be cell-type dependent, because lithium
had the opposite effect in B16 melanoma cells in
association with a cell-cycle arrest [17]. Recently, a
novel p53 target has been identified, synthesis of cyto-
chrome oxidase 2 (SCO2), which is responsible for bio-
genesis of the cytochrome oxidase complex in the inner
mitochondrial membrane and thus links the tumor
suppressor p53 with the control of energy metabolism
and glycolysis switching in tumor cells [23]. Although
lithium has been shown to affect glycolysis via direct
inhibition of phosphoglucomutase [10], its effects on
mitochondrial energy metabolism and biogenesis have
not been addressed.
Mitochondrial biogenesis is highly orchestrated, and
involves signal cross-talk between the nucleus and
mitochondria leading to the coordinated regulation of
gene expression [24,25]. The mitochondrial genome
encodes only 13 OXPHOS components; the other
OXPHOX components and all the factors required for
assembly of the OXPHOX complexes and for replica-
tion and transcription of the mitochondrial genome are
encoded by the nuclear genome. The nuclear transcrip-
tion factors, nuclear respiratory factor (NRF)-1 and -2,
in conjunction with the coactivators peroxisome prolif-
erators activated receptor-c coactivator (PGC)-1a and
PGC-1a-related coactivator (PRC), control the expres-
sion of nuclear-encoded OXPHOX genes and transcrip-
tion factor A mitochondria (TFAM), transcription
factor B (TFB)-1 and TFB-2. These mitochondrial
transcription factors in turn control transcription and
replication of the mitochondrial genome [25].
Under physiological conditions, changes in mitoch-
ondrial biogenesis and mass within cells and tissues
reflect changes in energy demand and hormonal status,
and depend mainly on changes in the activity and ⁄ or
expression of the transcription factors NRF1 and
NRF2 and coactivator PGC-1a [25,26]. By contrast,
under pathological conditions, such as oxidative stress
[27], an increase in mitochondrial biogenesis can occur
as a compensatory mechanism in response to mito-
chondrial dysfunction and damage, however, ATP pro-
duction is usually impaired. Mitochondrial dysfunction
or loss is a common characteristic of many neuro-
degenerative diseases such as Alzheimer’s and Parkin-
son’s [28], and has also been seen in postmortem brain
biopsies from subjects with bipolar disorder [29].
Mutated huntingtin protein, responsible for the devel-
opment of Huntington’s disease, was shown to cause
Lithium increases mitochondrial biogenesis I. T. Struewing et al.
2750 FEBS Journal 274 (2007) 2749–2765 ª 2007 The Authors Journal compilation ª 2007 FEBS
mitochondrial dysfunction by interfering with cAMP-
responsive element binding (CREB) transcription fac-
tor-dependent regulation of PGC-1a expression [30].
Inversely, increasing the expression of PGC-1a was
shown to be neuroprotective in the mutated-hungtintin
transgenic mouse model of Huntington disease [30].
Interestingly, the preconditioning effects of various
substances and factors in brain, heart and vessel
ischemic–reperfusion injuries also seem to be mediated
in part by an increase in mitochondrial biogenesis and
preservation of mitochondrial function [31,32]. The
protective effects of lithium, both during precondition-
ing in heart and brain ischemic–reperfusion injury
models [8,9], and in neurodegenerative disease models
[6], have been studied only in relation to the apoptotic
function of mitochondria, and not their energy homeo-
static function.
In this study, we show that lithium increases mitoch-
ondrial biogenesis in BAEC leading to an increase in
ATP production. Unexpectedly, this novel effect of
lithium was independent of the inhibition of GSK3b
and of inositol depletion. Moreover, our results reveal
that lithium treatment affects two cascades known to
converge to the upregulation of PGC-1a expression by
CREB and Forkhead box class O (FOXO1) trans-
cription factors and hence to increase mitochondrial
biogenesis.
Results
Lithium increases mitochondrial mass in BAEC
BAEC were treated with 10 mm lithium, a dose com-
monly used to achieve GSK3b inhibition and activa-
tion of Wnt ⁄ b-catenin signaling [33], and the levels of
ATP were measured using a standard luminescent
luciferin ⁄ luciferase assay. Lithium treatment resulted in
a significant 1.4 ± 0.1- and 1.49 ± 0.2-fold increase in
ATP production at 24 and 36 h, respectively
(P<0.01), whereas treatment with 1 mm valproate,
another mood stabilizer [33], had a weaker effect, with
a 1.23 ± 0.1-fold increase at both 24 and 36 h of
0
0.25
0.5
0.75
1
1.25
1.5
1.75
2
24h 36h
Na Li VPA
slevelPTAfoesaercnidloF
*
*
*
A
*
0
0.5
1
1.5
2
10 mM
Na
5 m
M
Li
10 m
M
Li
1 m
M
VPA
airdnohcotiMehtfoslevelevitaleR
laitnetoPenarbmemsnarT
B
)UA(ssaMa
ird
nohcot
iMevitaleR
AND-uNsusrevAN
D-tiM
12S/TFAM Cytb/ATPbeta
CR/RRS1
0
0.25
0.5
0.75
1
1.25
1.5
1.75
Na Li VPA
*
*
*
C
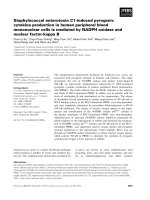
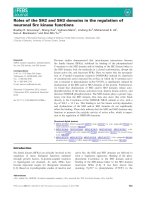
Fig. 1. Lithium increases mitochondrial mass in BAEC. (A) Lithium
increases ATP production. BAEC were plated 8 h prior to treatment
with either 10 m
M NaCl (Na), 10 mM LiCl (Li) or 1 mM Na-valproate
(VPA) for 24 or 36 h. After cell lysis, levels of ATP per lg of protein
were determined as described in Experimental procedures. The
graph represents mean ± SEM of the fold increase in treated ver-
sus control NaCl-treated cells obtained in 6–8 independent experi-
ments performed in duplicate. (B) Lithium increases the
mitochondria membrane potential. BAEC were treated with the
indicated doses of NaCl, LiCl or VPA for 36 h prior to staining with
500 n
M of Mitotracker-CMXRos for 45 min. The accumulation of
Mitotracker-CMXRos in active mitochondria was determined by
measuring the fluorescence intensity at k
exc550
⁄ k
em590
and the cell
number was quantified subsequently using CyQuant staining and
measurement of the fluorescence intensity at k
exc485
⁄ k
em535
. The
MTP levels were corrected for the variation in cell number and the
results are expressed as relative levels with the control NaCl-trea-
ted cells equal to 1. The graph represents mean ± SEM obtained in
eight independent experiments preformed in triplicate. (C) Lithium
increases mitochondrial mass in BAEC. BAEC were treated with
10 m
M NaCl (Na), 10 mM LiCl (Li) or 1 mM valproate (VPA) for 36 h
prior to isolation of total DNA. Levels of mitochondrial DNA and lev-
els of nuclear DNA were quantified by real-time PCR with specific
bovine primers for the mitochondrial encoded genes, cytochrome b
(cyt-b) and 12S rRNA, as well as for the mitochondria genome
control region (CR) and for the nuclear encoded genes: TFAM,
ribosome biogenesis regulator-1 (RRS1) and ATP synthase-b
(ATP-beta). The ratio of mitochondrial DNA to nuclear DNA was
determined for each treatment and for each of the pair of
MitDNA ⁄ NuDNA: 12S ⁄ TFAM, Cytb ⁄ ATPb and CR ⁄ RRS1. Results
are expressed in relative levels with the control NaCl equal to 1.
Mean ± SEM obtained from 3–4 independent experiments are
reported in the graph. In all cases, after Student’s t-test analysis,
the results were considered significant at P < 0.05 (*).
I. T. Struewing et al. Lithium increases mitochondrial biogenesis
FEBS Journal 274 (2007) 2749–2765 ª 2007 The Authors Journal compilation ª 2007 FEBS 2751
treatment (P<0.05) (Fig. 1A). Because lithium was
shown to inhibit various enzymes of the glycolytic and
tricarboxylic acid pathways and to decrease ATP pro-
duction via glycolysis [17,34], we first tested whether
lithium increases ATP production via changes in mito-
chondrial activity and ⁄ or mass in BAEC. The mito-
chondria transmembrane potential (MTP) is a marker
of mitochondrial OXPHOS activity that can be
assessed using fluorescent probes accumulating in
mitochondria depending on the MTP such as Mito-
tracker-CMXRos [35]. In this study, the fluorescent
probes, nonyl acridine orange and Mitotracker-Green,
usually used for mitochondria staining independent of
MTP, were also sensitive to the uncoupler carbonyl
cyanide 3-chlorophenylhydrazone (not shown) and
thus were not used to directly determine mitochondrial
mass per cell. Also, we have previously shown that
BAEC treated with lithium were arrested in the G
2
⁄ M
phase and displayed a reduced cell number compared
with sodium-treated cells [13]. Therefore, cell number
was determined using CYQUANT staining and fluor-
escence quantification, and MTP levels were corrected
by the cell number. The increase in ATP production
induced by lithium was associated with a significant,
1.33 ± 0.05-fold, increase in the relative MTP levels
per cell in BAEC treated for 36 h (P<0.05), whereas
valproate had no significant effect (Fig. 1B). Because
an increase in MTP can reflect either an increase in
mitochondrial mass or an increase in the efficiency of
mitochondrial OXPHOS, we determined the effects of
lithium on mitochondrial mass using a real-time PCR-
based assay. Relative levels of mitochondrial DNA
versus nuclear DNA were determined using three dif-
ferent genes encoded by the mitochondrial genome and
three encoded by the nuclear genome to avoid bias of
differential efficiency of amplification between primer
sets. As shown in Fig. 1C, lithium treatment increased
significantly the relative levels of mitochondrial DNA,
about 1.35 ± 0.14, 1.4 ± 0.07 and 1.49 ± 0.07-fold
for 12S ⁄ TFAM, cytochrome b ⁄ ATP synthase-b and
CR ⁄ RRS1 MitDNA ⁄ NuDNA pairs, respectively, which
indicated an increase of the mitochondrial mass,
whereas VPA had no significant effect. Taken together,
these results show that lithium treatment in BAEC
increases mitochondrial mass significantly, leading to
an increase in ATP production without changes in mit-
ochondrial efficiency. This lithium-induced increase in
mitochondrial mass was not accompanied by any signi-
ficant changes in mitochondrial morphology or distri-
bution, as shown by immunofluorescence microscopy
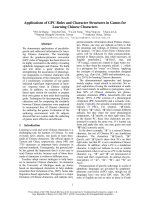
of BAEC stained with Mitotracker-Deep Red (Fig. 2).
Mitochondria in lithium-treated BAEC were found
around the nucleus and protrusion, as in control cells,
repeated treatments with 50 lm of the NO donor,
DETA-NO, a known inducer of mitochondrial biogen-
esis [36], also increased the mitochondrial mass but the
mitochondria were mainly perinuclear (Fig. 2).
Lithium increases mitochondrial biogenesis
markers
To determine whether the increase in mitochondrial
mass was due to an increase in mitochondrial bio-
genesis, the mRNA levels of various OXPHOS compo-
nents encoded by either the nuclear genome or the
mitochondrial genome were assessed using real-time
RT-PCR. As shown in Fig. 3, after 24 or 36 h treat-
ment of BAEC with lithium, the mRNA levels of
mitochondrial-encoded genes such as cytochrome oxid-
ase II (1.65 ± 0.07-fold, complex IV), ATP synthase
subunit-6 (2.5 ± 0.32-fold, complex V), and cyto-
chrome b (3.4 ± 0.4-fold, complex III) were increased
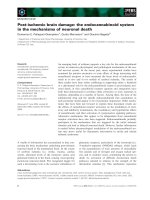
lCaNlCiLON-ATED lCaNlCiLON-ATED
Fig. 2. Lithium does not affect mitochondrial distribution in BAEC.
BAEC were grown on glass chamber slides and treated with
10 m
M NaCl, 10 mM LiCl or the NO donor DETA-NO for 72 h prior
to addition of 100 n
M Mitotracker-Deep Red633 for 45 min at
37 °C. After removal of the staining solution, fresh medium was
added for 10 min incubation prior to cell fixation in 3.7% formalde-
hyde and slide mounting. Immunofluorescence confocal images of
several fields (n ¼ 10) were taken and representative images are
shown (scale bars: 20 lm).
Lithium increases mitochondrial biogenesis I. T. Struewing et al.
2752 FEBS Journal 274 (2007) 2749–2765 ª 2007 The Authors Journal compilation ª 2007 FEBS
significantly, however, no significant difference was
observed between the two treatment times. Similarly,
36 h lithium treatment led to a significant increase in
the RNA levels of nuclear-encoded genes such as cyto-
chrome oxidase VIc and VIa by 1.85 ± 0.08 and
1.56 ± 0.1-fold, respectively (complex IV), and ATP-
synthase subunit-b by 2.66 ± 0.57-fold (complex V),
whereas the mRNA levels of cytochrome c and mito-
chondria DNA polymerase were increased slightly, by
1.3 ± 0.04 and 1.33 ± 0.1-fold, respectively, with-
out reaching statistical significance (Fig. 3). Levels of
uncoupling protein 2 (UCP2) mRNA were also signifi-
cantly increased after 36 h lithium treatment
1.4 ± 0.1 fold, which was similar to the increase
observed for the mitochondrial biogenesis markers.
This coordinated increase in mRNA levels for the mit-
ochondrial biogenesis markers and UCP2 is in agree-
ment with the unaffected OXPHOS efficiency observed
after lithium treatment (Fig. 1). To confirm that the
increase in mRNA was accompanied by an increase in
protein levels, we assessed the expression of the ATP
synthase-b protein by immunoblotting. A significant,
1.7 ± 0.3-fold, increase in ATP synthase-b was
observed after lithium treatment, although valproate
had no effect (Fig. 3C). Our results show that lithium
increased the expression of mitochondrial biogenesis
markers in a coordinated fashion, although the effects
of lithium on mRNA levels for mitochondrial-encoded
genes are stronger than the effects on the expression of
nuclear-encoded genes. This may be due to an increase
in mitochondrial mass (Fig. 1) and ⁄ or a greater
increase in the expression of mitochondrial transcrip-
tion factors.
Lithium increases mRNA levels for transcription
factors involved in mitochondrial biogenesis
Expression of OXPHOS genes encoded by the mito-
chondrial genome is under the control of specific tran-
scription factors: TFAM, TFB1 and TFB2, whose
expression, as well as expression of the nuclear-enco-
ded OXPHOS genes, is mainly under the control of
the NRF1 and NRF2 transcription factors [25].
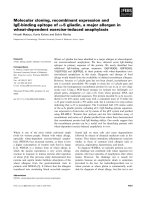
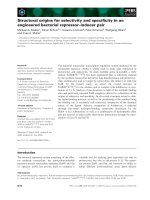
Fig. 3. Lithium increases the mRNA levels of oxidative phosphoryla-
tion components. BAEC were treated with either 10 m
M NaCl or
10 m
M LiCl for the indicated times prior to RNA extraction, and the
levels of target mRNAs were quantified using real-time PCR as
described in Experimental procedures. Levels of target mRNAs
were corrected for variation of the mRNA levels with the internal
control rpL30 and for each target gene the ratio of the corrected
level obtained in LiCl-treated versus NaCl-treated cells was deter-
mined. The fold induction of the target mRNA is reported in the
graph in (A) for OXPHOS genes encoded by the mitochondrial gen-
ome: cytochrome oxidase subunit II (COX-II), ATP synthase-6 and
cytochrome b (cyt-b), and in the graph in (B) for OXPHOS genes
encoded by the nuclear genome: ATP synthase-b, cytochrome oxid-
ase subunits VIa and VIc (COX VIa and VIc), cytochrome c (cyt-c)
and mitochondria DNA polymerase (MitDNA polymerase). Mean ±
SEM values obtained from 3–5 independent experiments are repor-
ted in the graphs and the results were considered significant at
P < 0.05 (*) (Student’s t-test). (C) Lithium increases the level of
ATP synthase-b protein. BAEC were treated for 36 h with 10 m
M
NaCl, 10 mM LiCl or 1 mM VPA prior to cell lysis and western blot
analysis of the levels of ATP synthase-b and the loading control
a-tubulin. The intensity of the protein bands was evaluated by den-
sitometry and the ratio of ATP synthase-b intensity to a-tubulin
intensity was determined for each treatment. A representative
experiment is shown and the mean ± SEM results obtained from
seven independent experiments are reported in the graph. Results
were considered significant at P < 0.05 (*) (Student’s t-test).
A
0
1
2
3
4
5
**
Fold increase of mRNA levels
of nuclear enclosed genes
Fold increase of mRNA levels of
mitochondrial enclosed genes
*
Na Li VPA
0
0.25
0.5
0.75
1
1.25
1.5
1.75
2
*
Na Li VPA
120.96
Ratio
α
-Tubulin
ATP
synthase-
β
C
0
1
2
3
4
5
COX-II
ATP
synthase-6
cyt-b
24h
0
1
2
3
4
5
36h
*
*
*
*
*
B
β
ATP
synthase
−
β
COX-VIc COX-VIa cyt-c
Mit-DNA
polymerase
0
1
2
3
4
5
24h 36h
*
**
*
*
*
I. T. Struewing et al. Lithium increases mitochondrial biogenesis
FEBS Journal 274 (2007) 2749–2765 ª 2007 The Authors Journal compilation ª 2007 FEBS 2753
c-Myc, a b-catenin target gene [37], has also been
shown to increase the levels and activity of TFAM
[38]. Therefore, we tested the mRNA levels of all these
transcription factors in response to lithium. A signifi-
cant increase in mRNA levels for TFAM and TFB2
was seen after 24 h lithium treatment, 2.2 ± 0.5-
and 1.7 ± 0.2-fold, respectively, and these effects
were even more pronounced at 36 h with a 4.4 ± 1.1-
and 4.1 ± 1-fold increase, respectively (Fig. 4A).
Among the nuclear transcription factors, only NRF2b
mRNA levels were increased significantly at 24 h, by
1.6 ± 0.14-fold (Fig. 4A). After 36 h lithium treatm ent,
NRF2b mRNA levels were further increased by
3.3 ± 0.5-fold, whereas mRNA levels of NRF1 and
c-myc were increased only approximately twofold.
Thus, the increased expression of the mitochondrial
markers observed at 24 h (Fig. 2) was mainly associ-
ated with increased expression of TFAM and TFB2,
as well as of NRF2b.
Redox-dependent activation of NRF1 and NRF2 is
known to mediate the increase in expression of the
mitochondrial biogenesis transcription factors observed
in response to various oxidative stresses such as
lipopolysacharride (LPS) treatment [27]. Therefore, we
assessed the effects of short lithium treatments on
intracellular levels of H
2
O
2
using a 5- (and 6)-chloro-
methyl-2¢-7¢-dichlorodihydrofluorescein diacetate (CM-
H
2
DCFDA) probe, which is deacetylated by cellular
esterase and oxidized in the presence of H
2
O
2
to give a
fluorescent 2¢-7¢-dichlorofluorescein (DCF) compound.
Treatment of BAEC with 10 mm lithium for between
30 min and 2 h had no significant effect on intra-
cellular H
2
O
2
levels, whereas treatment with 1 lm LPS
resulted in a small but significant increase after 2 h
treatment ( 1.36 ± 0.1-fold; Fig. 4B). Longer lithium
treatments resulted in a decrease in peroxide produc-
tion (not shown). Therefore, lithium-induced mito-
chondrial biogenesis was not due to a compensatory
mechanism following mitochondrial damage induced
by an increase in oxidative stress.
Lithium effects on mitochondrial biogenesis are
partially dependent on inositol depletion
Lithium is a competitive inhibitor of various enzymes
of the inositol pathway including the limiting enzyme
IMPase-1, resulting in a marked depletion of the intra-
cellular inositol pool that can be restored by the addi-
tion of myo-inositol [5]. We tested whether lithium was
able to increase the expression of mitochondrial bio-
genesis markers after pretreatment with 1 mm myo-
inositol. As shown in Fig. 5A, addition of 1 mm
myo-inositol attenuated the effects of lithium with a
20–25% decrease in mRNA levels for TFAM, cyto-
chrome b and ATP synthase-6, although it did not sig-
nificantly affect these levels in NaCl-treated cells.
However, the changes between LiCl + myo-inositol-
treated cells and LiCl-treated cells were not statistically
significant using one-way anova. To further assess the
involvement of inositol depletion in lithium-induced
mitochondrial biogenesis, lithium-dependent changes
in mitochondrial mass were monitored in the absence
or presence of 1 mm myo-inositol pretreatment. As
shown in Fig. 5B, myo-inositol pretreatment did not
slevelANRmtegratfoesaercnidloF
CEABdetaertlCaNsvlCiLni
TFAM TFB2 NRF-1 NRF-2β
β
c-myc
0
1
2
3
4
5
6
24h 36h
*
*
*
*
*
*
*
*
A
s
0
0.2
0.4
0.6
0.8
1
1.2
1.4
1.6
30 min 2h
NaCl LiCl LPS
leveledixorepnegordyhfoeg
n
a
h
cd
l
oF
*
*
B
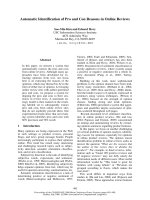
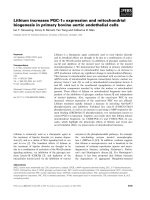
Fig. 4. Lithium increases the mRNA levels of transcription factors
involved in the control of mitochondrial biogenesis in the absence
of oxidative stress. (A) Lithium increases the mRNA levels of
mitochondrial biogenesis transcription factors. BAEC were treated
for the indicated times with either 10 m
M NaCl as a control or
10 m
M LiCl prior to RNA extraction, and the levels of target mRNAs
were quantified using real-time RT-PCR. The graph represents
mean ± SEM results obtained from five independent experiments.
(B) Lithium does not induce oxidative stress in BAEC. Equal num-
bers of BAEC were treated for the indicated times with 10 m
M
NaCl as control, 10 mM LiCl or 1 lM LPS as positive control for
oxidative stress prior to staining with 2.5 l
M CM-H
2
DCFDA for
30 min in the dark. The fluorescence intensities were measured at
k
exc485
⁄ k
em535
. Mean ± SEM results obtained from 4–6 independ-
ent experiments performed in triplicate are reported in the graphs.
Results were considered significant at P < 0.05 (*) (Student’s
t-test).
Lithium increases mitochondrial biogenesis I. T. Struewing et al.
2754 FEBS Journal 274 (2007) 2749–2765 ª 2007 The Authors Journal compilation ª 2007 FEBS
affect the lithium-dependent increase of mitochondrial
mass as determined by the ratio of MitDNA ⁄ NuDNA.
These results indicated that myo-inositol pretreatment
did not prevent lithium-induced mitochondrial bio-
genesis.
Lithium effects on mitochondrial biogenesis are
independent of GSK3b inhibition
Active GSK3b has been shown to be localized in mito-
chondria [20], we also examined whether the effects of
lithium on the expression of mitochondrial biogenesis
markers were dependent upon GSK3b inhibition by
comparing the effects of two other unrelated inhibitors
of GSK3b, valproate and indirubin-3¢-monoxime. Val-
proate has been shown to indirectly inhibit GSK3b
[39], although its activation of the Wnt ⁄ b-catenin sign-
aling pathway in various cells appears to depend
mainly on histone deacetylases 2 inhibition [40].
Among these various inhibitors, only lithium treatment
led to a significant increase in the mRNA l evels of mito-
chondrial-encoded genes, ATP synthase-6 and cyto-
chrome b, nuclear-encoded genes, ATP synthase-b,
cytochrome oxidase VIc and TFAM (Fig. 6A). By
contrast, indirubin had no effect, whereas valproate
increased, 1.5-fold, mRNA levels for the nuclear-
encoded genes cytochrome oxidase VIc and TFAM
(Fig. 6A). These results were in agreement with a weak
or lack of effect of valproate on ATP production and
mitochondrial mass, respectively (Fig. 1). To further
rule out a role for GSK3b in the lithium-dependent
increase in mitochondrial biogenesis markers, BAEC
were transfected with wild-type GSK3b, constitutive
active S9A-GSK3b and the inactive kinase-dead
K85A-GSK3b for 36 h prior to the analysis of mito-
chondrial and nuclear gene expression. If the effects of
lithium on mitochondrial biogenesis were dependent
on GSK3b inhibition, expression of the catalytic
inactive K86R-GSK3b form should also increase
expression of the mitochondrial biogenesis markers.
However, mRNA levels of the nuclear genes ATP syn-
thase-b, cytochrome oxidase VIc and TFAM, and of
the mitochondrial genes ATP synthase-6 and cyto-
chrome b, were not significantly affected by expression
of any forms of GSK3b including the inactive K86R-
GSK3b form (Fig. 6B). By contrast, levels of interleu-
kin-8 mRNA were increased 3.6 ± 1.3 fold in
response to expression of the inactive K85-GSK3b,as
expected for a target gene of GSK3b inhibition [41].
Our results with the various inhibitors of GSK3b and
expression of the inactive form of GSK3b indicate that
the lithium-induced increase of mitochondrial biogen-
esis is independent of GSK3b inhibition.
Lithium increases cell size in the absence of Akt
activation
Of the various inhibitors used in this study, only lith-
ium led to a significant increase in cell size and spread-
ing in BAEC (Fig. 7A), as well as cell-cycle arrest [13].
Although activation of the Akt pathway via Akt phos-
phorylation on Ser473 and Akt-dependent inactivation
of GSK3b by phosphorylation on Ser9 have been
implicated in skeletal and cardiac hypertrophy [42,43],
lithium treatment was associated with a decrease in
slevel ANRm tegrat fo esaercni dloF
CEAB detaertlCaN lortnoc susrev detaert ni
ATP
synthase−
−
β
COX-VIccyt-b
TFAM
ATP
synthase-6
0
1
2
3
4
5
6
Na Na + myo-inositol Li Li + myo-inositol
*
*
*
*
*
*
*
*
A
0
0.25
0.5
0.75
1
1.25
1.5
1.75
lairdnohcotim fo slevel evitaleR
AND raelcunsv AND
NaCl LiCl
LiCl +
myo-inositol
NaCl +
myo-inositol
B
Fig. 5. Maintenance of the inositol pool had minimal effects on lith-
ium-induced mitochondrial biogenesis. After pretreatment with
1m
M myo-inositol to maintain the intracellular inositol pool, BAEC
were treated for 36 h with either 10 m
M NaCl or 10 mM LiCl prior
to either RNA extraction (A) or DNA isolation (B). (A) mRNA levels
of the indicated genes were determined using real-time PCR.
Mean ± SEM results obtained from six independent experiments
are reported in the graphs. Results were considered significant at
P < 0.05 (*) (one-way ANOVA followed by posthoc Bonferroni’s
test). (B) Mitochondrial mass was determined from the ratio
mitochondrial DNA ⁄ nuclear DNA using real-time PCR as described
in Experimental procedures. Mean ± SEM results obtained from
three independent experiments are reported in the graph. Results
were considered significant at P < 0.05 (*) (Student’s t-test).
I. T. Struewing et al. Lithium increases mitochondrial biogenesis
FEBS Journal 274 (2007) 2749–2765 ª 2007 The Authors Journal compilation ª 2007 FEBS 2755
Akt-S473 phosphorylation rather than an increase in
BAEC. As shown in Fig. 7B, lithium had no signifi-
cant effect on inhibitory GSK3b-S9 phosphorylation
early during treatment, between 5 and 30 min, but
increased it significantly at later times with a twofold
increase at 24 h. These results are in agreement with
the effects of chronic lithium treatment on GSK3b-S9
phosphorylation in various cell lines, including neuron-
al cells [44]. However, in BAEC, lithium decreased
activating Akt-S473 phosphorylation significantly,
about twofold, as early as 30 min into treatment
(Fig. 7B), and this decrease persisted over 24 (Fig. 7B)
and 36 h (not shown). This decrease in active Akt was
consequently associated with a decrease at 6 h in the
transcription factor FOXO1 phosphorylation on
Thr24, an Akt substrate site in vivo [45] (Fig. 7B). Val-
proate, like lithium, did not induce an increase but
rather a decrease in Akt-S473 phosphorylation,
although the latter occurred later after 24 h treatment
(Fig. 7B). Similarly, although to a lesser extent than
lithium, valproate increased inhibitory GSK3b-S9
phosphorylation. By contrast, indirubin induced rapid
disappearance of both the activating Akt-S473 and the
inhibitory GSK3b-S9 phosphorylations at treatment
periods between 5 min and 24 h, compared with con-
trol-treated cells (Fig. 7B). Therefore, valproate and
lithium appeared to induce similar changes in the
Akt ⁄ FOXO1 signaling cascade in primary BAEC
except for stronger and faster effects with lithium.
Lithium increases the expression of PGC-1a
in BAEC
The finding that the Akt ⁄ FOXO1 cascade is affected
by lithium in BAEC prompted us to investigate the
effects of lithium on the expression of PGC-1a as it
has previously been shown that activation of Akt led
to downregulation of PGC-1a expression via nuclear
exclusion of FOXO1 in skeletal muscle cells [46]. Lev-
els of PGC1-a mRNA, as well as those of the related
coactivator PRC, were determined using real-time
PCR after BAEC treatments (Fig. 8A). As expected
for valproate, a short branched-chain fatty acid, there
was a strong increase in the mRNA levels of PGC-1a,
3.1 ± 0.7-fold at 36 h treatment (Fig. 8A). Indeed,
these results, although novel for valproate, are consis-
tent with the regulation of PGC-1a expression by
nutrient availability and, in particular, by various fatty
acids [26,47]. Surprisingly, lithium treatment was also
associated with an increase in PGC-1a mRNA levels,
2.6 ± 0.6-fold, although no statistically significant
change in PRC expression was observed (Fig. 8A). In
addition to being regulated by FOXO1 transcription
factor, PGC-1a expression is also upregulated by act-
ive CREB transcription factor [26]. Lithium is a well-
known inducer of CREB activation via an increase in
activating CREB-S133 phosphorylation in neuronal
cells [48]. Therefore, we tested the effects of lithium on
ATP
synthase–β
β
COX-VIccyt-b TFAMATP
synthase-6
0
1
2
3
4
5
6
Fold increase of target mRNA levels
in treated Vs control NaCl treated BAEC
Li Val Ind
*
*
*
*
*
*
A
Fold increase of target mRNA levels
in GSK3
β
versus control transfected BAEC
B
ATP
synthase–
β
COX-VIc
cyt-b TFAM
ATP
synthase-6
0
1
2
3
4
5
6
Control WT S9A K85R
IL-8
C
PCR3 Wt S9A K85R
Phospho-S9
GSK3
β
His-Tag
GSK3
β
Fig. 6. Lithium effects on mitochondrial biogenesis are independent
of GSK3b inhibition. BAEC were either treated for 36 h with various
known inhibitors of GSK3b,10m
M LiCl, 1 mM VPA, and 5 lM
indirubin (IND) (A) or transfected for 36 h with either wildtype-
GSK3b (WT), the constitutive active S9A-GSK3b (S9A) or the inac-
tive K85R-GSK3b (K85R) prior to RNA extraction. mRNA levels of
the indicated genes were determined by real-time PCR. Levels of
IL-8 mRNAs were determined as a control for the dominant effects
of the inactive K85R-GSK3b. Mean ± SEM results obtained from
four independent experiments are reported in the graphs. Results
were considered significant at P < 0.05 (*) (Student’s t-test).
(C) The expression of the histidine-tagged GSK3b proteins and their
Ser9 phosphorylation status were controlled by western blotting.
Lithium increases mitochondrial biogenesis I. T. Struewing et al.
2756 FEBS Journal 274 (2007) 2749–2765 ª 2007 The Authors Journal compilation ª 2007 FEBS
CREB-S133 phosphorylation in BAEC and found that
treatment with lithium, or valproate, for 8 h signifi-
cantly induced activating CREB-S133 phosphorylation
by 2- and 1.5-fold, respectively, compared with
NaCl-treated cells (Fig. 8B). These results suggest that
lithium increases PGC-1a expression via at least two
mechanisms: activation of FOXO1 and CREB.
Discussion
Lithium is commonly used to treat bipolar disorder [1]
and recent evidence suggests that it might also be
beneficial in the treatment of neurodegenerative dis-
eases [6]. However, the mechanisms involved in both
the beneficial effects and side effects of lithium are not
fully identified. We report a novel effect of lithium at
doses commonly used to inhibit GSK3b activity and
mimic Wnt signaling [33]. In primary endothelial cells,
lithium treatment triggered an increase in mitochond-
rial mass and ATP production without changing
mitochondrial efficiency. This in crease in mitochondrial
biogenesis correlated with the upregulation of key
master controllers of mitochondrial biogenesis: tran-
scription factors NRF1 and NRF2b and coactivator
PGC-1a [25,26]. In addition, we showed that two
different signaling cascades known to regulate PGC-1a
expression, inactivation of Akt [46] and activation of
CREB [26], were triggered by lithium treatment.
An increase in mitochondrial biogenesis has been
described in numerous physiological conditions as an
adaptive mechanism during muscle exercise, calorie
restriction, hormone treatment and cell differenti-
A
Akt
β
β
-actin
phosphoS473-Akt
phosphoS9-GSK3
β
GSK3
β
5 min
30 min 2 h
Treatments
B
PhosphoS473-AKT/AKT
0
0.5
1
1.5
2
2.5
3
3.5
Li
VPA
Fold changes versus NaCl
PhosphoS9-GSK/GSK
5 min 30 min 2 h 6 h 24 h 5 min 30 min 2 h 6 h 24 h 5 min 30 min 2 h 6 h 24 h
0
0.5
1
1.5
2
2.5
3
Li
VPA
PhosphoT24-FOXO1/FOXO1
0
0.5
1
1.5
2
2.5
3
Li
VPA
C
Na Li VPA IndNa Li VPA IndNa Li VPA IndNa Li VPA Ind
24 h
NaCl LiCl VPA Indirubin
Fig. 7. Lithium increases BAEC cell size and affects Akt ⁄ FOXO1 signaling cascade. (A) Lithium increases the spreading and size of BAEC.
BAEC were plated for 12 h prior to being treated with 10 m
M NaCl, 10 mM LiCl, 1 mM VPA or 5 lM indirubin for 36 h. Phase-contrast micro-
scope images were taken and representative images are shown for each treatment. (B) Lithium increases the inhibitory phosphorylation of
GSK3b on Ser9 in absence of Akt activation. BAEC were treated as indicated in (A) for 5 min, 30 min, 2 h and 24 h prior to cell harvesting
and analysis of GSK3b and Akt phosphorylations using immunoblotting with specific phospho-S9-GSK3b and phospho-S473-Akt antibodies.
Akt-dependent phosphorylation of FOXO1 on Thr24 was also studied in parallel. Total levels of GSK3b, Akt and FOXO1 were used to normal-
ize for changes in expression and b-actin was used as loading control. A representative experiment is shown and the fold changes obtained
after lithium treatment from four independent experiments are reported in the graphs.
I. T. Struewing et al. Lithium increases mitochondrial biogenesis
FEBS Journal 274 (2007) 2749–2765 ª 2007 The Authors Journal compilation ª 2007 FEBS 2757
ation, as well as in various pathological situations to
compensate for mitochondrial dysfunction or damage
[24,25]. It is possible that lithium as a potential com-
petitive inhibitor of some Mg
2+
-dependent mito-
chondrial enzymes and transporters, might induce
mitochondrial biogenesis in response to mitochondrial
dysfunction. However, the kinetics of the increase in
mitochondrial mass and ATP production observed
between 18 and 36 h of treatment are incompatible
with initial mitochondrial dysfunction (Fig. 1). Simi-
larly, the kinetics are incompatible with a compensa-
tory mechanism following mitochondrial oxidative
damage because, in this case, an initial decrease in
both mitochondrial mass and ATP production would
be expected prior to the recovery phase. Moreover,
treatment of BAEC with lithium did not increase intra-
cellular levels of hydrogen peroxide (Fig. 4B), which
would be indicative of oxidative stress.
Also consistent with the absence of lithium-induced
oxidative stress in BAEC, the distribution of mitochon-
dria within cells was not altered compared with
sodium-treated cells, apart from an increase in cell and
mitochondrion size (Fig. 2). The distribution of mito-
chondria within cells is mainly dependent on movement
along microtubules and changes in the cell cycle [49].
Lithium treatment increases microtubule stabilization
in a GSK3b-dependent manner [50,51]. Lithium also
affects the cell cycle, although in a different manner
depending on the cell type. In particular, lithium indu-
ces G
2
⁄ M cell-cycle arrest in several cell types, inclu-
ding BAEC [13,18]. The microtubule polymerizing
agent, taxol, has been shown to induce both an increase
in mitochondrial biogenesis and G
2
⁄ M cell-cycle arrest
in the human 143B osteosarcoma cell line, but unlike
lithium, these changes were associated with an abnor-
mal distribution of mitochondria around the nucleus
[52]. By contrast, mitochondrial DNA replication starts
at the G
1
⁄ S phase transition, whereas mitochondrial
biogenesis peaks in the G
2
⁄ M phase, allowing equal
distribution of mitochondria between the two daughter
cells during cytokinesis [49,53]. Thus, the lithium-
induced cell-cycle arrest in G
2
⁄ M might be sufficient to
explain lithium-induced mitochondrial biogenesis.
Our results also showed that this lithium-dependent
increase in mitochondrial biogenesis in BAEC was
associated with an increase in mRNA levels for coacti-
vator PGC-1a but not coactivator PRC (Fig. 8A). This
is consistent with the cell-cycle arrest induced by lith-
ium. Indeed, regulation of PRC expression is mainly
dependent on cell-proliferation status, i.e. increased
in the presence of growth factors and decreased in
contact-inhibited cells [26]. However, regulation of
PGC-1a expression during cell differentiation is well
documented, as are the effects of lithium on cell differ-
entiation. PGC-1a expression increases during regener-
ative skeletal myogenesis as the cells grow, fuse and
acquire contractile functions [54], and both lithium
and Wnt signaling activate myogenic differentiation in
cell-culture systems and the muscle regeneration model
[55,56]. By contrast, activation of the canonical Wnt ⁄
b-catenin signaling pathway in highly differentiated
*
0
0.5
1
1.5
2
2.5
3
3.5
4
4.5
Na Li VPA Ind
Fold increase of target mRNA levels
In treated vs control NaCl-treated BAEC
*
PGC-1
α
PRC
A
Na Li VPA Ind
8 h
B
Treatments
phosphoS133-CREB
phosphoS133-ATF1
CREB
β
-actin
0
0.5
1
1.5
2
2.5
Li
VPA
Fold changes versus NaCl
PhosphoS133-CREB/CREB
8 h
Fig. 8. Lithium increases the expression of the coactivator PGC-1a.
(A) Lithium increases the levels of PGC-1a mRNA. BAEC were trea-
ted for 36 h with 10 m
M NaCl, 10 mM LiCl, 1 mM VPA or 5 lM
indirubin prior to RNA extraction and the levels of PGC-1a and PRC
mRNAs were quantified using real-time RT-PCR. The graph repre-
sents mean ± SEM results obtained from five independent experi-
ments. (B) Lithium increases the levels of phospho-S133-CREB.
BAEC were treated for 8 h with 10 m
M NaCl, 10 mM LiCl, 1 mM
VPA or 5 lM indirubin prior to cell lysis and the levels of phospho-
S133-CREB and total CREB were analyzed using immunoblotting
with b-actin as the loading control. A representative experiment is
shown the fold changes obtained after lithium treatment in three
independent experiments are reported.
Lithium increases mitochondrial biogenesis I. T. Struewing et al.
2758 FEBS Journal 274 (2007) 2749–2765 ª 2007 The Authors Journal compilation ª 2007 FEBS
brown adipocytes represses the expression of PGC-1a
and the PGC-1a target gene UCP1, leading to their
dedifferentiation to white adipocytes [57]. Lithium treat-
ment as well as overexpression of Wnt10b in Rb
– ⁄ –
MEF resulted in the blockade of both adipocytic
differentiation and PGC-1a expression [57]. Although
lithium and Wnt signals have opposite effects on ske-
letal myogenesis and adipocyte differentiation, in both
cases PGC-1a levels were associated with the differen-
tiated states of the cells. However, BAEC are already
differentiated and lithium triggers a senescent-like phe-
notype detectable after 4 days of treatment [13].
Although a compensatory increase in mitochondrial
biogenesis is also observed in senescent fibroblasts to
maintain constant ATP production, the efficiency of
mitochondrial OXPHOS is reduced because of
increased proton leakage [58]. In lithium-treated cells,
there was an increase in ATP production in parallel
with the increase in mitochondrial mass, indicating
constant production of ATP per mitochondria and
hence no change in mitochondrial efficiency (Fig. 1).
Therefore, the lithium-induced increase in mitochond-
rial biogenesis is not secondary to the establishment of
cell senescence.
However, regulation of PGC-1a is also triggered by
metabolic and environmental stresses [25,26]. Our
results showed that lithium induced a decrease in Akt
phosphorylation on Ser473 and Akt activity, because
phosphorylation of FOXO1 on Thr24, an Akt sub-
strate site, also decreased (Fig. 7). Although lithium
has been shown to increase Akt phosphorylation in
various cell lines, it is important to note that, in all
these studies, cells were serum-starved prior to the
addition of lithium, which was not the case in this
study. The observed decrease in Akt and FOXO1 phos-
phorylation was consistent with changes in the pattern
of gene expression observed after lithium treatment
(unpublished), which includes the increase in PGC-1a
expression (Fig. 8). Indeed, levels of PGC-1a expres-
sion have been shown to depend on the Akt ⁄ FOXO1
cascade in skeletal muscle [46]. Both the decrease in
activating Akt phosphorylation and increase in PGC-
1a expression are reminiscent of the induction of a
stress pathway, which remains to be identified as lith-
ium does not induce oxidative stress in BAEC (Fig. 4).
Interestingly, mild stresses triggered, for example, by
physical exercise or preconditioning agents such as the
K-ATP-dependent channel opener diazoxide, increase
mitochondrial biogenesis allowing the preservation of
mitochondrial functions during stronger stress [59,60].
The preconditioning effects of lithium have been des-
cribed both in brain and heart ischemia–reperfusion
models and this protective effect was associated with
activation of the Akt survival pathway and inhibition
of GSK3b [6,8,9]. Our results showed that the effects
of lithium on mitochondrial biogenesis were independ-
ent of the inhibition of GSK3b because expression of
an inactive or constitutive form of GSK3b had no
effect on expression of the mitochondrial biogenesis
markers (Fig. 6). However, we have shown also that
lithium increased the activating CREB-S133 phos-
phorylation, which is another mechanism controlling
the expression of PGC-1a [26]. A protective CREB-
dependent pathway has been described during precon-
ditioning in both brain and heart ischemia–reperfusion
models [61,62]. In particular, resveratrol, is a well-
known activator of PGC-1a, has been used as precon-
ditioning agent [26]. Therefore, it is conceivable that
some of the protective effects of lithium during precon-
ditioning might involve a CREB ⁄ PGC-1a cascade.
Although caution should be taken in extrapolating
our results in primary BAEC to other cell types, inclu-
ding neuronal cells, it is noteworthy that lithium also
induces CREB phosphorylation on Ser133 and activa-
tion in neuronal cells [48], and lithium treatment was
shown to reverse the decreased expression of several
OXPHOS genes in brain tissues from bipolar disorder
subjects [29]. Also, recent studies have established a
crucial role of PGC-1a in protection against neuro-
degenerative diseases [30,63]. Therefore, our study
reveals a novel lithium-dependent mechanism leading
to an increase of PGC-1a expression and mitochondrial
biogenesis that appears highly relevant for the beneficial
effects of lithium treatment in bipolar disorder and
neurodegenerative diseases.
Experimental procedures
Materials
The chemicals lithium chloride, sodium valproate, d-
myo-inositol, DETA-NO (2,2¢-(hydroxynitrosohydrazono)
bis-ethanimine), indirubin-3¢-monoxime and the mouse
anti-(tubulin-a) mAb were from Sigma-Aldrich (St Louis,
MO). Mitochondria probes, Mitotracker-CMXRos and
Mitotracker-633-Deep Red, and the intracellular H
2
O
2
probe, 5- (and 6)-chloromethyl-2¢-7¢-dichlorodihydrofluo-
rescein diacetate (CM-H
2
DCFDA) and the rabbit poly-
clonal ATP synthase-b were from Molecular Probes
(Eugene, OR). Mouse anti-GSK3b mAb were from Transduc-
tion Laboratories (Lexington, KY) and the rabbit polyclonal
anti-(b-actin), anti-(phospho-S9-GSK3b), anti-(phospho-
S473-Akt), anti-(Akt), anti-(phosphoT24 ⁄ T32-FOXO1 ⁄ 3a),
anti-(FOXO1, antiphosphoS133-CREB) and anti-CREB
sera, and secondary horseradish-peroxidase-conjugated anti-
bodies were from Cell Signaling (Beverly, MA).
I. T. Struewing et al. Lithium increases mitochondrial biogenesis
FEBS Journal 274 (2007) 2749–2765 ª 2007 The Authors Journal compilation ª 2007 FEBS 2759
Cell culture and transfection
Primary BAEC were purchased from Cambrex (Walkers-
ville, MD) and maintained in culture in Dulbecco’s modi-
fied Eagles’ medium containing 1 gÆL
)1
d-glucose and
supplemented with 10% fetal bovine serum, 100 UÆmL
)1
penicillin and 100 lgÆmL
)1
streptomycin (Gibco-Invitrogen,
Carlsbad, CA). All BAEC treatments were carried out in
the same medium. Transient transfections of BAEC with
the various GSK3b constructs were performed using
Exgen500 reagent (Fermentas, Hanover, MD) as recom-
mended by the manufacturer.
GSK3b constructs
Wild-type Xenopus GSK3b and inactive K85R-GSK3 b
cDNA were kindly provided by I. Dominguez (Boston Uni-
versity Medical Center, Boston, MA) [64]. The constitutive
mutant S9A-GSK3b was also generated by PCR using the
mutated forward primer 5¢-GCCACCATGTCGGGAAG
GCCGAGAACCACTGCCTT TG-3¢ and the His6-tag was
added in frame at the C-terminus of all the constructs by
PCR using the reverse primer 5¢-TCAATGGTGATG
GTGATGGTGTCCGGAGGAGTTGGAGGCAG-3¢.
Phase contrast and immunofluorescence
confocal imaging
BAEC were plated on glass chamber slides 18 h prior to
being treated with the various inhibitors for 24 h. Phase-
contrast images were taken with an inverted microscope
(Nikon, TE2000). For the immunofluorescence staining,
BAEC were treated with either 10 mm NaCl or 10 mm LiCl
for 48 h, whereas treatment with 50 lm DETA-NO was
performed for 4 days with repeated treatments every 24 h
as described previously [36], prior to being stained with
200 nm Mitotracker-Deep Red for 45 min accordingly to
the manufacturer’s recommendation (Molecular Probes).
Slides were then mounted in presence of the antifading
agent vectashield containing the nuclear stain DAPI (Vec-
tor Laboratories, Burlingame, CA). Serial images were
taken using Leica immunofluorescence confocal micro-
scope.
Whole-cell extracts and western blot analysis
After washing with cold NaCl ⁄ P
i
, cells were lysed in
50 mm Hepes pH 7.4, 0.1% Chaps, 5 mm dithiothreitol
and 2 mm EDTA supplemented with protease and phos-
phatase cocktail inhibitors (Sigma-Aldrich). Equal amounts
of the proteins were denaturated by boiling in Laemmli
buffer, fractionated on SDS–PAGE and transferred onto
Immobilon P membrane (Millipore, Billerica, MA). After
blocking, membranes were incubated with the various pri-
mary antibodies as indicated and subsequently with the
appropriate secondary antibodies conjugated to horseradish
peroxidase (Cell Signaling). Immunoreactive proteins were
detected using SuperSignalÒ chemiluminescence (Pierce
Chemical Co, Rockford, IL) and the intensity of the result-
ing bands was determined by densitometry using scion
software. To control for variations in loadings, the same
membrane was stripped, washed and blocked prior to
being incubated with either anti-(a-tubulin) or anti-
(b-actin) sera.
RNA extraction, reverse transcription
and real-time PCR
RNA extractions were performed using Trizol reagent
(Invitrogen). Total RNA (1 lg) was subjected to DNAse I
treatment for 15 min (Invitrogen) prior to being reverse
transcribed at 42 °C in presence of 0.5 lg oligo(dT) and
200 U reverse transcriptase for 50 min (Invitrogen). Quanti-
tative real-time PCR was performed in duplicate, with an
equivalent of 16 ng total RNA per reaction and 10 pmole
of each specific primer for the target genes (Table 1), using
the SyBr Green PCR core reagent and the ABI7000 appar-
atus (Applied Biosystems, Foster City, CA). For each tar-
get gene, the threshold cycle number (Ct) was calculated
using sds v. 1.7 software (Applied Biosystems) and the
duplicates averaged. The Ct differences (DCt) of the target
gene and the internal control rpL30 gene for each cell treat-
ments were determined and the relative levels of target
mRNA were calculated following the equation 2DCt trea-
ted ) DCt control, where control represents NaCl-treated
cells. At least five independent experimental treatments
were performed.
DNA extraction and quantification
of mitochondrial DNA by real-time PCR
After washes in cold NaCl ⁄ P
i
, the cells were scraped off
the plate in NaCl ⁄ P
i
and centrifuged at 500 g for 5 min.
The cell pellet was then resuspended in 200 lL of NaCl ⁄ P
i
with 2 lgÆmL
)1
RNAse A prior to being subjected to
DNA extraction using the DNeasy kit (Qiagen, Valencia,
CA). The amounts of mitochondrial and nuclear DNA
were determined by real-time PCR using the SyBr green
Core reagent kit (Applied Biosystems). Two different
genes for each genome were studied in parallel to minim-
ize variation in primer pair efficiency. We used specific
primer pairs for cytochrome b, mitochondria control
region and 12S ribosomal RNA as markers of the mitoch-
ondrial genome and ATP synthase subunit-b, ribosome
biogenesis regulator-1 and mitochondrial transcription fac-
tor A as markers of the nuclear genome. The sequences
of the various primers are provided in Table 1. For each
primer set, quantification was performed in duplicate with
Lithium increases mitochondrial biogenesis I. T. Struewing et al.
2760 FEBS Journal 274 (2007) 2749–2765 ª 2007 The Authors Journal compilation ª 2007 FEBS
10 ng total DNA per reaction. The differences in the
MitDNA-Ct versus the NuDNA-Ct (DMit–NuDNA-Ct)
were calculated for each condition and for each MitDNA–
NuDNA pair: 12S ⁄ TFAM, cytochrome b ⁄ ATP-synthase-b
and CR ⁄ RRS1. The fold variations of the MitDNA levels
versus NuDNA levels following treatments were deter-
mined using the equation 2DMit–NuDNA-Ct treated )
DMit–NuDNA-Ct control, where control cells represent
NaCl-treated cells. Three to four independent experiments
were performed.
ATP quantification
BAEC were plated in 12-well plates for 12 h prior to being
subjected to the various treatments for an additional 36 h.
After washing with sterile NaCl ⁄ P
i
, the cells were lysed in
125 lL sterile NaCl ⁄ P
i
buffer containing 1% Triton X-100,
2mm EDTA and 2 mm dithiotreitol. Levels of ATP were
determined using the ATP-dependent enzyme luciferase and
its luminescent luciferin substrate (ATP determination kit,
Molecular Probes). Reactions were performed accordingly
Table 1. Sequences of primers used for real-time PCR.
Bovine genes Genome Primer sequences (5¢–to3¢)
12S rRNA Mitochondria Fwd: CCTACAATAGCCGACGCACT
Rev: GGTGAGGTTTATCGGGGTTT
COX II Mitochondria Fwd: GCCAGGGGAGCTACGACTAT
Rev: CGCAAATTTCTGAGCATTGA
Cytochrome b Mitochondria Fwd: AATGCATTCATCGACCTTCC
Rev: CCGTTTGCGTGTATGTATCG
ATP synthase subunit-6 Mitochondria Fwd: TCGCTTTGTAACCCTCCAAC
Rev: GGGATGGCTATGCCTAGGTT
Control region Mitochondria Fwd: CAACCCCAAAGCTGAAGTTCT
Rev: CCTTGCGTAGGTAATTCATTC
MitRNA polymerase Nuclear Fwd: GGACTCCACACACATGATGC
Rev: GAACCTGGACAGGTCATGGAG
MitDNA polymerase Nuclear Fwd: GGACTCCACACACATGATGC
Rev: AACCTGGACAGGTCATGGAG
Cytochrome c1 Nuclear Fwd: CCAGGTAGCCAAGGATGTGT
Rev: GACCCTGAAGCTCAGGACAG
COX VIa Nuclear Fwd: GGAAGGCCCTCACCTACTTC
Rev: CGGGTTCACATGAGGGTTAT
COX VIc Nuclear Fwd: GCTTTGGCAAAACCTCAGAT
Rev: ACCAGCCTTCCTCATCTCCT
ATP synthase subunit b Nuclear Fwd: ACAGGACCCTATGTGCTTGG
Rev: ATCAGCAAATTCCCCAACAG
Uncoupling protein-2 Nuclear Fwd: ATGACAGACGACCTCCCTTG
Rev: GGCATGAACCCTTTGTAGAAG
Mit-transcription factor A
(TFAM)
Nuclear Fwd: GGGAGGAACAAATGATGGAA
Rev: CCATGGGCTACAGAAAAGGA
Mit-transcription factor B2
(TFB2)
Nuclear Fwd: GTACAAGTCCCGTTCCGAGAC
Rev: CACTCTGGCACCACTTTCAAG
NRF1 Nuclear Fwd: ACCGCCGAATAATTCACTTG
Rev: CACAAACACAGGCCACAACC
NRF2b ⁄ GABP-b Nuclear Fwd: CATTGTGACCATGCCAGATG
Rev: GTAGGCCTCTGCTTCCTGTTC
c-myc Nuclear Fwd: CTCCTCACAGCCCGTTAGTC
Rev: CGCCTCTTGTCATTCTCCTC
PGC1-a Nuclear Fwd: CCGAGAATTCATGGAGCAAT
Rev: GATTGTGTGTGGGCCTTCTT
PRC Nuclear Fwd:
GCTGAGAATGTGGCTGTTGA
Rev: TCACTGATGAAAGCCTGCAC
rpL30 Nuclear Fwd: CTCAACGAGAACAAGCTATC
Rev: CCAATCTGCCGACTTAGCG
RRS1 Nuclear Fwd: GCGAGTGATGAACAGCAAAA
Rev: CTTTCCTCTTCCCTCCTTGG
Interleukin-8 Nuclear Fwd: CGATGCCAATGCATAAAAAC
Rev: CTTTTCCTTGGGGTTTAGGC
I. T. Struewing et al. Lithium increases mitochondrial biogenesis
FEBS Journal 274 (2007) 2749–2765 ª 2007 The Authors Journal compilation ª 2007 FEBS 2761
to the recommendations of the manufacturer in duplicate
for both cell extracts (10 lL) and ATP standards. Lumines-
cence intensity was recorded using a LMAX-II luminometer
(Molecular Devices, Sunnyvale, CA, USA). The amounts
of protein in the cell extracts were measured in duplicate by
spectrometry using the BCA reagents (BioRad, Hercules,
CA). Levels of ATP in luminescent intensity per lg of pro-
teins were calculated for each treatment and the data
obtained in 6–8 independent experiments are expressed in
fold increase of ATP levels with the control NaCl-treated
cells equal to 1.
Determination of the mitochondrial
transmembrane potential
BAEC were plated in 24-well plates for 12 h prior to being
subjected to the various treatments for 36 h. After washing
with NaCl ⁄ P
i
containing 1 mm Ca
2+
⁄ Mg
2+
, the cells were
incubated for 45 min with 500 nm of Mitotracker CMXRos
in NaCl ⁄ P
i
with Ca
2+
⁄ Mg
2+
. After three washes in NaCl ⁄ P
i
with Ca
2+
⁄ Mg
2+
, the fluorescence intensities associated with
active mitochondria were measured at k
exc550
⁄ k
em590
using a
Fusion
TM
plate reader (Perkin–Elmer, Waltham, MA). Cell
number was determined using CyQuant staining accordingly
to the manufacturer’s instructions (Molecular Probe) and
measurement of the fluorescence intensity at k
exc485
⁄ k
em535
.
The mitochondria membrane potential per cell was calcula-
ted as the ratio of the CMXRos fluorescent intensity versus
the CyQuant fluorescent intensity and the results obtained in
eight independent experiments performed in triplicate are
presented as the relative MTP levels with the control NaCl-
treated cells being equal to 1.
Determination of intracellular hydrogen peroxide
production
BAEC were plated in 24-well plates for 12 h prior to being
treated with 10 mm NaCl as control, 10 mm LiCl or 1 mm
VPA for 36 h. After washing with NaCl ⁄ P
i
containing 1 mm
Ca
2+
⁄ Mg
2+
, cells were incubated for 30 min with 2.5 lm
CM-H
2
DCFDA (Molecular Probes) in the dark. After three
washes in NaCl ⁄ P
i
with Ca
2+
⁄ Mg
2+
, the fluorescence inten-
sities were measured at k
exc485
⁄ k
em535
as described above, the
results were normalized for variation in cell numbers using
CyQuant staining and quantification, thought in this case
separate wells were used. The results obtained from five inde-
pendent experiments performed in triplicate are presented as
the relative levels of hydrogen peroxide production with the
control NaCl-treated cells being equal to 1.
Statistical analysis
After verification of the normal distribution of the values
obtained in at least three independent experiments,
Student’s t-test and one-way anova were performed using
graphpad prism v. 4.0 (GraphPad Software, San Diego,
CA). Results were considered significant at P < 0.05.
Acknowledgements
We thank I. Dominguez for the kind gift of wt- and
K85R-GSK3b constructs. This work was supported by
NIH grant HL68698 to CDM.
References
1 Pilcher HR (2003) The ups and downs of lithium.
Nature 425, 118–120.
2 Hedgepeth C, Conrad LJ, Zhang J, Huang HC, Lee
VM & Klein PS (1997) Activation of the Wnt signaling
pathway: a molecular mechanism for lithium action.
Dev Biol 185, 82–91.
3 Klein PS & Melton DA (1996) A molecular mechanism
for the effect of lithium on development. Proc Natl
Acad Sci USA 93, 8455–8459.
4 Belmaker RH, Livne A, Agam G, Moscovich DG,
Grisaru N, Schreiber G, Avissar S, Danon A & Kofman
O (1990) Role of inositol-1-phosphatase inhibition in
the mechanism of action of lithium. Pharmacol Toxicol
66, 76–83.
5 Harwood AJ (2005) Lithium and bipolar mood disor-
der: the inositol-depletion hypothesis revisited. Mol
Psychiat 10, 117–126.
6 Wada A, Yokoo H, Yanagita T & Kobayashi H (2005)
Lithium: potential therapeutics against acute brain inju-
ries and chronic neurodegenerative diseases. J Pharma-
col Sci 99, 307–321.
7 Sarkar S, Floto RA, Berger Z, Imarisio S, Cordenier A,
Pasco M, Cook LJ & Rubinsztein DC (2005) Lithium
induces autophagy by inhibiting inositol monophospha-
tase. J Cell Biol 170, 1101–1111.
8 Kaga S, Zhan L, Altaf E & Maulik N (2006) Glycogen
synthase kinase-3beta ⁄ beta-catenin promotes angiogenic
and anti-apoptotic signaling through the induction of
VEGF, Bcl-2 and survivin expression in rat ischemic pre-
conditioned myocardium. J Mol Cell Cardiol 40, 138–147.
9 Tong H, Imahashi K, Steenbergen C & Murphy E
(2002) Phosphorylation of glycogen synthase
kinase-3beta during preconditioning through a
phosphatidylinositol-3-kinase – dependent pathway is
cardioprotective. Circ Res 90, 377–379.
10 Masuda CA, Xavier MA, Mattos KA, Galina A &
Montero-Lomeli M (2001) Phosphoglucomutase is an
in vivo lithium target in yeast. J Biol Chem 276,
37794–37801.
11 Schambony A, Kunz M & Gradl D (2004) Cross-regula-
tion of Wnt signaling and cell adhesion. Differentiation
72, 307–318.
Lithium increases mitochondrial biogenesis I. T. Struewing et al.
2762 FEBS Journal 274 (2007) 2749–2765 ª 2007 The Authors Journal compilation ª 2007 FEBS
12 Williams RS & Harwood AJ (2000) Lithium therapy and
signal transduction. Trends Pharmacol Sci 21, 61–64.
13 Mao CD, Hoang P & DiCorleto PE (2001) Lithium
inhibits cell cycle progression and induces stabilization
of p53 in bovine aortic endothelial cells. J Biol Chem
276, 26180–26188.
14 Rossig L, Badorff C, Holzmann Y, Zeiher AM &
Dimmeler S (2002) Glycogen synthase kinase-3 couples
AKT-dependent signaling to the regulation of p21Cip1
degradation. J Biol Chem 277, 9684–9689.
15 Cheng CW, Smith SK & Charnock-Jones DS (2003)
Wnt-1 signaling inhibits human umbilical vein endothe-
lial cell proliferation and alters cell morphology. Exp
Cell Res 291, 415–425.
16 Stump RJ, Lovicu FJ, Ang SL, Pandey SK & McAvoy
JW (2006) Lithium stabilizes the polarized lens epithelial
phenotype and inhibits proliferation, migration, and
epithelial mesenchymal transition. J Pathol 210, 249–
257.
17 Penso J & Beitner R (2003) Lithium detaches hexoki-
nase from mitochondria and inhibits proliferation of
B16 melanoma. Mol Genet Met 78, 74–78.
18 Smits VA, Essers MA, Loomans DS, Klompmaker R,
Rijksen G & Medema RH (1999) Inhibition of cell pro-
liferation by lithium is associated with interference in
cdc2 activation. FEBS Lett 457, 23–27.
19 Hoshi M, Sato M, Kondo S, Takashima A, Noguchi K,
Takahashi M, Ishiguro K & Imahori K (1995) Different
localization of tau protein kinase I ⁄ glycogen synthase
kinase-3 beta from glycogen synthase kinase-3 alpha in
cerebellum mitochondria. J Biochem (Tokyo) 118,
683–685.
20 Bijur GN & Jope RS (2003) Glycogen synthase kinase-3
beta is highly activated in nuclei and mitochondria.
Neuroreport 14, 2415–2419.
21 Watcharasit P, Bijur GN, Song L, Zhu J, Chen X &
Jope RS (2003) Glycogen synthase kinase-3b (GSK3b)
binds to and promotes the actions of p53. J Biol Chem
278, 48872–48879.
22 Pastorino JG, Hoek JB & Shulga N (2005) Activation
of glycogen synthase kinase 3beta disrupts the binding
of hexokinase II to mitochondria by phosphorylating
voltage-dependent anion channel and potentiates
chemotherapy-induced cytotoxicity. Cancer Res 65,
10545–10554.
23 Matoba S, Kang J-G, Patino WD, Wragg A, Boehm
M, Gavrilova O, Hurley PJ, Bunz F & Hwang PM
(2006) p53 regulates mitochondrial respiration. Science
312, 1650–1653.
24 Garesse R & Vallejo CG (2001) Animal mitochondrial
biogenesis and function: a regulatory cross-talk between
two genomes. Gene 263, 1–16.
25 Kelly DP & Scarpulla RC (2004) Transcriptional regula-
tory circuits controlling mitochondrial biogenesis and
function. Genes Dev 18, 357–368.
26 Puigserver P & Spiegelman BM (2003) Peroxisome pro-
liferator-activated receptor-c coactivator 1a (PGC-1a).
Trans Coactivator Metabolic Regul Endocrin Res 24,
78–90.
27 Suliman HB, Carraway MS, Welty-Wolf KE, Whorton
AR & Piantadosi CA (2003) Lipopolysaccharide stimu-
lates mitochondrial biogenesis via activation of nuclear
respiratory factor-1. J Biol Chem
278, 41510–41518.
28 Kwong JQ, Beal MF & Manfredi G (2006) The role of
mitochondria in inherited neurodegenerative diseases.
J Neurochem 97, 1659–1675.
29 Sun X, Wang J-F, Tseng M & Young LT (2006) Down-
regulation in components of the mitochondrial electron
transport chain in the post mortem frontal cortex of
subjects with bipolar disorder. J Psychiat Neurosci 31,
189–196.
30 Cui L, Jeong H, Borovecki F, Parkhurst CN, Tanese N
& Krainc D (2006) Transcriptional repression of PGC-
1alpha by mutant huntingtin leads to mitochondrial
dysfunction and neurodegeneration. Cell 127, 59–69.
31 McLeod CJ, Jeyabalan AP, Minners JO, Clevenger R,
Hoyt RFJ & Sack MN (2004) Delayed ischemic precon-
ditioning activates nuclear-encoded electron-transfer-
chain gene expression in parallel with enhanced posta-
noxic mitochondrial respiratory recovery. Circulation
110, 534–539.
32 Gidday JM (2006) Cerebral preconditioning and ischae-
mic tolerance. Nat Rev Neurosci 7, 437–448.
33 Williams RSB, Cheng L, Mudge AW & Harwood AJ
(2002) A common mechanism of action for three mood-
stabilizing drugs. Nature 417, 292–295.
34 Fonseca CP, Jones JG, Carvalho RA, Jeffrey FM,
Montezinho LP, Geraldes CF & Castro MM (2005)
Tricarboxylic acid cycle inhibition by Li
+
in the human
neuroblastoma SH-SY5Y cell line: a
13
C NMR isotopo-
mer analysis. Neurochem Int 47, 385–393.
35 Poot M, Zhang YZ, Kramer JA, Wells KS, Jones LJ,
Hanzel DK, Lugade AG, Singer VL & Haugland RP
(1996) Analysis of mitochondrial morphology and func-
tion with novel fixable fluorescent stains. J Histochem
Cytochem 44, 1363–1372.
36 Nisoli E, Falcone S, Tonello C, Cozzi V, Palomba L,
Fiorani M, Pisconti A, Brunelli S, Cardile A, Francolini
M et al. (2004) Mitochondrial biogenesis by NO yields
functionally active mitochondria in mammals. Proc Natl
Acad Sci USA 101, 16507–16512.
37 He TC, Sparks AB, Rago C, Hermeking H, Zawel L,
da Costa LT, Morin PJ, Vogelstein B & Kinzler KW
(1998) Identification of c-MYC as a target of the APC
pathway. Science 281, 1509–1512.
38 Li F, Wang Y, Zeller KI, Potter JJ, Wonsey DR,
O’Donnell KA, Kim JW, Yustein JT, Lee LA & Dang
CV (2005) Myc stimulates nuclearly encoded mitochon-
drial genes and mitochondrial biogenesis. Mol Cell Biol
25, 6225–6234.
I. T. Struewing et al. Lithium increases mitochondrial biogenesis
FEBS Journal 274 (2007) 2749–2765 ª 2007 The Authors Journal compilation ª 2007 FEBS 2763
39 Chen G, Huang LD, Jiang YM & Manji HK (1999)
The mood-stabilizing agent valproate inhibits the activ-
ity of glycogen synthase kinase-3. J Neurochem 72,
1327–1330.
40 Phiel CJ, Zhang F, Huang EY, Guenther MG, Lazar
MA & Klein PS (2001) Histone deacetylase is a
direct target of valproic acid, a potent anticonvulsant,
mood stabilizer, and teratogen. J Biol Chem 276,
36734–36741.
41 Nemeth ZH, Deitch EA, Fekete CSZ, Hauser CJ &
Hasko G (2002) Lithium induces NF-jB activation and
interleukin-8 production in human intestinal epithelial
cells. J Biol Chem 277, 7713–7719.
42 Vyas DR, Spangenburg EE, Abraha TW, Childs TE &
Booth FW (2002) GSK-3beta negatively regulates skele-
tal myotube hypertrophy. Am J Physiol Cell Physiol
283, C545–C551.
43 Haq S, Choukroun G, Kang ZB, Ranu H, Matsui T,
Rosenzweig A, Molkentin JD, Alessandrini A,
Woodgett J, Hajjar R et al. (2000) Glycogen synthase
kinase-3beta is a negative regulator of cardiomyocyte
hypertrophy. J Cell Biol 151, 117–130.
44 Zhang F, Phiel CJ, Spece L, Gurvich N & Klein PS
(2003) Inhibitory phosphorylation of glycogen synthase
kinase-3 (GSK-3) in response to lithium. Evidence for
autoregulation of GSK-3. J Biol Chem 278,
33067–33077.
45 Biggs WHR, Meisenhelder J, Hunter T, Cavenee WK &
Arden KC (1999) Protein kinase B ⁄ Akt-mediated phos-
phorylation promotes nuclear exclusion of the winged
helix transcription factor FKHR1. Proc Natl Acad Sci
USA 96, 7421–7426.
46 Southgate RJ, Bruce CR, Carey AL, Steinberg GR,
Walder K, Monks R, Watt MJ, Hawley JA,
Birnbaum MJ & Febbriao MA (2005) PGC-1a gene
expression is down-regulated by Akt-mediated
phosphorylation and nuclear exclusion of FoxO1 in
insulin-stimulated skeletal muscle. FASEB J 19,
2072–2074.
47 Zhang P, Liu C, Zhang C, Zhang Y, Shen P, Zhang J
& Zhang CY (2005) Free fatty acids increase PGC-
1alpha expression in isolated rat islets. FEBS Lett 579,
1446–1452.
48 Ozaki N & Chuang DM (1997) Lithium increases tran-
scription factor binding to AP-1 and cyclic AMP-
responsive element in cultured neurons and rat brain.
J Neurochem 69, 2336–2344.
49 Karbowski M & Youle RJ (2003) Dynamics of mito-
chondrial morphology in healthy cells and during apop-
tosis. Cell Death Differ 10, 870–880.
50 Bhattacharyya B & Wolff J (1976) Stabilization of
microtubules by lithium ion. Biochem Biophys Res Com-
mun 73, 383–390.
51 Krylova O, Messenger MJ & Salinas PC (2000) Dishev-
elled-1 regulates microtubule stability: a new function
mediated by glycogen synthase kinase-3beta. J Cell Biol
151, 83–94.
52 Karbowski M, Spodnik JH, Teranishi M, Wozniak
M, Nishizawa Y, Usukura J & Wakabayashi T (2001)
Opposite effects of microtubule-stabilizing and
microtubule-destabilizing drugs on biogenesis of
mitochondria in mammalian cells. J Cell Sci 114,
281–291.
53 Martinez-Diez M, Santamaria G, Ortega AD & Cuezva
JM (2006) Biogenesis and dynamics of mitochondria
during the cell cycle: significance of 3¢-UTRs. Public
Library of Science One 1, e107–118.
54 Duguez S, Feasson L, Denis C & Freyssenet D (2002)
Mitochondrial biogenesis during skeletal muscle
regeneration. Am J Physiol Endocrin Metab 282,
E802–E809.
55 van der Velden JL, Langen RC, Kelders MC, Wouters
EF, Janssen-Heininger YM & Schols AM (2006) Inhibi-
tion of glycogen synthase kinase-3beta activity is suffi-
cient to stimulate myogenic differentiation. Am J
Physiol Cell Physiol 290, C453–C462.
56 Polesskaya A, Seale P & Rudnicki MA (2003) Wnt sig-
naling induces the myogenic specification of resident
CD45+ adult stem cells during muscle regeneration.
Cell 113, 841–852.
57 Kang S, Bajnok L, Longo KA, Petersen RK, Hansen
JB, Kristiansen K & MacDougald OA (2005) Effects of
Wnt signaling on brown adipocyte differentiation and
metabolism mediated by PGC-1alpha. Mol Cell Biol 25,
1272–1282.
58 Hutter E, Renner K, Pfister G, Stockl P, Jansen-Durr P
& Gnaiger E (2004) Senescence-associated changes
in respiration and oxidative phosphorylation in
primary human fibroblasts. Biochem J 380,
919–928.
59 Kevelaitis E, Oubenaissa A, Peynet J, Mouas C &
Menasche P (1999) Preconditioning by mitochondrial
ATP-sensitive potassium channel openers: an effective
approach for improving the preservation of heart trans-
plants. Circulation 100, 345–350.
60 Wisloff U, Najjar SM, Ellingsen O, Haram PM, Swoap
S, Al-Share Q, Fernstrom M, Rezaei K, Lee SJ, Koch
LG et al. (2005) Cardiovascular risk factors emerge
after artificial selection for low aerobic capacity. Science
307, 418–420.
61 Das S, Cordis GA, Maulik N & Das DK (2005) Phar-
macological preconditioning with resveratrol: role of
CREB-dependent Bcl-2 signaling via adenosine A3
receptor activation. Am J Physiol Heart Circ Physiol
288, H328–H335.
62 Mabuchi T, Kitagawa K, Kuwabara K, Takasawa K,
Ohtsuki T, Xia Z, Storm D, Yanagihara T, Hori M &
Matsumoto M (2001) Phosphorylation of cAMP
response element-binding protein in hippocampal
neurons as a protective response after exposure to
Lithium increases mitochondrial biogenesis I. T. Struewing et al.
2764 FEBS Journal 274 (2007) 2749–2765 ª 2007 The Authors Journal compilation ª 2007 FEBS
glutamate in vitro and ischemia in vivo. J Neurosci 21,
9204–9213.
63 St-Pierre J, Drori S, Uldry M, Silvaggi JM, Rhee J,
Jager S, Handschin C, Zheng K, Lin J, Yang W et al.
(2006) Suppression of reactive oxygen species and neu-
rodegeneration by the PGC-1 transcriptional coactiva-
tors. Cell 127, 397–408.
64 Dominguez I, Itoh K & Sokol SY (1995) Role of glyco-
gen synthase kinase 3 beta as a negative regulator of
dorsoventral axis formation in Xenopus embryos. Proc
Natl Acad Sci USA 92, 8498–8502.
I. T. Struewing et al. Lithium increases mitochondrial biogenesis
FEBS Journal 274 (2007) 2749–2765 ª 2007 The Authors Journal compilation ª 2007 FEBS 2765