Báo cáo khoa học: Activation of crystalline cellulose to cellulose IIII results in efficient hydrolysis by cellobiohydrolase pot
Bạn đang xem bản rút gọn của tài liệu. Xem và tải ngay bản đầy đủ của tài liệu tại đây (527.62 KB, 8 trang )
Activation of crystalline cellulose to cellulose III
I
results
in efficient hydrolysis by cellobiohydrolase
Kiyohiko Igarashi, Masahisa Wada and Masahiro Samejima
Department of Biomaterials Sciences, Graduate School of Agricultural and Life Sciences, University of Tokyo, Japan
Cellulose is a linear polymer of b-1,4-linked anhydrous
glucose residues, and is the major component of plant
cell walls. In nature, cellulose chains are packed into
ordered arrays to form insoluble microfibrils, which
are stabilized by cross-links involving intermolecular
hydrogen bonds. Microfibrils generally consist of a
mixture of disordered amorphous cellulose and cellu-
lose I, which forms highly ordered crystalline regions.
Cellulose I is further classified into two polymorphs,
triclinic cellulose I
a
, which is found in algal and bac-
terial celluloses, and monoclinic cellulose I
b,
called cot-
ton-ramie-type cellulose [1–3]. Although the differences
in their physiological roles in the cell wall are uncer-
tain, cellulose I
a
is more susceptible than cellulose I
b
to hydrolysis by cellulase [4,5].
Cellulase is a generic term for enzymes hydrolyzing
b-1,4-glucosidic linkages. If we consider the structure
of microfibrils, however, cellulases should be subdivi-
ded into two categories, as all cellulases can hydro-
lyze amorphous cellulose, whereas only a limited
number can hydrolyze crystalline cellulose [6]. The
enzymes that hydrolyze crystalline cellulose are gener-
ally called cellobiohydrolases, and share similar two-
domain structures, with a catalytic domain (CD) and
a cellulose-binding domain (CBD) [7–10]. As the ini-
tial step of the reaction, they are adsorbed on the
surface of crystalline cellulose via the CBD, then glu-
cosidic linkages are hydrolyzed by the CD. As the
reaction produces mainly cellobiose, a soluble b-1,4-
glucosidic dimer, from insoluble substrates, the hydro-
lysis of crystalline cellulose occurs at a solid ⁄ liquid
interface [11–13]. To evaluate such reactions, we
recently developed a novel analysis based on surface
density (q), defined as the amount of adsorbed
enzyme (A) divided by the maximum adsorption of
the enzyme (A
max
) [14]. Using this parameter, we
were able to analyze the hydrolysis of crystalline cel-
lulose while taking account of the available substrate
Keywords
ammonia cellulose; cellobiohydrolase;
cellobiose dehydrogenase; crystalline
polymorphs; solid–liquid interface
Correspondence
M. Samejima, Department of Biomaterials
Sciences, Graduate School of Agricultural
and Life Sciences, University of Tokyo, 1-1-1
Yayoi, Bunkyo-ku, Tokyo 113-8657, Japan
Fax: +81 3 5841 5273
Tel: +81 3 5841 5255
E-mail:
(Received 10 January 2007, revised 31
January 2007, accepted 2 February 2007)
doi:10.1111/j.1742-4658.2007.05727.x
The crystalline polymorphic form of cellulose (cellulose I
a
-rich) of the
green alga, Cladophora, was converted into cellulose III
I
and I
b
by super-
critical ammonium and hydrothermal treatments, respectively, and the
hydrolytic rate and the adsorption of Trichoderma viride cellobiohydro-
lase I (Cel7A) on these products were evaluated by a novel analysis based
on the surface density of the enzyme. Cellobiose production from cellu-
lose III
I
was more than 5 times higher than that from cellulose I. However,
the amount of enzyme adsorbed on cellulose III
I
was less than twice that
on cellulose I, and the specific activity of the adsorbed enzyme for cellu-
lose III
I
was more than 3 times higher than that for cellulose I. When cel-
lulose III
I
was converted into cellulose I
b
by hydrothermal treatment,
cellobiose production was dramatically decreased, although no significant
change was observed in enzyme adsorption. This clearly indicates that the
enhanced hydrolysis of cellulose III
I
is related to the structure of the crys-
talline polymorph. Thus, supercritical ammonium treatment activates crys-
talline cellulose for hydrolysis by cellobiohydrolase.
Abbreviations
CBD, cellulose-binding domain; CD, catalytic domain; FT-IR: Fourier-transform infrared.
FEBS Journal 274 (2007) 1785–1792 ª 2007 The Authors Journal compilation ª 2007 FEBS 1785
surface area, which is not only dependent on the ori-
gin of the cellulose, but also changes during hydroly-
sis. The results showed that the higher hydrolytic rate
of cellulose I
a
than cellulose I
b
is due to the differ-
ence in crystal structure, but not to the difference in
surface area accessible to cellulase [14].
Cellulose III
I
, which is the designation given to
ammonia-treated cellulose, is a reactive crystalline cel-
lulose which is used as a precursor of many cellulose
derivatives [15,16]. Wada and coauthors [17] solved the
crystal structure of cellulose III
I
by synchrotron X-ray
and neutron fiber diffraction analyses, and showed
that it has a lower packing density than cellulose I
a
or
I
b
. In this study, we analyzed the hydrolysis of cellu-
lose III
I
by cellobiohydrolase in terms of surface den-
sity, and discuss how the structural differences of
crystalline celluloses affect the hydrolytic activity of
cellobiohydrolase.
Results
Cellulose preparations
Different crystalline polymorphs of Cladophora cellu-
lose (I
a
-rich) were prepared as shown in Scheme 1.
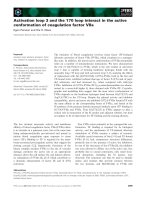
Figure 1 shows the Fourier-transform infrared (FT-IR)
spectra of the OH stretching region for the samples.
The absorption band at 3240 cm
)1
, which is assigned
to cellulose I
a
, is seen in the spectrum of the native
Cladophora cellulose (Fig. 1A), whereas the hydrother-
mal-treated celluloses had a band at 3270 cm
)1
(Fig. 1B,D) without that at 3240 cm
)1
, suggesting that
they have all been converted into cellulose I
b
. The
sharp band at 3480 cm
)1
in Fig. 1C indicates that cel-
lulose I was completely converted into cellulose III
I
by
the supercritical ammonia treatment. The cellulose III
I
was further converted into cellulose I
b
by subsequent
hydrothermal treatment, as indicated by similar FT-IR
spectra in Fig. 1B,D.
Hydrolysis of crystalline celluloses and
adsorption of Cel7A
The time course of increase in cellobiose concentration
during cellulose hydrolysis, measured using the cellobi-
ose dehydrogenase–cytochrome c redox system, is
shown in Fig. 2. Although apparent differences in cell-
obiose production among cellulose I samples were
observed, the most dramatic increase in hydrolysis by
Cel7A was obtained after conversion of the samples
Scheme 1. Conversion of crystalline polymorphs of Cladophora cel-
lulose.
3600 3400 3200 3000
Absorbance
Wavenumber (cm
-1
)
3600 3400 3200 3000
Absorbance
Wavenumber (cm
-1
)
3600 3400 3200 3000
Absorbance
Wavenumber (cm
-1
)
3600 3400 3200 3000
Absorbance
Wavenumber (cm
-1
)
3270
3270
3270
3240
3480
AB
CD
Fig. 1. FT-IR spectra of highly crystalline celluloses in the OH
stretching regions. (A) Native Cladophora cellulose; (B) hydrother-
mal treated cellulose; (C) supercritical ammonia-treated cellulose;
(D) supercritical ammonia and hydrothermal treated cellulose.
Bands at 3240 and 3270 cm
)1
are assigned to the cellulose I
a
and
I
b
phase [36], respectively.
Hydrolysis of cellulose III
I
by cellobiohydrolase K. Igarashi et al.
1786 FEBS Journal 274 (2007) 1785–1792 ª 2007 The Authors Journal compilation ª 2007 FEBS
into cellulose III
I
by supercritical ammonia treatment.
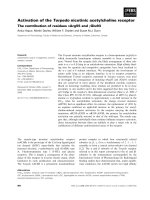
The cellobiose concentration produced from cellu-
lose III
I
was 1600 lm after 320 min incubation and
degradation reached 50% of the initial substrate,
whereas the extent of hydrolysis of other cellulose sam-
ples was less than 10%, demonstrating that the hydrol-
yzability of crystalline cellulose is dramatically
activated if the crystalline polymorphic form is conver-
ted into cellulose III
I
.
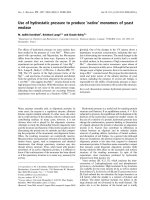
Adsorption of Cel7A on the crystalline cellulose
samples was examined, and the data were fitted to the
two-binding-site Langmuir model as shown in Fig. 3.
Ammonia treatment might increase the surface area
available to the enzyme, as the amounts of adsorbed
enzyme on cellulose III
I
and cellulose I
b
¢ were 1.5–2
times higher than on the samples without ammonia
treatment (cellulose I
a
-rich and I
b
). The adsorption
parameters (K
ad1
, K
ad2
, A
1
, A
2
, A
max
, A
1
ÆK
ad1
, and
A
2
ÆK
ad2
) listed in Table 1 show that the difference
made by ammonia treatment was mainly due to differ-
ences in A
1
, the maximum adsorption of high-affinity
binding: A
1
for cellulose III
I
was almost 8 times higher
than that for cellulose I
a
-rich substrate, and A
1
for cel-
lulose I
b
¢ was 2.6 times that for cellulose I
b
, although
no significant difference was observed in A
2
among the
four crystalline cellulose samples. In addition, the K
ad1
value of Cel7A on cellulose III
I
was quite high com-
pared with those on other celluloses. These result in a
higher adsorption efficiency (A
1
ÆK
ad1
) on cellulose III
I
compared with other crystalline cellulose I samples.
Surface density analysis of the hydrolysis
of crystalline cellulose
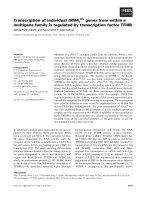
Figure 4 shows the surface density (q) dependence of
cellobiose production rate (v) from crystalline cellulos-
es. As expected from Fig. 2, the highest hydrolytic rate
by Cel7A was seen with cellulose III
I
. When cellulose I
samples were used as substrates, the maximum v values
were observed at q ¼ 0.3–0.4, whereas, in the case of
cellulose III
I
, the maximum rate (5.3 lmÆmin
)1
) was
achieved at a surface density of 0.55. This means that
empty space on the substrate surface equivalent to
another 2 enzyme molecules per adsorbed molecule
must be left on cellulose I to achieve maximum hydro-
lysis, whereas empty space equivalent to only 1 mole-
cule is enough on cellulose III
I
.
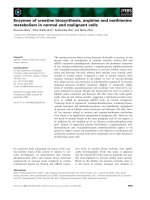
The specific activity of adsorbed enzyme (k ¼ v ⁄ A)
towards crystalline cellulose samples was plotted
against surface density as shown in Fig. 5. The k val-
ues of all samples declined linearly with increase in q
when a logarithmic scale was used for the y-axis. The
calculated values of k at q fi 0(k
0
) and reduction
rate of k (B) are listed in Table 2. The k
0
for cellu-
lose III
I
was approximately 3 times higher than those
for cellulose I samples. Moreover, the B value for
cellulose III
I
is very much lower than those for
cellulose I. These results indicate that the reason
for the higher rate of hydrolysis of cellulose III
I
by
Cel7A is the higher specific activity of the enzyme for
this crystalline polymorph, not the larger surface area
of the substrate.
0
300
600
900
1200
1500
1800
0 50 100 150 200 250 300 350
[Cellobiose] (µM)
Time (min)
Fig. 2. Time course of cellobiose concentration in the reaction mix-
tures of highly crystalline celluloses with Cel7A. j, Cellulose I
a
-rich;
d, cellulose I
b
; h, cellulose III
I
; s, cellulose I
b
¢. Highly crystalline
cellulose (0.1%, w ⁄ v) was incubated with 2.2 l
M Cel7A in 50 mM
sodium acetate (pH 5.0) at 30 °C. Cellobiose concentration in the
supernatant after termination of the reaction by centrifugation
(twice at 15 000 g for 5 min) was determined with the cellobiose
dehydrogenase–cytochrome c redox system as described [14].
0
0.5
1.0
1.5
2.0
2.5
3.0
3.5
0246810121416
Adsorbed Cel7A (nmol/mg-cellulose)
[Free Cel7A] (µ M)
Fig. 3. Enzyme concentration dependence of the amount of
adsorbed Cel7A. j, Cellulose I
a
-rich; d, cellulose I
b
; h, cellu-
lose III
I
; s, cellulose I
b
¢. Cel7A was incubated with 1 mgÆmL
)1
crys-
talline cellulose In 1 mL 50 m
M sodium acetate, pH 5.0, at 30 °C.
This figure shows adsorption of Cel7A after incubation for 120 min
as representative results of four time points (120, 180, 240, and
320 min). The lines indicate the fitting of the data to the two-bind-
ing-site model.
K. Igarashi et al. Hydrolysis of cellulose III
I
by cellobiohydrolase
FEBS Journal 274 (2007) 1785–1792 ª 2007 The Authors Journal compilation ª 2007 FEBS 1787
Discussion
In order to utilize cellulosic biomass for bioethanol
production or biorefining, effective hydrolysis of crys-
talline cellulose is critical, because % 70% of natural
cellulose is crystalline. However, the rate of degrada-
tion of cellulose I by cellulase is extremely low com-
pared with that of amorphous cellulose, possibly
because of its tightly packed structure [6]. There are
many pretreatment methods to enhance the hydrolyz-
ability of cellulosic biomass, and they generally include
a step for disrupting the crystal structure by physical
and ⁄ or chemical treatment. Among them, ammonia
treatment is a simple and effective method [15,16]. In
the present study, we used our surface density analysis
to analyze the enhanced hydrolysis of crystalline cellu-
lose following ammonia treatment, which converts cel-
lulose I into cellulose III
I
, and we show that
cellulose III
I
is an intrinsically activated form of cellu-
ose, which is highly susceptible to hydrolysis.
The adsorption of cellobiohydrolase on crystalline
cellulose is well described by a two-binding-site model
[13], and we proposed that the high-affinity and low-
affinity adsorption can be interpreted as productive
and nonproductive binding, respectively, based on the
two-domain structure of cellobiohydrolase and the q
dependence of cellobiose production [14]. In that
study, we mainly focused on the K
ad1
values to explain
the different hydrolytic rates of cellulose I
a
and I
b
.
However, the efficiency of high-affinity adsorption
(A
1
ÆK
ad1
) may also affect the activity when we evaluate
total cellobiose production in the reaction mixture, as
this value resembles catalytic efficiency (V
max
⁄ K
m
)in
the Michaelis–Menten model when Cel7A is produc-
tively bound on the surface of cellulose. A comparison
of adsorption parameters (Table 1) and cellobiose
Table 1. Adsorption parameters of Cel7A for highly crystalline celluloses. The adsorption parameters were calculated by nonlinear fitting of
the data after incubation in 50 m
M sodium acetate, pH 5.0, for 120, 180, 240, and 320 min. K
ad1
and K
ad2
are expressed as lM
)1
, A
1
, A
2
,
and A
max
as nmolÆ(mg cellulose)
)1
, and A
1
ÆK
ad1
and A
2
ÆK
ad2
as mlÆ(mg cellulose)
)1
.
K
ad1
K
ad2
A
1
A
2
A
max
A
1
ÆK
ad1
A
2
ÆK
ad2
Cellulose I
a
-rich 8.5 ± 0.7 0.44 ± 0.04 0.22 ± 0.02 2.0 ± 0.2 2.2 ± 0.2 1.9 0.88
Cellulose I
b
4.7 ± 0.4 0.43 ± 0.04 0.58 ± 0.03 2.1 ± 0.3 2.6 ± 0.3 2.7 0.90
Cellulose III
I
13 ± 2 0.27 ± 0.04 1.8 ± 0.5 1.8 ± 0.5 3.7 ± 1.0 23 0.49
Cellulose I
b
¢ 2.5 ± 0.5 0.22 ± 0.02 1.5 ± 0.1 2.0 ± 0.5 3.5 ± 0.6 3.7 0.44
Fig. 4. Surface density (q) dependence of cellobiose production (v)
from crystalline celluloses. j , Cellulose I
a
-rich; d, cellulose I
b
; h,
cellulose III
I
; s, cellulose I
b
¢. The plots were obtained from the
results after incubation for 120, 180, 240, and 320 min.
Fig. 5. Surface density (q) dependence of specific activity of
adsorbed Cel7A (k). j, Cellulose I
a
-rich; d, cellulose I
b
; h, cellu-
lose III
I
; s, cellulose I
b
¢. The plots were obtained from the results
after incubation for 120, 180, 240, and 320 min. The q and k values
were estimated as reported previously [14].
Table 2. The k value at q fi 0(k
0
) and reduction rate of k (B) for
hydrolysis of crystalline celluloses. These parameters were calcula-
ted from q–k plots in Fig. 5 using Eqn (1) as described in Experi-
mental procedures.
k
0
(min
)1
) B
Cellulose I
a
-rich 1.7 ± 0.1 2.5 ± 0.2
Cellulose I
b
1.2 ± 0.1 3.0 ± 0.2
Cellulose III
I
4.5 ± 0.4 1.3 ± 0.1
Cellulose I
b
¢ 1.4 ± 0.1 3.1 ± 0.2
Hydrolysis of cellulose III
I
by cellobiohydrolase K. Igarashi et al.
1788 FEBS Journal 274 (2007) 1785–1792 ª 2007 The Authors Journal compilation ª 2007 FEBS
production (Fig. 4) in the present study suggests that
the A
1
ÆK
ad1
values correlate with cellobiose production,
as larger A
1
ÆK
ad1
values are associated with greater
cellobiose production from cellulose III
I
. Although it
is still difficult to interpret the results quantitatively,
all our results are consistent with a correlation between
high-affinity adsorption and cellobiose production. The
three-dimensional structures of the CD and CBD of
Trichoderma Cel7A showed that this enzyme accom-
modates at least 10 glucose residues at the active-site
tunnel of the CD [18,19], whereas CBD binds to the
cellulose surface via hydrophobic interaction between
three tyrosine residues and glucose residues [20,21].
Therefore, it is reasonable that the productive binding
by both CD and CBD would involve very much higher
affinity than nonproductive binding, in which only the
CBD contributes to the adsorption. As far as we
know, the results observed in this study represent the
first evidence that the putative productive binding
mode is truly productive.
We previously reported that the specific activity of
adsorbed enzyme (k) is greatly influenced by the crys-
talline polymorphic form of the substrate. Moreover,
in the cases of cellulose I
b
from Halocynthia and
hydrothermally treated Cladophora, similar q–k plots
should be obtained if crystalline celluloses with the
same polymorphic form are used as substrates, because
the q value is independent of the surface area of each
sample. In the present study, although the rate of cell-
obiose production from cellulose I
b
¢ is higher than that
from cellulose I
b
(Fig. 4), the specific activity of the
adsorbed enzyme (Fig. 5) was almost the same with
cellulose I
b
and I
b
¢. These results can be interpreted as
indicating that the reason for the higher cellobiose pro-
duction from cellulose I
b
¢ than cellulose I
b
is the larger
amount of adsorption during hydrolysis, but not an
increase in specific activity. There are several studies
showing that conversion into cellulose III
I
decreases
the crystal size [22,23]. Therefore, treatment with
supercritical ammonia increases the surface area avail-
able for cellobiohydrolase (possibly the hydrophobic
surface) and thus increases the number of enzyme
molecules that can be adsorbed on the surface of cellu-
lose III
I
and I
b
¢ (Fig. 3 and Table 1).
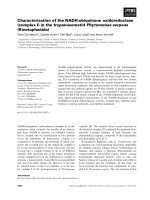
The recent synchrotron X-ray and neutron fiber dif-
fraction studies of crystalline celluloses [17,24,25] have
shown that cellulose III
I
has a one-chain monoclinic
unit cell with an asymmetric unit containing only one
glucosyl residue, and this is quite different from cellu-
lose I. The views from the hydrophobic surface and
from the nonreducing end of each chain are compared
among cellulose I
a
, cellulose I
b
, and cellulose III
I
in
Fig. 6. The structure of cellulose III
I
results in a lower
packing density than that of cellulose I, with a greater
distance between hydrophobic surfaces and a larger
volume of accessible cellobiose units in cellulose III
I
,
as shown in Table 3. Cel7A seems to recognize the
bulky, open structure of cellulose III
I
, based on the
Fig. 6. Views from the hydrophobic surfaces (upper) and from the nonreducing end (lower) of cellulose I
a
(left), cellulose I
b
(middle), and cel-
lulose III
I
(right). The cellulose chains in the top layer are superimposed and colored cyan. The chains in the other layer are colored yellow
(cellulose I
a
), green (cellulose I
b
), and magenta (cellulose III
I
). The structures are based on the results reported by Nishiyama et al. [24,25]
and Wada et al. [17].
K. Igarashi et al. Hydrolysis of cellulose III
I
by cellobiohydrolase
FEBS Journal 274 (2007) 1785–1792 ª 2007 The Authors Journal compilation ª 2007 FEBS 1789
order of hydrolysis (cellulose III
I
> > cellu-
lose I
a
> cellulose I
b
). In the previous study, we pro-
posed that Cel7A distinguishes between the first and
second layers of crystalline celluloses, as there is only
small difference in packing density between cellulose I
a
and I
b
[14]. The enhanced hydrolysis of cellulose III
I
observed in the present study indicates that the struc-
tural differences between cellulose I
a
and I
b
, i.e. differ-
ences of 0.02 A
˚
in the distance of hydrophobic
surfaces and 4 A
˚
3
in the volume of the cellobiose unit,
are sufficient to explain the different hydrolytic charac-
teristics. It is still uncertain how the crystalline poly-
morphic forms of cellulose affect the activity of
cellobiohydrolase. However, we found that there was
no significant difference in the hydrolytic rates of other
fungal cellobiohydrolases when highly crystalline cellu-
loses were used as substrates (data not shown). This
result indicates that the rate-limiting step of hydrolysis
is related to the crystalline form of cellulose, rather
than the characteristics of the cellobiohydrolase. Gen-
eration of activated cellulose III
I
, which is highly sus-
ceptible to cellobiohydrolase, seems to be the key to
the effective hydrolysis of crystalline celluloses.
Experimental procedures
Preparations of crystalline celluloses
Cellulose I
a
-rich and cellulose I
b
(without ammonia treat-
ment) samples were prepared from Cladophora sp. as des-
cribed previously [14,26–28]. Cellulose III
I
was prepared by
supercritical ammonia treatment of Cladophora as described
previously [29,30]. Cladophora samples treated with super-
critical ammonia were further subjected to hydrothermal
treatment in water at 160 °C for 30 min to generate cellu-
lose I
b
¢ [27]. Scheme 1 shows an overview of the prepar-
ation of these samples.
Enzyme preparations and assays
Cel7A (formerly known as cellobiohydrolase I) from
Trichoderma viride was purified from a commercial cellulase
mixture, Meicelase (Meiji Seika Kaisha Co., Ltd, Tokyo,
Japan) by three-step column chromatography as described
previously [31,32]. The purity of the enzyme was confirmed
by both electrophoresis and activity measurement. Crystal-
line cellulose samples (0.1% w ⁄ v) were incubated with var-
ious concentrations of enzyme (Abs
280
¼ 0.04–1.6) in 1 mL
50 mm sodium acetate, pH 5.0, at 30 °C, and the reaction
was terminated by centrifugation (15 000 g for 30 s). The
absorbance at 280 nm of the supernatant was measured
after the termination of the enzymatic reaction, and the
concentration of free enzyme was determined using an
absorption coefficient at 280 nm of 88 250 m
)1
Æcm
)1
for
T. viride Cel7A to estimate the amount of adsorbed Cel7A
on crystalline celluloses [A; nmolÆ(mg cellulose)
)1
] as des-
cribed in the previous report [14]. To estimate cellobiose
concentration in the supernatant, recombinant cellobiose
dehydrogenase and cytochrome c were used as described
previously [14,33].
Surface density analysis
The parameters required for surface density analysis, i.e.
maximum high-affinity (A
1
) and low-affinity (A
2
) adsorp-
tions [nmolÆ(mg cellulose)
)1
], maximum adsorption
(A
max
¼ A
1
+ A
2
), constants for high-affinity (K
ad1
) and
low-affinity (K
ad2
) adsorptions, surface density (q ¼
A ⁄ A
max
), rate of cellobiose production (v; lmÆmin
)1
), and
specific activity of adsorbed enzyme (k ¼ v ⁄ A; min
)1
),
were calculated and estimated according to previous
reports [14,34,35]. As a linear relationship was observed
between q and ln k, the k value at q fi 0(k
0
) and the
rate of reduction of k (B) were estimated using the fol-
lowing equation:
k ¼ k
0
expðÀBqÞð1Þ
It should be pointed out that we use Eqn (1) only for esti-
mating k
0
and B for comparison of the hydrolytic rates
for crystalline cellulose samples. We do not imply any
physical interpretation of the equation or the constants, as
they are empirical. The parameters were determined using
DeltaGraph (version 5.5.1; SPSS Inc. and Red Rock Soft-
ware, Inc.) and KaleidaGraph
TM
(version 3.6.4 Synergy
Software).
Acknowledgements
This research was supported by a Grant-in-Aid for Sci-
entific Research to M.S. (no. 17380102) from the Jap-
anese Ministry of Education, Culture, Sports and
Technology, and by a grant for ‘Evaluation, Adapta-
tion and Mitigation of Global Warming in Agricul-
ture, Forestry and Fisheries: Research and
Development’ from the Japanese Ministry of Agricul-
ture, Forestry and Fisheries.
Table 3. Distance between hydrophobic surfaces and volume occu-
pied by a cellobiose unit in highly crystalline celluloses.
Distance between
hydrophobic surfaces
(A
˚
)
Volume of
cellobiose unit
(A
˚
3
)
Cellulose I
a
3.91 333
Cellulose I
b
3.89 329
Cellulose III
I
4.27 347
Hydrolysis of cellulose III
I
by cellobiohydrolase K. Igarashi et al.
1790 FEBS Journal 274 (2007) 1785–1792 ª 2007 The Authors Journal compilation ª 2007 FEBS
References
1 Atalla RH & Vanderhart DL (1984) Native cellulose. A
composite of two distinct crystalline forms. Science 223,
283–285.
2 Sugiyama J, Vuong R & Chanzy H (1991) Electron dif-
fraction study on the two crystalline phases occurring in
native cellulose from an algal cell-wall. Macromolecules
24, 4168–4175.
3 Vanderhart DL & Atalla RH (1984) Studies of micro-
structure in native celluloses using solid-state
13
C NMR.
Macromolecules 17, 1465–1472.
4 Hayashi N, Sugiyama J, Okano T & Ishihara M (1997)
The enzymatic susceptibility of cellulose microfibrils of
the algal-bacterial type and the cotton-ramie type.
Carbohydr Res 305 , 261–269.
5 Hayashi N, Sugiyama J, Okano T & Ishihara M (1997)
Selective degradation of the cellulose I
a
component in
Cladophora cellulose with Trichoderma viride cellulase.
Carbohydr Res 305 , 109–116.
6 Teeri TT (1997) Crystalline cellulose degradation: new
insight into the function of cellobiohydrolases. Trends
Biotechnol 15, 160–167.
7 Abuja PM, Schmuck M, Pilz I, Tomme P, Claeyssens
M & Esterbauer H (1988) Structural and functional
domains of cellobiohydrolase I from Trichoderma reesei.
A small angle X-ray scattering study of the intact
enzyme and its core. Eur Biophys J 15, 339–342.
8 Johansson G, Sta
˚
hlberg J, Lindeberg G, Engstrom A &
Pettersson G (1989) Isolated fungal cellulase terminal
domains and a synthetic minimum analog bind to cellu-
lose. FEBS Lett 243, 389–393.
9 Shoemaker S, Schweickart V, Ladner M, Gelfand D,
Kwok S, Myambo K & Innis M (1983) Molecular
cloning of exo-cellobiohydrolase I derived from Tricho-
derma reesei Strain-L27. Bio ⁄ Technology 1, 691–696.
10 Tomme P, Van Tilbeurgh H, Pettersson G, Van Damme
J, Vandekerckhove J, Knowles J, Teeri T & Claeyssens
M (1988) Studies of the cellulolytic system of Tricho-
derma reesei QM 9414. Analysis of domain function in
two cellobiohydrolases by limited proteolysis. Eur J
Biochem 170, 575–581.
11 Lee YH & Fan LT (1982) Kinetic studies of enzymatic
hydrolysis of insoluble cellulose: analysis of the initial
rates. Biotechnol Bioeng 24, 2383–2406.
12 Lee YH & Fan LT (1983) Kinetic studies of enzymatic
hydrolysis of insoluble cellulose. II. Analysis of
extended hydrolysis times. Biotechnol Bioeng 25,
939–966.
13 Sta
˚
hlberg J, Johansson G & Pettersson G (1991) A new
model for enzymatic hydrolysis of cellulose based on
the two-domain structure of cellobiohydrolase I.
Bio ⁄ Technology 9, 286–290.
14 Igarashi K, Wada M, Hori R & Samejima M (2006)
Surface density of cellobiohydrolase on crystalline cellu-
loses. A critical parameter to evaluate enzymatic
kinetics at a solid–liquid interface. FEBS J 273, 2869–
2878.
15 Perez DD, Montanari S & Vignon MR (2003) TEMPO-
mediated oxidation of cellulose III. Biomacromolecules
4, 1417–1425.
16 Klemm D, Philipp B, Heinze T, Heinze U & Wagen-
knecht W (eds) (1998) General considerations on struc-
ture and reactivity of cellulose. In Comprehensive
Cellulose Chemistry, pp. 152–154. Wiley-VCH-Verlag
GmbH, New York.
17 Wada M, Chanzy H, Nishiyama Y & Langan P (2004)
Cellulose III
I
crystal structure and hydrogen bonding by
synchrotron X-ray and neutron fiber diffraction. Macro-
molecules 37, 8548–8555.
18 Divne C, Sta
˚
hlberg J, Reinikainen T, Ruohonen L,
Pettersson G, Knowles JK, Teeri TT & Jones TA
(1994) The three-dimensional crystal structure of the
catalytic core of cellobiohydrolase I from Trichoderma
reesei. Science 265, 524–528.
19 Divne C, Sta
˚
hlberg J, Teeri TT & Jones TA (1998)
High-resolution crystal structures reveal how a cellulose
chain is bound in the 50 A
˚
long tunnel of cellobiohydro-
lase I from Trichoderma reesei. J Mol Biol 275,
309–325.
20 Kraulis J, Clore GM, Nilges M, Jones TA, Pettersson
G, Knowles J & Gronenborn AM (1989) Determination
of the three-dimensional solution structure of the
C-terminal domain of cellobiohydrolase I from Tricho-
derma reesei. A study using nuclear magnetic resonance
and hybrid distance geometry-dynamical simulated
annealing. Biochemistry 28, 7241–7257.
21 Linder M, Mattinen ML, Kontteli M, Lindeberg G,
Stahlberg J, Drakenberg T, Reinikainen T, Pettersson G
& Annila A (1995) Identification of functionally impor-
tant amino acids in the cellulose-binding domain of
Trichoderma reesei cellobiohydrolase I. Protein Sci 4,
1056–1064.
22 Sugiyama J, Harada H & Saiki H (1987) Crystalline
morphology of Valonia macrophysa cellulose III
I
revealed by direct lattice imaging. Int J Biol Macromol
9, 122–130.
23 Lewin M & Roldan LG (1971) Effect of liquid anhy-
drous ammonia in structure and morphology of cotton
cellulose. J Polym Sci C 36, 213–229.
24 Nishiyama Y, Langan P & Chanzy H (2002) Crystal
structure and hydrogen-bonding system in cellulose I
b
from synchrotron X-ray and neutron fiber diffraction.
J Am Chem Soc 124, 9074–9082.
25 Nishiyama Y, Sugiyama J, Chanzy H & Langan P
(2003) Crystal structure and hydrogen bonding system
in cellulose I
a
from synchrotron X-ray and neutron fiber
diffraction. J Am Chem Soc 125, 14300–14306.
26 Sugiyama J, Persson J & Chanzy H (1991) Combined
infrared and electron diffraction study of the
K. Igarashi et al. Hydrolysis of cellulose III
I
by cellobiohydrolase
FEBS Journal 274 (2007) 1785–1792 ª 2007 The Authors Journal compilation ª 2007 FEBS 1791
polymorphism of native celluloses. Macromolecules 24,
2461–2466.
27 Yamamoto H, Horii F & Odani H (1989) Structural
changes of native cellulose crystals induced by annealing
in aqueous alkaline and acidic solutions at high tem-
peratures. Macromolecules 22, 4130–4132.
28 Araki J, Wada M, Kuga S & Okano T (1998) Flow
properties of microcrystalline cellulose suspension
prepared by acid treatment of native cellulose. Colloid
Surface A 142, 75–82.
29 Wada M, Heux L, Isogai A, Nishiyama Y, Chanzy H &
Sugiyama J (2001) Improved structural data of cellulose
III
I
prepared in supercritical ammonia. Macromolecules
34, 1237–1243.
30 Wada M, Nishiyama Y & Langan P (2006) X-ray struc-
ture of ammonia-cellulose I: new insights into the
conversion of cellulose I to cellulose III.
Macromolecules 39, 2947–2952.
31 Imai T, Boisset C, Samejima M, Igarashi K & Sugiyama
J (1998) Unidirectional processive action of cellobiohy-
drolase Cel7A on Valonia cellulose microcrystals. FEBS
Lett 432, 113–116.
32 Samejima M, Sugiyama J, Igarashi K & Eriksson KEL
(1997) Enzymatic hydrolysis of bacterial cellulose. Car-
bohydr Res 305, 281–288.
33 Yoshida M, Ohira T, Igarashi K, Nagasawa H, Aida K,
Hallberg BM, Divne C, Nishino T & Samejima M
(2001) Production and characterization of recombinant
Phanerochaete chrysosporium cellobiose dehydrogenase
in the methylotrophic yeast Pichia pastoris. Biosci
Biotechnol Biochem 65, 2050–2057.
34 Va
¨
ljama
¨
e P, Sild V, Pettersson G & Johansson G (1998)
The initial kinetics of hydrolysis by cellobiohydrolases I
and II is consistent with a cellulose surface-erosion
model. Eur J Biochem 253, 469–475.
35 Kipper K, Va
¨
ljama
¨
e P & Johansson G (2005) Processive
action of cellobiohydrolase Cel7A from Trichoderma
reesei is revealed as ‘burst’ kinetics on fluorescent poly-
meric model substrates. Biochem J 385, 527–535.
36 Nishiyama Y, Kuga S, Wada M & Okano T (1997)
Cellulose microcrystal film of high uniaxial orientation.
Macromolecules 30, 6395–6397.
Hydrolysis of cellulose III
I
by cellobiohydrolase K. Igarashi et al.
1792 FEBS Journal 274 (2007) 1785–1792 ª 2007 The Authors Journal compilation ª 2007 FEBS