Tài liệu Báo cáo khoa học: Implication of the glutamine synthetase ⁄glutamate synthase pathway in conditioning the amino acid metabolism in bundle sheath and mesophyll cells of maize leaves doc
Bạn đang xem bản rút gọn của tài liệu. Xem và tải ngay bản đầy đủ của tài liệu tại đây (672.17 KB, 14 trang )
Implication of the glutamine synthetase ⁄glutamate
synthase pathway in conditioning the amino acid
metabolism in bundle sheath and mesophyll cells of
maize leaves
´ `
Marie-Helene Valadier1, Ayako Yoshida2, Olivier Grandjean3, Halima Morin3, Jocelyne
´
Kronenberger3, Stephanie Boutet1, Adeline Raballand1, Toshiharu Hase2, Tadakatsu Yoneyama4
and Akira Suzuki1
1
2
3
4
´
´
Unite de Nutrition Azotee des Plantes, Institut National de la Recherche Agronomique, Versailles, France
Institute for Protein Research, Osaka University, Japan
Laboratoire Commun de Cytologie, Institut National de la Recherche Agronomique, Versailles, France
Department of Applied Biological Chemistry, University of Tokyo, Japan
Keywords
amino acid translocation; compartmentation;
glutamine and glutamate synthesis; nitrogen
assimilation; Zea mays L
Correspondence
´
´
A. Suzuki, Unite de Nutrition Azotee des
Plantes, Institut National de la Recherche
Agronomique, Route de St-Cyr, 78026
Versailles cedex, France
Fax: +33 1 30 83 30 96
Tel: +33 1 30 83 30 87
E-mail:
(Received 20 February 2008, revised 16
April 2008, accepted 17 April 2008)
doi:10.1111/j.1742-4658.2008.06472.x
We investigated the role of glutamine synthetases (cytosolic GS1 and chloroplast GS2) and glutamate synthases (ferredoxin-GOGAT and NADHGOGAT) in the inorganic nitrogen assimilation and reassimilation into
amino acids between bundle sheath cells and mesophyll cells for the remobilization of amino acids during the early phase of grain filling in Zea mays
L. The plants responded to a light ⁄ dark cycle at the level of nitrate, ammonium and amino acids in the second leaf, upward from the primary ear,
which acted as the source organ. The assimilation of ammonium issued
from distinct pathways and amino acid synthesis were evaluated from the
diurnal rhythms of the transcripts and the encoded enzyme activities of
nitrate reductase, nitrite reductase, GS1, GS2, ferredoxin-GOGAT,
NADH-GOGAT, NADH-glutamate dehydrogenase and asparagine synthetase. We discerned the specific role of the isoproteins of ferredoxin and
ferredoxin:NADP+ oxidoreductase in providing ferredoxin-GOGAT with
photoreduced or enzymatically reduced ferredoxin as the electron donor.
The spatial distribution of ferredoxin-GOGAT supported its role in the
nitrogen (re)assimilation and reallocation in bundle sheath cells and
mesophyll cells of the source leaf. The diurnal nitrogen recycling within the
plants took place via the specific amino acids in the phloem and xylem
exudates. Taken together, we conclude that the GS1 ⁄ ferredoxin-GOGAT
cycle is the main pathway of inorganic nitrogen assimilation and recycling
into glutamine and glutamate, and preconditions amino acid interconversion and remobilization.
In the C4 plant maize, inorganic nitrate reduction to
ammonium and subsequent ammonium assimilation
into amino acids occur in two different photosyn-
thetic cells: bundle sheath cells (BSCs) and mesophyll
cells (MCs). Nitrate taken up by roots moves in
part, via the vascular bundle, to leaves for reduction.
Abbreviations
AS, asparagine synthetase (EC 6.3.5.4); BSC, bundle sheath cells; DIG, digoxigenin; Fd, ferredoxin; Fd-NiR, ferredoxin-nitrite reductase
(EC 1.6.6.4); FNR, ferredoxin:NADP+ oxidoreductase (EC 1.18.1.2); GDH, glutamate dehydrogenase; GOGAT, glutamate synthase
(Fd-GOGAT, EC 1.4.7.1; GS, glutamine synthetase (EC 6.1.1.3); MC, mesophyll cells; NADH-GOGAT, EC 1.4.1.14); NR, nitrate reductase
(EC 1.6.6.1); PS I (II), photosystem I (II).
FEBS Journal 275 (2008) 3193–3206 ª 2008 The Authors Journal compilation ª 2008 FEBS
3193
Amino acid metabolism and translocation
M.-H. Valadier et al.
In leaves, nitrate is reduced to ammonium by cytosolic nitrate reductase (NR; EC 1.6.6.1), and then by
plastidial
ferredoxin-nitrite
reductase
(Fd-NiR,
EC 1.6.6.4) [1]. Ammonium, also derived from photorespiration, is assimilated first into the glutamineamide group by glutamine synthetase (cytosolic
GS1 and plastidial GS2, EC 6.3.1.2) and then into
glutamate-amino group by glutamate synthase (FdGOGAT, EC 1.4.7.1; NADH-GOGAT, EC 1.4.1.14)
in vegetative organs. GS1 is encoded by five genes in
maize, and the regulation and function of each gene
have been elucidated in part [2–4]. Ammonium and
glutamine-amide group are also assimilated into
asparagine by asparagine synthetases (ASs; ammonia
ligase AS, EC 6.3.1.1; glutamine hydrolyase AS,
EC 6.3.5.4). Alternatively, mitochondrial NADH-glutamate dehydrogenase (NADH-GDH, EC 1.4.1.2)
can incorporate high levels of ammonium into glutamate under stress [5].
Nitrogen assimilation and amino acid synthesis
require reductants and ATP. Fd and Fd:NADP+ oxidoreductase (FNR, EC 1.18.1.2) occupy a central position to mediate chloroplast electron flow to yield
reducing equivalents [6]. The nitrogen metabolism
between BSCs and MCs depends on the efficient distribution of energy between photosystem I (PS I) and
photosystem II (PS II) via the electron flow specific to
the two cell types. As a result, inorganic nitrogen
assimilation into amino acids is tightly correlated with
photosynthesis. Furthermore, light at low fluence
entrains circadian rhythms and plays an essential role
for molecular signalling in the expression of the genes
and encoded enzymes involved in nitrate assimilation
and amino acid synthesis [7].
The stalk and leaves below and above the ear act
as the source organs for nitrogen reallocation in the
reproductive stage of maize [8,9]. In the source
leaves, it has been postulated that the metabolic shift
from the GS2 ⁄ GOGAT cycle to the GS1 ⁄ GDH
pathway is responsible for ammonium assimilation
into glutamine and glutamate, as a result of a
decline in GS2 and the induction of the a-GDH
subunit (for a review, see [10]). However, the role of
GDH is controversial [11–14], and the regulation
and function of GOGATs in nitrogen remobilization
remain to be evaluated. In this study, we examined
the diurnal responses of the plants, which provide
valuable cues to nitrogen and carbon metabolism
[7,15]. We assessed the role of the GS ⁄ GOGAT cycle
in the nitrogen assimilation between MCs and BSCs
in the amino acid synthesis and remobilization during the early phase of grain filling in Zea mays L.
3194
Results
High levels of glutamate and glutamate
derivatives in reproductive leaves
Leaves above and below the ear act as sources to
export nitrogen resources to sink organs via vascular
bundles. In order to examine the nitrogen status in the
leaves, we determined the inorganic nitrogen and
amino acid contents in the second leaf above the ear
every 3 h during a 16 h light ⁄ 8 h dark cycle. The
nitrate content was high during the second half of the
light phase and remained at about 16 lmolỈ(g fresh
weight))1 (Fig. 1A). Ammonium accumulated in the
middle of the light phase up to 6 lmolỈ(g fresh
weight))1, indicating that a part of the ammonium was
not assimilated in the light (Fig. 1B). The major amino
acids in the leaves were alanine (26–39%), glycine
(26–40%), glutamic acid (6–14%), serine (8–12%) and
aspartic acid (4–16%) in both the light and dark
(Fig. 1, Table 1). Following ammonium accumulation,
glutamine increased about four-fold in the light
(Fig. 1C). In contrast, asparagine remained at a fairly
constant level in the light and dark (Fig. 1E, Table 1).
The increase in ammonium was inversely correlated
with the decline in glutamic acid and aspartic acid in
the light (Fig. 1B,D,F).
Expression of the genes involved in nitrogen
assimilation
Light is a signal that regulates nitrogen metabolism,
and nitrogen assimilation into amino acids is tightly
correlated with the expression of the genes involved
[15]. Thus, we analysed the diurnal expression of the
genes encoding the enzymes of nitrogen assimilation in
the second leaf above the ear every 3 h during a 16 h
light ⁄ 8 h dark cycle. Total mRNAs were isolated and
estimated on the basis of equal total amounts of 18S
rRNA as the internal standard (data not shown). We
measured the NR transcripts as an additional control,
as the light regulation of NR expression has been
defined in maize and several plant species. The NR
mRNAs peaked at 6 h during the dark to light transition, and then decreased to undetectable levels (Fig. 2).
Similar diurnal patterns have been reported for other
plant NRs [15–17].
Gln1-1, encoding the main form of cytosolic GS1
in leaves [2], was strongly expressed, and slightly
smaller signals were detected for the Gln1-2 and
Gln1-3 mRNAs. In contrast, strong expression of
Gln1-4 was observed, as also reported in [3]. The
FEBS Journal 275 (2008) 3193–3206 ª 2008 The Authors Journal compilation ª 2008 FEBS
M.-H. Valadier et al.
Amino acid metabolism and translocation
Nitrate
B8
Amount µmol·g–1 FW
20
Amount µmol·g–1 FW
10
5
0
3
6
9
4
2
12 15 18 21 24
Glu
D
20
Relative amount %
6
0
0
0
3
6
9
Asn
E
2.5
2.0
1.5
1.0
0.5
0.0
12 15 18 21 24
0
3
6
9
12 15 18 21 24
Asp
F
20
0.6
15
15
0.4
10
10
0.2
5
5
0
0
0.0
0
3
6
9
12 15 18 21 24
Ala
G
0
3
6
9
H
12 15 18 21 24
Gly
50
Relative amount %
C
Relative amount %
25
15
Gln
Ammonium
A
20
10
9
12
15
18
21
24
9 12 15 18
Time of day (h)
21
24
Ser
30
20
6
40
30
3
I
50
40
0
10
15
10
5
0
0
0
0
3
6
9 12 15 18 21 24
Time of day (h)
0
3
6
9 12 15 18 21 24
Time of day (h)
0
3
6
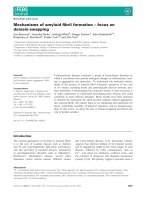
Fig. 1. Levels of nitrate (A), ammonium (B) and amino acids (C–I) in maize leaves collected every 3 h during a 16 h light ⁄ 8 h dark cycle.
Nitrate and ammonium contents represent the mean from five independent plants ± standard error. Amino acid contents are expressed as a
percentage relative to the total free amino acid contents, which represent the mean [lmolỈ(g fresh weight))1] from five independent
plants ± standard error as follows: 17.9 ± 1.1 (3 h), 19.8 ± 1.2 (6 h), 25.4 ± 1.6 (9 h), 23.4 ± 1.4 (12 h), 18.9 ± 1.2 (15 h), 29.4 ± 1.9 (18 h),
36.0 ± 2.2 (21 h) and 28.0 ± 1.8 (24 h). The standard errors for individual amino acid contents are of the same order of magnitude as those
of the total amino acid contents for glutamine (C), glutamic acid (D), asparagine (E), aspartic acid (F), alanine (G), glycine (H) and serine (I).
Grey boxes indicate the dark phase.
GS1 genes (Gln1-1 to Gln1-4) were expressed in a
similar diurnal rhythm with an increase in the dark
to a maximum at 12 h, and then barely detectable
(Fig. 2). The Gln2 mRNAs were low, peaking early
in the light phase and persisting longer than the
Gln1 mRNAs (Fig. 2). The GLU mRNAs for
Fd-GOGAT were found at the highest level at 6 h,
similar to the Gln2 mRNAs (Fig. 2). The NADHGOGAT mRNAs could not be detected in our assay
conditions. As GDH genes are expressed at high
levels in reproductive plant leaves [18], we also
measured gdh expression. Maize NADH-GDH is
encoded by gdh1 and gdh2 for the b-subunit and
a-subunit, respectively. This gdh1 is phylogenetically
related to tomato gdh1, whose b-homohexamer complexes appear to oxidize glutamate in transgenic
tobacco [14]. The gdh1 mRNAs accumulated on
illumination, reaching a maximum level at 12 h, and
FEBS Journal 275 (2008) 3193–3206 ª 2008 The Authors Journal compilation ª 2008 FEBS
3195
Amino acid metabolism and translocation
M.-H. Valadier et al.
Table 1. Amino acid composition in leaves, and amino acid percentage ratio in the phloem exudates and leaves and xylem bleeding sap and
leaves in the light and dark. The amino acid composition in leaves is expressed as a percentage relative to the total amino acid contents,
which represent the mean [lmolỈ(g fresh weight))1] from five independent plants ± standard error as follows: 25.48 ± 1.58 (light) and
21.90 ± 1.93 (dark). The standard errors for the individual amino acid contents are of the same order of magnitude as those of the total
amino acid contents. Phloem exudates and xylem sap were collected over a 16 h light ⁄ 8 h dark cycle.
% in phloem exudates ⁄ %
in leaves
Leaves (%)
% in xylem sap ⁄ % in
leaves
Light
Dark
Light
Dark
Light
Dark
Glutamine
Glutamate
Asparagine
Aspartate
Alanine
Glycine
Serine
1.1
9.7
0.3
5.9
32.7
32.4
10.4
0.5
13.8
0.3
12.4
28.4
26.0
10.4
15.7
1.7
12.4
1.5
0.7
< 0.1
0.9
24.9
1.7
17.6
1.3
0.3
0.1
1.2
27.8
< 0.1
98.8
< 0.1
0.5
< 0.1
0.7
84.3
0.2
76.1
0.3
0.4
< 0.1
0.7
100
6
9 12 15 18 21 24
3
6
50
0
9 12 15 18 21 24
100
3
6
0
Fd II
50
9 12 15 18 21 24
6
3
6
9 12 15 18 21 24
Time of day (h)
50
0
6
6
9 12 15 18 21 24
Time of day (h)
6
9 12 15 18 21 24
3
6
9 12 15 18 21 24
3
6
50
0
6
9 12 15 18 21 24
100
50
50
0
0
3
3
50
0
9 12 15 18 21 24
100
L-FNR 1
Fd VI
0
9 12 15 18 21 24
100
3
100
50
3
50
9 12 15 18 21 24
6
100
0
3
100
3
100
0
6
9 12 15 18 21 24
50
0
9 12 15 18 21 24
100
50
6
100
GLU
Gln2
50
Gln1-3
3
100
50
0
0
3
gdh1
9 12 15 18 21 24
Fd III
6
50
L-FNR 2
3
3
Fd V
relative amount %
50
0
0
0
Gln1-2
Gln1-1
50
100
100
100
100
Fd I
ASN
relative amount
%
Gln1-4
relative amount
%
NR
relative amount
%
Amino acid
3
6
9 12 15 18 21 24
Time of day (h)
9 12 15 18 21 24
Time of day (h)
Fig. 2. Levels of the transcripts for NR (NR), cytosolic GS1 (Gln1-1, Gln1-2, Gln1-3, Gln1-4), chloroplast GS2 (Gln2), Fd-GOGAT (GLU), GDH
(gdh1), AS (ASN), Fd (Fd I, Fd II, Fd III, Fd V, Fd VI) and leaf FNR (L-FNR 1 and L-FNR 2) in maize leaves. The mRNAs were estimated by
RT-PCR using an equal amount of total RNA from each sample, collected every 3 h during a 16 h light ⁄ 8 h dark cycle. The time of day corresponds to the light phase (6–22 h) and dark phase (22–6 h). The values represent the mean from five independent plants mixed together
and expressed as a percentage relative to the maximum.
a second peak appeared at the beginning of the dark
phase (Fig. 2). The gdh2 mRNAs could not be
detected under our assay conditions. The ASN gene
for maize AS belongs to the light-inducible genes,
3196
such as monocot rice ASN and Arabidopsis ASN2
and ASN3 [19]. The level of ASN mRNAs was
higher in the dark and decreased to about 70% in
the middle of the light phase (Fig. 2).
FEBS Journal 275 (2008) 3193–3206 ª 2008 The Authors Journal compilation ª 2008 FEBS
M.-H. Valadier et al.
Amino acid metabolism and translocation
GOGATs in the later light phase. This contrasts with
the diurnally active Fd-GOGAT and NADH-GOGAT
in developing maize seedlings, in which GOGATs cope
with large amounts of primary and photorespiratory
ammonium [22]. Interestingly, there was a substantial
increase in NADH-GOGAT activity at the end of the
light phase (Fig. 3E). Fairly high and constant activities were detected for GDH in both the synthesis and
deamination of glutamate (Fig. 3F).
In vitro activities of nitrogen assimilation into
amino acids
The in vitro activities of the key enzymes of nitrogen
assimilation were determined. NR displayed a delayed
light-induced activity compared with its mRNA abundance (Fig. 3A). We detected a lower activity of NiR
than NR, and the primary nitrate reduction to nitrite
and then to ammonium took place potentially at rates
of 4–9 and 1.5–2 lmolỈh)1Ỉ(g fresh weight))1, respectively (Fig. 3A,B). There was a small change in NiR
activity, with a 25% decrease early in the light phase
(Fig. 3B), as observed in other plants [20]. The total
GS activity remained fairly constant at 30 lmolỈh)1Ỉ(g
fresh weight))1 (Fig. 3C). Because the activity ratio of
GS1 to GS2 reaches 20 in stalks at similar maturity
after anthesis [21], it is probably cytosolic GS1, which
assimilates ammonium during a day ⁄ night cycle.
Fd-GOGAT is the primary form in the source leaves,
accounting for 90% of total GOGAT activity, with the
rest being NADH-GOGAT (Fig. 3D,E). Both Fd-GOGAT and NADH-GOGAT were induced at the end of
the dark phase, peaked at the dark ⁄ light transition,
and then became undetectable. The patterns indicate
that there was no further nitrogen flux through the
NR
A
NiR
2
6
4
EDTA
2
Mg2+
0
0
3
6
D
Fd-GOGAT
1.5
1
0.5
0
9 12 15 18 21 24
40
µmol·h–1·g–1 FW
8
0
3
6
E
12
9
NADH-GOGAT
6
4
2
0
3
6
9 12 15 18 21 24
Time of day (h)
10
0
3
6
9
12 15 18 21 24
GDH
25
1
0.5
0
0
20
F
µmol·h–1·g–1 FW
µmol·h–1·g–1 FW
8
30
0
12 15 18 21 24
1.5
10
GS
C
2.5
µmol·h–1·g–1 FW
Activity
µmol·h–1·g–1 FW
Ammonium assimilation into glutamine by GSs (GS1
and GS2) occurs in the two cell types [23], but the
localization of the major Fd-GOGAT between MCs
and BSCs remains controversial [24]. Therefore, we
first determined the cellular and subcellular localization
of Fd-GOGAT. Fd-GOGAT mRNAs were hybridized
in situ with the digoxigenin (DIG)-labelled antisense
GLU mRNA probe. Staining was found in the cytoplasmic layers of BSCs (Fig. 4A). No positive staining
was detected in the BSCs using the control sense probe
(Fig. 4B). The localization of GLU mRNAs in the
vicinity of the vascular bundle of BSCs suggests a role
of Fd-GOGAT in amino acid translocation. Therefore,
B
10
Activity
µmol·h–1·g–1 FW
Localization of Fd-GOGAT
0
3
6
9
12 15 18 21 24
Time of day (h)
20
15
Amination
Deamination
10
5
0
0
3
6
9 12 15 18 21 24
Time of day (h)
Fig. 3. Enzyme activities of NR (A), NiR (B), GS (C), Fd-GOGAT (D), NADH-GOGAT (E) and NADH-GDH and NAD-GDH (F) in maize leaves
collected every 3 h during a 16 h light ⁄ 8 h dark cycle. The NR assay was carried out in a reaction mixture in the presence of 10 mM MgCl2
(Mg2+) or 5 mM EDTA (EDTA) for the divalent cation-dependent activity and maximum catalytic activity, respectively. The GDH activity was
assayed for NADH-dependent glutamate synthetic activity (amination) and NAD+-dependent glutamate oxidation activity (deamination). Error
bars represent the standard error from five independent plants. Grey boxes indicate the dark phase.
FEBS Journal 275 (2008) 3193–3206 ª 2008 The Authors Journal compilation ª 2008 FEBS
3197
Amino acid metabolism and translocation
A
M.-H. Valadier et al.
A
B
BSC
B
BSC
BSC
MC
MC
chl
D
C
MC
chl
MC
F
BSC
BSC
MC
MC
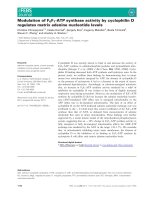
Fig. 4. In situ hybridization of GLU mRNA for Fd-GOGAT and ASN
mRNA for AS in thin sections of 21-day-old maize leaves. (A) Leaf
bundle sheath cell section using an antisense GLU mRNA probe.
(B) Control leaf bundle sheath cell section using a sense GLU
mRNA probe. (C) Leaf mesophyll cell section using an antisense
GLU mRNA probe. (D) Control leaf mesophyll cell section using a
sense GLU mRNA probe. (E) Leaf section using an antisense ASN
mRNA probe. (F) Control leaf section using a sense ASN mRNA
probe. BSC, bundle sheath cell; chl, chloroplast; MC, mesophyll
cell. Bar: 10 lm.
in situ mRNA hybridization was carried out for cytosolic AS, which provides asparagine for nitrogen transport. The signal was found in the cytoplasm of BSCs
in a ring around the vascular bundle with the antisense
ASN mRNA probe (Fig. 4E). Staining was not
detected with the control probe (Fig. 4F). Furthermore, the signal was also found on the surface of MC
chloroplasts in the cytoplasmic layers (Fig. 4C). No
positive staining was observed with the control probe
in MCs, and chloroplasts appeared to be pink against
a pale background (Fig. 4D).
The cellular and subcellular localization of Fd-GOGAT peptide was determined in leaf sections by the
indirect immunofluorescence method, as described in
[13]. Using a confocal laser scanning microscope, specific immunofluorescence was found in the chloroplasts
of BSCs (Fig. 5A). No fluorescence was detected using
nonimmune serum as a primary antibody (Fig. 5B).
3198
chl
MC
MC
E
chl
D
C
chl
chl
BSC
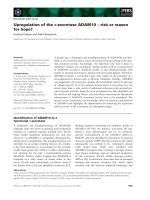
Fig. 5. Immunocytochemical localization of Fd-GOGAT in thin sections of 21-day-old maize leaves. (A) Leaf bundle sheath cell and
vascular bundle section using antibody against Fd-GOGAT as the
primary antibody. (B) Control leaf bundle sheath cell and vascular
bundle section using nonimmune serum as the primary antibody.
(C) Leaf mesophyll cell section using antibody against Fd-GOGAT
as the primary antibody. (D) Control leaf mesophyll cell section
using nonimmune serum as the primary antibody. BSC, bundle
sheath cell; chl, chloroplast; MC, mesophyll cell. Bar: 10 lm.
Higher magnification of MCs showed that the Fd-GOGAT proteins were localized to the chloroplasts
(Fig. 5C). No signal was detected with nonimmune
serum as the primary antibody (Fig. 5D).
Expression of the genes involved in chloroplast
electron transport
Although the GS ⁄ Fd-GOGAT pathway was found to
be distributed between BSCs and MCs, the Fd-dependent electron donor to the enzyme in BSC chloroplasts
is not well understood. Therefore, we determined the
transcript levels of Fd and FNR, which are both
encoded by a small gene family [25]. We found constitutive mRNA levels of Fds and FNRs, except for
Fd VI, which gave two peaks at 3 and 15 h (Fig. 2).
Fd I, Fd II, Fd V, L-FNR 1 and L-FNR 2 are mainly
distributed in the leaves, whereas Fd III and Fd VI are
found in nonphotosynthetic tissues [26,27]. The lowest
mRNA level was detected for Fd I at 3 h at 80% of
the maximum (Fig. 2). Two-phase specific promoters
and ⁄ or mRNA stability could entrain two peaks of
Fd VI and gdh1 [7].
FEBS Journal 275 (2008) 3193–3206 ª 2008 The Authors Journal compilation ª 2008 FEBS
M.-H. Valadier et al.
Amino acid metabolism and translocation
Glutamate synthesis in the reconstituted system
using NADPH, FNRs, Fds and GOGAT
Glutamate synthesis depends on a subtle specialization
of FNRs and Fds. We reconstituted a NADPH-dependent glutamate synthesis system using recombinant
FNR, Fd and Fd-GOGAT proteins to assess whether
NADPH serves as the initial electron donor for the
catalytic reaction of Fd-GOGAT through a redox cascade of Fd and FNR. As shown in Fig. 6A, rapid
NADPH oxidation was observed when all protein
components and the substrates glutamine and 2-oxoglutarate were present in the assay mixture. In contrast, only a basal level of NADPH oxidation,
A
B
C
uncoupled to glutamate formation, was observed without either substrate. The N-terminal cysteine of
Fd-GOGAT was essential for the amido transfer reaction, and an Fd-GOGAT mutant with this cysteine
residue substituted by glycine, Cys1Gly, showed no
significant NADPH oxidation (Fig. 6B). NADPH
oxidation was correlated with glutamate formation
measured by HPLC (data not shown), confirming that
NADPH supported glutamate synthesis.
To further investigate the NADPH ⁄ FNR ⁄ Fd-GOGAT electron pathway in glutamate synthesis,
NADPH oxidation was assayed using several combinations of photosynthetic isoproteins (L-FNR ⁄ Fd I,
L-FNR ⁄ Fd II or L-FNR ⁄ Fd V) or a combination of
nonphotosynthetic isoproteins (R-FNR ⁄ Fd III). The
rate of NADPH oxidation in the nonphotosynthetic
system was most efficient of all combinations of FNRs
and Fds (Table 2). The R-FNR ⁄ Fd III combination
gave an activity of about three-fold higher than those
of L-FNR ⁄ Fd I, L-FNR ⁄ Fd II and L-FNR ⁄ Fd V, all
of which showed a similar activity (Table 2). When
glutamate formation was determined as a function of
Fd concentration, the kinetics of NADPH oxidation in
the R-FNR ⁄ Fd III system were high, particularly at
lower Fd concentrations, compared with the
L-FNR ⁄ Fd I system (Fig. 6C). The results indicate
that nonphotosynthetic R-FNR and Fd III isoproteins
promote efficient glutamate formation using NADPH
as reductant.
Amino acid translocation in the vascular streams
In order to monitor the amino acids supplied for allocation by the source tissues, we analysed the amino
acid contents in the phloem sap. Phloem exudate was
promoted and collected as described in [28]. As the
plants exuded at lower rates in the dark, the amino
Fig. 6. Assay for Fd-GOGAT activity in the reconstituted electron
transfer system. The complete reaction mixture contained 50 mM
Tris ⁄ HCl, pH 7.5, 100 mM NaCl, 0.2 mM NADPH, 5 mM 2-oxoglutarate, 5 mM glutamine and maize recombinant proteins as follows:
0.2 lM L-FNR 1, 20 lM Fd I and 0.36 lM of either WT (A) or
Cys1Gly mutant (B) of Fd-GOGAT. As a control, 2-oxoglutarate or
glutamine was omitted from the reaction mixture. The kinetics of
Fd-GOGAT activity were assayed by increasing the concentrations
of Fd isoprotein as indicated in the figure (C). Photosynthetic (s)
and nonphotosynthetic (d) combinations contained L-FNR 1 ⁄ Fd I
and R-FNR ⁄ Fd III, respectively. Oxidation of NADPH was followed
by monitoring the decrease in A340 nm.
Table 2. Comparison of Fd-GOGAT activity supported by different
combinations of Fds and FNRs. The reaction mixture contained
50 mM Tris ⁄ HCl, pH 7.5, 100 mM NaCl, 0.2 mM NADPH, 5 mM
2-oxoglutarate, 5 mM glutamine and maize recombinant proteins as
follows: 0.2 lM L-FNR or R-FNR, 20 lM Fd isoprotein and 0.36 lM
Fd-GOGAT. Fd-GOGAT activity is expressed as the rate of NADPH
oxidation [lmolỈmin)1Ỉ(mg Fd-GOGAT protein))1].
Reaction
Photosynthetic isoproteins
L-FNR ⁄ Fd I
L-FNR ⁄ Fd II
L-FNR ⁄ Fd V
Nonphotosynthetic isoproteins
R-FNR ⁄ Fd III
FEBS Journal 275 (2008) 3193–3206 ª 2008 The Authors Journal compilation ª 2008 FEBS
Specific activity
0.508
0.476
0.405
1.28
3199
Amino acid metabolism and translocation
M.-H. Valadier et al.
acid analysis was carried out in exudates harvested
over a 16 h light phase and 8 h dark phase. The amino
acid composition in the phloem exudates was very different from that in xylem sap (Fig. 7), suggesting that
there was little contamination from xylem, and vice
versa. Glx (glutamine and glutamate: five carbon
amide and amino acid) and Asx (asparagine and
aspartate: four carbon amide and amino acid) were
found to be the main nitrogen compounds in the
phloem exudates, amounting to 51% of the total
amino acids in the light and 56% in the dark
(Fig. 7A). The total amount of alanine, serine and glycine was reduced from 33% in the light to 25% in the
dark (Fig. 7A). Glutamine and asparagine were the
major amino acids in the xylem sap in both the light
(63% of the total amino acids) and dark (60%)
(Fig. 7B).
The amino acid percentage ratio in the leaves and
phloem distinguished three groups. First, glutamine
and asparagine appeared to be preferentially
Phloem exudates
Relative amount %
A
30
Light
Dark
20
10
0
Gln
Glu
Asn
Asp
Ala
Gly
Ser
Xylem saps
Relative amount %
B
40
Light
Dark
30
20
10
0
Gln
Glu
Asn
Asp
Ala
Amino acids
Gly
Ser
Fig. 7. Amino acid composition in phloem exudates (A) and xylem
bleeding sap (B) collected from maize during a 16 h light phase
(grey bars, Light) and 8 h dark phase (black bars, Dark). Phloem
exudates were collected in tubes filled with 10 mM Hepes buffer,
pH 7.5 containing 1 mM EDTA. Xylem sap was obtained from cut
stumps of decapitated plants. The amino acid composition is
expressed as a percentage relative to the total amino acid contents, which represent the mean (nmolỈ100 lL)1) from three independent plants ± standard error as follows: 44.3 ± 2.9 (phloem,
Light), 19.8 ± 1.2 (phloem, Dark), 34.1 ± 2.0 (xylem, Light) and
24.6 ± 1.5 (xylem, Dark). The standard errors for individual amino
acid contents are of the same order of magnitude as those of the
total amino acid contents.
3200
transported in the phloem, as indicated by high
phloem ⁄ leaf ratios (12–25) (Table 1). Translocation of
glutamine and asparagine in the phloem seemed to be
increased in the dark (Table 1). Second, glutamate,
aspartate and serine were similarly distributed in leaves
and phloem sap, yielding phloem ⁄ leaf ratios of
between 0.9 and 1.7 (Table 1). Third, alanine and glycine were poorly translocated, with phloem ⁄ leaf ratios
below 0.7 (Table 1). Finally, amino acids were selectively translocated in the xylem in the form of glutamine and asparagine, which showed a significantly
high xylem ⁄ leaf ratio of between 28 and 99 in the light
and dark (Table 1).
Discussion
Glutamine is the main entry point of ammonium,
which can be derived from nitrate reduction, protein
turnover and, to a lesser extent, photorespiration in
the post-flowering maize ear leaf. A large accumulation
of ammonium in the second half of the light period
revealed that ammonium assimilation was substantially
inhibited in response to ammonium formation. Despite
the low abundance of mRNA for four Gln1 genes,
active GS1 partially converted a high level of ammonium into glutamine, which transiently increased
shortly after the ammonium peak. However, glutamine
could not be further metabolized because of glutamate
deficiency (Fig. 1). To obtain an insight into nitrogen
assimilation, we showed that Fd-GOGAT was located
in the chloroplasts of both BSCs and MCs (Fig. 5). To
our knowledge, this is the first demonstration of FdGOGAT mRNAs in the cytoplasm on the periphery of
chloroplasts and of the enzyme protein in the chloroplasts of the two cell types. This spatial distribution of
Fd-GOGAT contrasts with its exclusive localization in
BSCs of maize [29].
BSCs contain most of the photorespiratory
enzymes [23]. In the post-flowering maize ear leaf,
mitochondrial
glycine
decarboxylase
complex
(EC 1.4.4.2 ⁄ 2.1.2.10)
produces
photorespiratory
ammonium [30] at rates between 25 and 50% of primary nitrate reduction (Fig. 3). As the [15N] label from
[15N]glycine, fed to maize leaf, is recovered within
45 min exclusively in glutamine and glutamate [31],
photorespiratory ammonium is primarily re-fixed via
the vascular bundle-located GS1 [32], in concert with
BSC-located Fd-GOGAT. However, the physiological
role of Fd-GOGAT in BSC chloroplasts is a matter of
debate, because BSC chloroplasts contain only
20–30% of PS II polypeptides, and most of the capacity for noncyclic electron transport and concomitant
Fd reduction is localized to MC chloroplasts [25,33].
FEBS Journal 275 (2008) 3193–3206 ª 2008 The Authors Journal compilation ª 2008 FEBS
M.-H. Valadier et al.
In vitro Fd-GOGAT assay showed that Fds reduced
with NADPH via FNRs display a several-fold higher
ability to donate electrons to GOGAT (Table 2) than
does photoreduced Fd [34]. In spite of the low FNR
and Fd concentrations in BSCs (30 and 40 lm) [35,36],
a close location of FNRs, Fds and Fd-GOGAT on the
thylakoid membrane [25,37] allows protein–protein
complex formation essential for the GOGAT reaction
[24]. To our knowledge, our results provide evidence
for the first time that FNR couples Fd reduction with
NADPH oxidation in the GOGAT reaction. The data
indicate that the NADPH ⁄ FNR ⁄ Fd system drives a
specific redox reaction in vivo for BSC-located Fd-GOGAT in ammonium assimilation. Moreover, the
nonphotosynthetic R-FNR ⁄ Fd III system yields a
2.5–3-fold higher GOGAT activity than all photosynthetic FNR ⁄ Fd systems. This reflects a higher redox
potential of Fd III ()345 mV) than the other Fds [26],
leading to rapid thermodynamic electron transfer.
Without light energy, the NADPH ⁄ R-FNR ⁄ Fd III system presumably substitutes for photoreduced Fd and
sustains the GS1 ⁄ Fd-GOGAT cycle to assimilate
ammonium in the dark (Fig. 3). The reversible electron
transfer between NADPH and Fd via FNR has been
shown to occur in cyanobacteria and green algae
[38,39]. However, the contribution of this system in the
light and dark to meet the needs for reductant supply
to Fd-GOGAT has not been elucidated. In addition,
the reductant supply system from NADPH to Fd-GOGAT via L-FNR ⁄ Fd II and R-FNR ⁄ Fd III is relevant
in BSC chloroplasts (Figs 4 and 5), because of the
internal light gradient within the translucent veins of
BSCs. The light absorption and scattering attenuate
the photon fluence rate by 34% at 450 ⁄ 680 nm and
15% at 725 nm by the initial 50 lm across the maize
mesocotyl [40]. As a result, Fd reduction deprived of
sufficient light at the core of vascular bundles depends
on the sensitive NADPH ⁄ FNR ⁄ Fd system. Glutamate
synthesis increases on addition of NADPH at a large
excess of stromal concentrations in the dark (0.3–
0.48 mm) [41] (data not shown). This provides evidence
that the supply of reduced Fd via NADPH limits
nitrogen assimilation and presumably sulfur reduction
in the plastids, where the oxidative pentose phosphate
pathway produces NADPH [42,43].
Large amounts of ammonium are produced in the
ear leaf in response to the induction of proteolysis [44],
up to several fold higher than primary ammonium
(Fig. 3). Ammonium incorporation into glutamine and
glutamate occurs exclusively by GS, GOGAT and
GDH in a broad range of organisms [45]. The rapid
ammonium accumulation and contrasting shortage of
glutamate in the second half of the light phase provide
Amino acid metabolism and translocation
evidence that the impairment of ammonium assimilation by the GS1 ⁄ GOGAT cycle is caused by the
decline in Fd-GOGAT and NADH-GOGAT (Figs 1
and 3). The active GDH does not contribute to alleviate the excess ammonium into glutamate. This
contrasts with the proposed role of GDH in assimilating excess ammonium in the source leaves in which
GDH is induced after pollination (for a review, see
[9,10]). Genetic evidence indicates that members of the
GDH S_50II class, including plant mitochondrial
NADH-GDHs, oxidize glutamate. By contrast, members of the GDH S-50I class, such as plastidial
NADPH-GDH (EC 1.4.1.4) of Chlorella, assimilate
ammonium into glutamate [46]. In fact, chloroplast
NADPH-GDH is found in higher plants [47], suggesting a possible alternative role of this isoform. Therefore, NADH-GDH may provide the anaplerotic
pathway with 2-oxoglutarate to regenerate NADH and
2-oxalacetate for further transaminations. In addition
to GOGATs, glutamate can be produced by the aminotransferases, which, in turn, consume the equivalent
amount of glutamate in the reverse reactions to form
aspartate and alanine for further amino acid interconversions. Therefore, the net synthesis of glutamate
through the GS1 ⁄ GOGAT cycle is a prerequisite for
grain development. This view is supported by the evidence that the overall glutamate level remains constant
in the source organs (stalks and cobs) [8,9], and the
nitrate supply to roots after pollination reduces the
loss of amino acids from these stalks and leaves for
use in grain filling [8].
The amino acids were selectively remobilized in the
phloem in the form of glutamine, asparagine, glutamate and aspartate, which had high phloem ⁄ leaf ratios
(Table 1). As a result, these amino acids make up the
major components of the seed storage proteins [9]. The
abundance of glutamine, asparagine and glutamate in
the phloem sap correlates with the spatial distribution
of GS1 [32], AS and Fd-GOGAT in BSCs, arranged in
one or more layers adjacent to the sieve tubes (Figs 4
and 5). The phloem loading of glutamine, asparagine
and glutamate from BSCs takes place via H+-coupled
amino acid transporters into the vascular parenchyma
at the border of BSCs ⁄ vascular parenchyma. The
amino acids are then apoplastically loaded into the
companion cell–sieve element complexes because of the
low abundance of plasmodesmata [48]. By contrast,
the phloem loading from MCs requires additional
H+-amino acid transporters across the MC–BSC interface, and depends on the continuity of the electrochemical H+ gradient between the two cell types. The
location of the GS1 ⁄ Fd-GOGAT cycle in the BSCs,
surrounding sieve element, meets the demand of amino
FEBS Journal 275 (2008) 3193–3206 ª 2008 The Authors Journal compilation ª 2008 FEBS
3201
Amino acid metabolism and translocation
M.-H. Valadier et al.
acid synthesis in these cells, from which the amino
acids are loaded to the phloem for the grain. In the
phloem sap, glutamine is the preferred nitrogen carrier
rather than asparagine (Table 1). This can be attributed in part to the amide group on the d-carbon of
glutamine, which increases the binding affinity to the
transporter (AAP5) by at least three orders of magnitude compared with asparagine [49]. In Arabidopsis,
dark and sugar induce ASN1 and gln1-1, respectively,
and repress gln1-1 and ASN1, respectively. These
expression patterns correlate with the relative abundance of asparagine and glutamine in the leaves [50].
The expression of gln1-3 and ASN in maize is inhibited
by light and sugar, respectively [51,52]. Therefore, the
increased ratios of asparagine to glutamine in the
phloem sap in the dark could be attributed partly to
the conversion of glutamine to asparagine by AS in
the dark.
Materials and methods
Plant growth
Seeds of maize (Zea mays L. cv. DEA) were germinated on
sand by supplying a complete nutrient solution, as described
in [22]. Maize seedlings were grown for 21 days in a
controlled growth chamber under a regime of 16 h light
(photosynthetic photon flux density of 300 lmol photonsỈm)2Ỉs)1 at 25 °C) and 8 h dark (18 °C). Plants were
then grown in a glasshouse for 2 months under natural light
with irrigation by complete nutrient solution as described
previously [22]. Two weeks before harvest, plants were transferred to a controlled chamber and grown in a 16 h light ⁄ 8 h
dark cycle under the conditions described above. Leaves
were numbered from the bottom of the plant, and the
second leaves upward from the first ear were harvested for
analysis.
Relative quantitative RT-PCR
Total RNA was extracted using a kit according to the manufacturer’s instructions (Qiagen GmbH, Hilden, Germany).
Relative RT-PCR was carried out using rRNA as an endogenous standard, and the first cDNA strands were synthesized
from 2 lg of RNA using an Omniscript RT kit (Qiagen
GmbH). The abundance of initial cDNA strands between
samples was corrected using agarose gel electrophoresis and
Quantum RNA 18S internal standards (Ambion, Austin,
TX, USA). PCR was performed on a LightCycler Instrument (Roche, Basle, Switzerland). For the genes of the multigene family, the specific oligonucleotides were designed
along the nonconserved stretches of the genes in the same
gene family. The following specific primer sets were used for
each gene, indicated by the GenBank database accession
3202
number: NR1 (accession number M27821): forward primer,
5¢-CTCAAGCGCATCATCGTCAC-3¢; reverse primer,
5¢-ATGATCTGGTACATGGGCGTG-3¢; GS1-1 (D14576,
X65929): forward primer, 5¢-CCCTCCTTCCTCCTTGG
GTT-3¢; reverse primer, 5¢-ATGGAATGGAAGTGGTGG
GAA-3¢; GS1-2 (D14577, X65928): forward primer,
5¢-TCTCGGACAACACCGAGAAGA-3¢; reverse primer,
5¢-CACAAGTGTGGTACGGCCATT-3¢; GS1-3 (D14578,
X65930): forward primer, 5¢-CAGCTCTTCTTGGGTTGC
CTA-3¢; reverse primer, 5¢-GTACCCAATAAACGGGA
AGCG-3¢; GS1-4 (D14579, X65926): forward primer,
5¢-CTTCTCGTCTGCCCGAGT-3¢; reverse primer, 5¢-CTG
GAAGCACAGCCAAACGTA-3¢; GS2 (X65931): forward
primer,
5¢-GACGGTTGGTTCGGGAATG-3¢;
reverse
primer, 5¢-TCCGATGAATCAAAGACAGCC-3¢; Fd-GO
GAT (M59190): forward primer, 5¢-GCTGCTATGGGAG
CTGATGAA-3¢; reverse primer, 5¢-GCAACGGCCAAG
AATCATGTA-3¢; GDH1 (D49475): forward primer, 5¢TTGTTCCTTGGGAGGATAGAAAAA-3¢; reverse primer,
5¢-TTGCTTGCAGACAGCATCTCA-3¢; ASN (X82849):
forward primer, 5¢-AAAGCTTCATCGCAGCTCGT-3¢;
reverse primer, 5¢-CACGACACACACACACACGT-3¢; Fd I
(M73830): forward primer, 5¢-CTACAACGTGAAGCT
GATCAC-3¢; reverse primer, 5¢-GATGGGCATGAATGAT
TATGCGC-3¢; Fd II (AB016810): forward primer, 5¢-CCTG
GCGGTGTATAGCTAAGCAG-3¢; reverse primer, 5¢-CTG
AGCATGAGCATCCTCC-3¢; Fd III (M73831): forward
primer, 5¢-CGAAGGTTCCAAGCCTGAAGACC-3¢; reverse
primer, 5¢-CTAGCAGAACATAGAAGACAGC-3¢; Fd V
(M73828): forward primer, 5¢-TCCAGCCATTACCCGCA
GCTAGC-3¢; reverse primer, 5¢-GCTTAGGAGATAAG
GTCGTCCTCC-3¢; Fd VI (AB001385): forward primer,
5¢-GACGGAGCACGAGTTCGAGGC-3¢; reverse primer,
5¢-CTCATATGCCATGATCTCATCG-3¢, L-FNR 1 (AB035644):
forward primer, 5¢-ACAACACAAAATGTCAGCTGC
AAAA-3¢; reverse primer, 5¢-AAGGCCAAGAAGGAGTC
CAAGAAG-3¢; L-FNR 2 (AB035645): forward primer,
5¢-TTGCTTGAGCTGAACAATACAATGAA-3¢; reverse
primer, 5¢-GAGCCGGTCAAGAAGCTGGAG-3¢. PCRs
were carried out using 1 : 5, 1 : 10, 1 : 20 and 1 : 40 dilutions
of cDNA. Reactions were hot started at 95 °C, and carried
out for 32 cycles of 94 °C for 30 s, annealing temperature for
1 min and 30 s and 72 °C for 30–90 s. Products were visualized by ethidium bromide in agarose gels, and bands were
quantified by scanning with an FLA-5000 imaging system
(Fujifilm SAS, St-Quentin, France).
In situ hybridization experiment
Tissue inclusion
Leaf sections were harvested at 2–3 h into the light phase,
and immediately fixed in 4% (v ⁄ v) paraformaldehyde containing 0.1% Triton X-100 in NaCl ⁄ Pi (10 mm sodium phosphate, pH 7.0 and 130 mm NaCl). After dehydration in a
FEBS Journal 275 (2008) 3193–3206 ª 2008 The Authors Journal compilation ª 2008 FEBS
M.-H. Valadier et al.
Amino acid metabolism and translocation
graded ethanol series (10%, 30%, 50%, 70% and 96%), tissues were incubated in an ethanol ⁄ histoclear series (2 : 1,
1 : 1, 1 : 2, v ⁄ v), histoclear and histoclear ⁄ paraffin (1 : 1,
v ⁄ v), and embedded in paraffin at 59 °C.
(75 mgỈmL)1). Slides were sealed with gel mount formol1
(Microm Microtech France, Francheville, France), and fluorescence was observed using a Leica DMR microscope
(Leica Microsystems, Wetzlar, Germany).
Hybridization probe preparation
Indirect immunofluorescence analysis
Total RNA was extracted from maize leaves using an RNA
isolation kit (Qiagen GmbH). First cDNA strands were
synthesized from 2 lg of RNA using an Omniscript RT kit
(Qiagen GmbH). Partial DNAs of Fd-GOGAT and AS
were amplified by PCR using the following primers. FdGOGAT: sense probe: forward primer, 5¢-TGTAATTCGA
CTCACTATAGGGTACGCAGCCACCAGTCATGTA-3¢;
reverse primer, 5¢-TACGCAGCCACCAGTCATGTA-3¢;
antisense probe: forward primer, 5¢-CTTAGGGTGGACG
GTGGATTC-3¢; reverse primer, 5¢-TGTAATTCGACTC
ACTATAGGGTACGCAGCCACCAGTCATGTA-3¢; AS:
sense probe: forward primer, 5¢-TGTAATTCGACTCACT
ATAGGGCCTCCCTGCTAGCTTCTACCG-3¢;
reverse
primer, 5¢-TCCAGACATACAGACACGGGC-3¢; antisense
probe: forward primer, 5¢-CCTCCCTGCTAGCTTC
TACCG-3¢; reverse primer, 5¢-TGTAATTCGACTCACTA
TAGGGCTCCAGACATACAGACACGGGC-3¢.
Sense
and antisense DNAs (400 ng each) were labelled with DIGUTP using a transcription kit (Promega, Madison, WI,
USA). After DNase digestion (1 unit per reaction), RNA
probes were hydrolysed in a carbonate solution (120 mm
Na2CO3 and 80 mm NaHCO3, pH 10.2), and controlled by
anti-DIG IgG conjugated with alkaline phosphatase (Roche
Diagnostics GmbH, Penzberg, Germany) on GeneScreen
membrane.
Leaf sections were fixed in 3.7% (w ⁄ v) formaldehyde in
50 mm PIPES buffer, pH 6.9, 5 mm MgSO4 and 5 mm
EGTA (MTSB), and then in NaCl ⁄ Pi (6.5 mm Na2HPO4,
1.5 mm KH2PO4, pH 7.3, 14 mm NaCl and 2.7 mm KCl).
Tissues were dehydrated in a graded ethanol series (30%,
50%, 70%, 90% and 97%). Samples were incubated in a
mixture of wax and ethanol (1 : 1, v ⁄ v), and then embedded in wax at 40 °C. Sections (10 lm) were prepared using
a microtome, and slides were dewaxed and rehydrated
through a degraded ethanol series (97%, 90% and 50%).
Antigen unmasking was carried out in 10 mm citrate buffer,
pH 6.0 at 95 °C for 2 min, and blocked with 1% (w ⁄ v)
BSA in NaCl ⁄ Pi (blocking solution). Antibody hybridization was carried out with the primary rabbit antibody
against tobacco Fd-GOGAT, and then with goat antirabbit IgG labelled with Alexa 405 (Molecular Probes,
Carlsbad, CA, USA) in blocking solution. As a control,
preimmune serum was used as the primary antibody.
Immunofluorescence was observed using a spectral confocal
laser scanning microscope (Leica TCS SP2 AOBS) (Leica
Microsystems). Immunofluorescence was observed with a
laser diode (25 mW, 405 nm) using a Leica HC PL APO
63· ⁄ 1.20 Water Corr ⁄ 0.17 Lbd.BL objective. Low-speed
scan (200 lines per second) images (512 · 512 pixels) were
generated, and Alexa 405 fluorescence was collected with a
specific bandwidth (407–427 nm) after spectral adjustment
to eliminate background noise. The red autofluorescence of
tissues was observed between 509 and 628 nm.
In situ hybridization
Tissue sections (8 lm) were prepared using a microtome,
and samples on slides (DAKO 2024, Dako, Basingstoke,
UK) were deparaffinized in histoclear and hydrated by a
degraded ethanol series (96%, 85%, 50% and 30%). After
proteinase K digestion (4 lgỈmL)1) in TE buffer (10 mm
Tris ⁄ HCl, pH 7.5 and 50 mm EDTA), samples were treated
with 0.5% (v ⁄ v) acetic anhydride in 1.3 m triethanolamine,
pH 7.0, and dehydrated in a graded ethanol series (30%,
50%, 70%, 85%, 96% and 100%). Sense and antisense
probes were denatured, dissolved and hybridized in situ in
mRNA hybridization solution (Dako) at 45 °C overnight.
Slides were washed in 0.2 · SSC (1 · SSC: 150 mm NaCl
and 15 mm sodium citrate, pH 7.0) at 45 °C, T2 solution
(100 mm Tris ⁄ HCl, pH 7.5 and 150 mm NaCl containing
0.5% blocking reagent) (Roche Diagnostics GmbH) and T3
solution (T1 including 1% BSA and 0.5% Triton X-100) at
room temperature. Slides were incubated with alkaline
phosphatase-conjugated anti-DIG IgG in T3. Alkaline phosphatase activity was developed with 5-bromo-4-chloro-3indolyl-phosphate (50 mgỈmL)1) and nitroblue tetrazolium
Enzyme preparation and assays
NR was extracted as described previously [17]. The activation state of NR was determined by the activity ratio in the
presence of 10 mm MgCl2 or 5 mm EDTA for the divalent
cation-dependent activity and maximum catalytic activity,
respectively. NiR and GS were extracted and assayed
according to [17]. Fd-GOGAT and NADH-GOGAT were
extracted and assayed by measuring glutamate formation
by HPLC as described in [22]. GDH was extracted and
assayed for reductive glutamate synthetic activity and glutamate oxidation activity according to [17].
Reconstituted electron transfer system to
Fd-GOGAT
Fd-GOGAT was assayed by reconstituting the electron
transfer pathway from NADPH to Fd via FNR as
FEBS Journal 275 (2008) 3193–3206 ª 2008 The Authors Journal compilation ª 2008 FEBS
3203
Amino acid metabolism and translocation
M.-H. Valadier et al.
described essentially in [36]. The recombinant maize
proteins of FNRs and Fds (L-FNR, R-FNR, Fd I, Fd II,
Fd III and Fd V) were prepared in the Escherichia coli
expression system [25,35]. Maize Fd-GOGAT was also prepared in a similar system (T. Hase, unpublished work). The
complete reaction mixture contained 50 mm Tris ⁄ HCl,
pH 7.5, 100 mm NaCl, 0.2 mm NADPH, 5 mm 2-oxoglutarate, 5 mm glutamine and maize recombinant proteins as
follows: 0.2 lm L-FNR 1 or R-FNR, 20 lm of Fd I, Fd II,
Fd III or Fd V and 0.36 lm of Fd-GOGAT. The oxidation
of NADPH was followed by monitoring the decrease in
A340 nm. The formation of glutamate was also analysed with
an equivalent assay system. The reaction mixture contained
25 mm sodium phosphate buffer, pH 7.3, 0.14 mm
NADPH, 0.1 lm L-FNR, 20 lm Fd I, 5 mm glutamine,
5 mm 2-oxoglutarate and 0.73 lm of either wild-type or
mutant Fd-GOGAT. The reaction was carried out at
30 °C, and glutamate formation was measured by HPLC as
described above.
Amino acid analysis
Samples were freeze-dried and amino acids were extracted
from 20 mg samples at 4 °C with 1 mL of 2% (w ⁄ v) sulfosalicylic acid. After centrifugation at 17 500 g for 15 min,
supernatants were adjusted to pH 2.1 with LiOH and stored
at )70 °C prior to analysis. Total amino acid contents were
estimated according to the method of Rosen [53]. Amino
acids were separated by ion-exchange chromatography on a
JLC-500 ⁄ V amino acid analyser (JEOL Ltd, Tokyo, Japan).
Collection of phloem exudates and xylem
bleeding sap
Phloem exudates and xylem bleeding sap were collected
during a 16 h light ⁄ 8 h dark cycle. Shoots were cut off and
rapidly immersed in tubes filled with 5–10 mL of collection
buffer consisting of 10 mm Hepes, pH 7.5 and 1 mm EDTA,
as described previously [54]. Xylem sap was collected from
the cut stumps of decapitated plants using a micropipette
[28]. Phloem exudates were adjusted to pH 2.1, and both
phloem exudates and xylem sap were concentrated by
speedvac and stored at )70 °C prior to amino acid analysis.
Determination of metabolites, total soluble
proteins and chlorophylls
Metabolites were extracted from lyophilized materials
with 2% 5-sulfosalicylic acid. Nitrate contents were analysed as described in [17]. Free ammonium contents were
determined by the phenol hypochlorite assay (Berthelot
assay). Soluble protein contents were determined by the
Coomassie blue dye-binding assay (Bio-Rad Laboratories,
Hercules, CA, USA).
3204
Acknowledgements
We thank Dr David Tepfer for proofreading the
manuscript. We also thank Francois Gosse for culture
¸
and maintenance of the plants.
References
1 Moore R & Black C Jr (1979) Nitrogen assimilation
pathways in leaf mesophyll and bundle sheath cells of
C4 photosynthesis plants formulated from comparative
studies with Digitaria sanguinalis (L.) Scop. Plant Physiol 64, 309–313.
2 Sakakibara H, Kawabata S, Takahashi H, Hase T &
Sugiyama T (1992) Molecular cloning of the family of
glutamine synthetase genes from maize: expression of
genes for glutamine synthetase and ferredoxin-dependent glutamate synthase in photosynthetic and nonphotosynthetic tissues. Plant Cell Physiol 33, 49–58.
3 Li M-G, Villemur R, Hussey PJ, Silflow CD, Gantt JS
& Snustad DP (1993) Differential expression of six glutamine synthetase genes in Zea mays. Plant Mol Biol
23, 401–407.
4 Muhitch MJ (2003) Distribution of the glutamine synthetase isoenzyme GSp1 in maize (Zea mays). J Plant
Physiol 160, 601–605.
5 Skopelitis DS, Paranychianakis NK, Paschalidis KA,
Pilakonis ED, Dellis ID, Yakoumakis DI, Kouvarakis
A, Papadakis AK, Stephanou EG & Roubelakis-Angelakis K (2006) Abiotic stress generates ROS that signal expression of anionic glutamate dehydrogenases to
form glutamate for proline synthesis in tobacco and
grapevine. Plant Cell 18, 2767–2781.
6 Chapman KSR, Berry JA & Hatch MD (1980) Photosynthetic metabolism in bundle sheath cells of the C4
species Zea mays: sources of ATP and NADPH and the
contribution of photosystem II. Arch Biochem Biophys
202, 330–341.
´
7 McClung CR, Salome PA & Michael TP (2002) The
Arabidopsis circadian system. In The Arabidopsis Book
(Somerville C & Meyerowitz E, eds), pp. 1–23. The
American Society of Plant Biologists, Rockville.
8 Crawford TW Jr, Rendig VV & Broadbent FE (1982)
Sources, fluxes, and sinks of nitrogen during early
reproductive growth of maize (Zea mays L.). Plant
Physiol 70, 1654–1660.
9 Seebauer JR, Moose SP, Fabbri BJ, Crossland LD &
Below FE (2004) Amino acid metabolism in maize earshoots. Implications for assimilate reconditioning and
nitrogen signaling. Plant Physiol 136, 4326–4334.
10 Miflin BJ & Habash DZ (2002) The role of glutamine
synthetase and glutamate dehydrogenase in nitrogen
assimilation and possibilities for improvement in the
nitrogen utilization of crops. J Exp Bot 53, 979–987.
FEBS Journal 275 (2008) 3193–3206 ª 2008 The Authors Journal compilation ª 2008 FEBS
M.-H. Valadier et al.
11 Magalhaes JR, Ju GC, Rich PJ & Rhodes D (1990)
˜
Kinetics of 15NH4+ assimilation in Zea mays. Preliminary studies with a glutamate dehydrogenase (GDH1)
null mutant. Plant Physiol 94, 647–656.
12 Stewart GR, Shatilov VR, Turnbull MH, Robinson SA
& Goodall R (1995) Evidence that glutamate dehydrogenase plays a role in the oxidative deamination of glutamate in seedlings of Zea mays. Aust J Plant Physiol
22, 805–809.
13 Masclaux-Daubresse C, Reisdorf-Cren M, Pageau K,
Lelandais M, Grandjean O, Kronenberger L, Valadier
M-H, Feraud M, Jouglet T & Suzuki A (2006) Glutamine synthetase ⁄ glutamate synthase pathway and glutamate dehydrogenase play distinct roles for sink ⁄ source
nitrogen cycle in tobacco. Plant Physiol 140, 444–456.
14 Purnell MP & Botella JR (2007) Tobacco isoenzyme 1
of NAD(H)-dependent glutamate dehydrogenase catabolizes glutamate in vivo. Plant Physiol 143, 530–539.
15 Scheible W-R, Krapp A & Stitt M (2000) Reciprocal
diurnal changes of phosphoenolpyruvate carboxylase
expression and cytosolic pyruvate kinase, citrate synthase and NADP-isocitrate dehydrogenase expression
regulate organic acid and metabolism during nitrate
assimilation in tobacco leaves. Plant Cell Environ 23,
1155–1167.
16 Bowsher CG, Long DM, Oaks A & Rothstein SJ (1991)
Effects of light ⁄ dark cycle on expression of nitrate
assimilatory genes in maize shoots and roots. Plant
Physiol 95, 281–285.
´
17 Ferrario-Mery S, Valadier M-H, Godefroy N, Miallier
D, Hirel B, Foyer CH & Suzuki A (2002) Diurnal
changes in ammonia assimilation in transformed
tobacco plants expressing ferredoxin-dependent glutamate synthase mRNA in the antisense orientation.
Plant Sci 163, 59–67.
18 Guo Y, Cai Z & Gan S (2004) Transcriptome of Arabidopsis leaf senescence. J Exp Bot 27, 521–549.
19 Lam H-M, Hsieh MH & Coruzzi GM (1998) Reciprocal regulation of distinct asparagine synthetase genes by
light and metabolites in Arabidopsis thaliana. Plant J
16, 345–353.
20 Debouba M, Gouia H, Valadier M-H, Ghorbel MH &
Suzuki A (2006) Salinity-induced tissue-specific diurnal
changes in nitrogen assimilatory enzymes in tomato
seedlings under high or low nitrate medium. Plant Physiol Biochem 44, 409–419.
21 Ta CT (1991) Nitrogen metabolism in the stalk tissue of
maize. Plant Physiol 97, 1375–1380.
22 Suzuki A, Rioual S, Lemarchand S, Godfloy N, Roux
Y, Boutin JP & Rothstein S (2001) Regulation by light
and metabolite of ferredoxin-dependent glutamate synthase in maize. Physiol Plant 112, 524–530.
23 Majeran W, Cai Y, Sun Q & van Wijk KJ (2005) Functional differentiation of bundle sheath and mesophyll
Amino acid metabolism and translocation
24
25
26
27
28
29
30
31
32
33
34
35
maize chloroplasts determined by comparative proteomics. Plant Cell 17, 3111–3140.
Suzuki A & Knaff DB (2005) Glutamate synthase:
structural, mechanistic and regulatory properties, and
role in amino acid metabolism. Photosynth Res 83,
191–217.
Okutani S, Hanke GT, Satomi Y, Takao T, Kurisu G,
Suzuki A & Hase T (2005) Three maize leaf ferredoxin:NADPH oxidoreductases vary in subchloroplast
location, expression, and interaction with ferredoxin.
Plant Physiol 139, 1451–1459.
Onda Y, Matsumura T, Kimata-Ariga Y, Sakakibara
H, Sugiyama T & Hase T (2000) Differential interaction
of maize root ferredoxin:NADP+ oxidoreductase with
photosynthetic and nonphotosynthetic ferredoxin isoenzymes. Plant Physiol 123, 1037–1045.
Sakakibara H (2003) Differential response of genes for
ferredoxin and ferredoxin:NADP+ oxidoreductase to
nitrate and light in maize leaves. J Plant Physiol 160,
65–70.
Pate JS, Atkins CA, Hamel K, McNeil DL & Layzell
DM (1979) Transport of organic solutes in phloem and
xylem of a nodulated legume. Plant Physiol 63, 1082–
1088.
Becker TW, Perrot-Rechenmann C, Suzuki A & Hirel B
(1993) Subcellular and immunocytochemical localization
of the enzymes involved in ammonia assimilation in
mesophyll and bundle-sheath cells of maize leaves.
Planta 191, 129–136.
De Veau EJ & Burris JE (1989) Photorespiratory rates
in wheat and maize as determined by 18O-labeling.
Plant Physiol 90, 500–511.
Berger MG & Fock HP (1983) Effects of methionine sulfoximine and glycine on nitrogen metabolism of maize
leaves in the light. Aust J Plant Physiol 10, 187–194.
Kamachi K, Yamaya T, Hayakawa T, Mae T & Ojima
T (1992) Vascular bundle-specific localization of cytosolic glutamine synthetase in rice leaves. Plant Physiol
99, 1481–1486.
Meierhoff K & Westhoff P (1993) Differential biogenesis of photosystem II in mesophyll and bundle-sheath
cells of monocotyledonous NADP-malic enzyme-type
C4 plants: the non-stoichiometric abundance of the
subunits of photosystem II in the bundle-sheath chloroplasts and the translational activity of the plastomeencoded genes. Planta 191, 23–33.
Anderson JW & Done J (1977) Polarographic study of
ammonia assimilation by isolated chloroplasts. Plant
Physiol 60, 504–508.
Matsumura T, Kimata-Ariga Y, Sakakibara H, Sugiyama T, Murata H, Takao T, Shimonishi Y & Hase T
(1999) Complementary DNA cloning and characterization of ferredoxin localized in bundle-sheath cells of
maize leaves. Plant Physiol 119, 481–488.
FEBS Journal 275 (2008) 3193–3206 ª 2008 The Authors Journal compilation ª 2008 FEBS
3205
Amino acid metabolism and translocation
M.-H. Valadier et al.
36 Yonekura-Sakakibara K, Onda Y, Ashikari T, Tanaka
Y, Kusumi T & Hase T (2000) Analysis of reductant
supply systems for ferredoxin-dependent sulfite reductase in photosynthetic and non-photosynthetic organs
of maize. Plant Physiol 122, 887–894.
37 Bottela JR, Verbelen JP & Valpuesta V (1988) Immunocytolocalization of ferredoxin-GOGAT in the cells of
green leaves and cotyledons of Lycopersicon esculentum.
Plant Physiol 87, 255–257.
38 Jin T, Huppe HC & Turpin DH (1998) In vitro
reconstitution of electron transport from glucose-6phosphate and NADPH to nitrite. Plant Physiol 117,
303–309.
39 Thomas J-C, Ughy B, Lagoutte B & Ajliani G (2006) A
second isoform of the ferredoxin:NADP oxidoreductase
generated by an in-frame initiation of translation. Proc
Natl Acad Sci USA 103, 1836818373.
40 Kunzelmann P & Schafer E (1985) Phytochrome-mediă
ated phototropism in maize mesocotyls. Relation
between light and Pfr gradients, light growth response
and phototropism. Planta 165, 424–429.
41 Usuda H (1988) Adenine nucleotide levels, the redox
state of the NADP system, and assimilatory force in
nonaqueously purified mesophyll chloroplasts from
maize leaves under different light intensities. Plant
Physiol 88, 1461–1468.
42 Sclimutz D & Brunold C (1985) Localization of nitrite
and sulfite reductase in bundle sheath and mesophyll
cells of maize leaves. Physiol Plant 64, 523–528.
43 Neuhaus HE & Emes MJ (2000) Non-photosynthetic
metabolism in plastids. Annu Rev Plant Physiol Plant
Mol Biol 51, 111–134.
44 Reed AJ, Below FE & Hagement R (1980) Grain
protein accumulation and the relationship between leaf
nitrate reductase and protease activities during grain
development in maize (Zea mays L.). I. Variation
between genotypes. Plant Physiol 66, 164–170.
3206
45 Magasanik B (1982) Genetic control of nitrogen assimilation in bacteria. Annu Rev Genet 16, 135–168.
46 Minambres B, Olivera ER, Jensen RA & Luengo JM
(2000) A new class of glutamate dehydrogenases (GDH).
Biochemical and generic characterization of the first
member, the AMP-requiring NAD-specific GDH of
Streptomyces clavuligerus. J Biol Chem 275, 39529–39542.
47 Bhadula SK & Shargool PD (1991) P plastidial localization and origin of l-glutamate dehydrogenase in a soybean cell culture. Plant Physiol 95, 258–263.
48 van Bel AJE (2003) The phloem, a miracle of ingenuity.
Plant Cell Environ 25, 125–149.
49 Boorer KJ & Fischer W-N (1997) Specificity and stoichiometry of the Arabidopsis H+ ⁄ amino acid transporter AAP5. J Biol Chem 272, 13040–13046.
50 Thum KE, Shasha DE, Lajay LV & Coruzzi GM
(2003) Light and carbon signalling pathways.
Modeling circuits of interactions. Plant Physiol 132,
440–452.
51 Sakakibara H, Kawabata S, Hase T & Sugiyama T
(1992) Differential effects of nitrate and light on the
expression of glutamine synthetase and ferredoxindependent glutamate synthase in maize. Plant Cell
Physiol 33, 1193–1198.
52 Chevalier C, Bourgeois E, Just D & Raymond P (1996)
Metabolic regulation of asparagine synthetase gene
expression in maize (Zea mays L.) root tips. Plant J 9,
1–11.
53 Rosen H (1957) A modified ninhydrin colorimetric analysis for amino acids. Arch Biochem Biophys 67, 10–15.
´
54 Feraud M, Masclaux-Daubresse C, Ferrario-Mery S,
Pageau K, Lelandais M, Ziegler C, Leboeuf E, Jouglet
T, Viret L, Spampinato A et al. (2005) Expression of a
ferredoxin-dependent glutamate synthase gene in mesophyll and vascular cells and functions of the enzyme in
ammonium assimilation in Nicotiana tabacum (L.).
Planta 222, 667–677.
FEBS Journal 275 (2008) 3193–3206 ª 2008 The Authors Journal compilation ª 2008 FEBS