Application of the GIS and R program for landslide susceptibility mapping: A case study in Van Yen, Yen Bai, Vietnam
Bạn đang xem bản rút gọn của tài liệu. Xem và tải ngay bản đầy đủ của tài liệu tại đây (1.98 MB, 10 trang )
Science on Natural Resources and Environment 43 (2022) 104-113
Science on Natural Resources and Environment
Journal homepage: tapchikhtnmt.hunre.edu.vn
APPLICATION OF THE GIS AND R PROGRAM FOR
LANDSLIDE SUSCEPTIBILITY MAPPING: A CASE STUDY
IN VAN YEN, YEN BAI, VIETNAM
Pham Thi Thanh Thuy1, Le Thi Thu Ha1, Vu Ngoc Phan1, Vu Ngoc Phuong2
1
Hanoi University of Natural Resources and Environment, Vietnam
2
University of Transport and Communications, Vietnam
Received 31 October 2022; Accepted 28 November 2022
Abstract
This study presents the r.landslide tool, an open source add-on to the open source
Geographic Information System (GIS) GRASS software for landslide susceptibility
mapping. The tool was written in Python language and works on the top of an Arti�cial
Neural Network (ANN) fed with environmental parameters and landslide databases,
such as: DTM, NDVI, Aspect, Geology, Faults, Plan Curvature, Pro�le Curvature,
Rivers, Roads, Slope, No Landslide Zones (NLZ). In order to illustrate the application
and e ectiveness of the developed tool, a case study is presented for the Van Yen
district, Yen Bai province, Vietnam. The resulted map with four landslide susceptibility
classes: Low, moderate, high and very high susceptibility for landslide, which are
derived based on the correspondence with landslide inventory. The map indicates that
about 42 % of the area is very high and highly susceptible for landslide. The landslide
susceptibility map can be useful for the decision - makers and planners in choosing
suitable locations for the long - term development.
Keywords: GIS; R program/r.landslide; Landslide susceptibility zone.
Corresponding author. Email:
1. Introduction
Landslide is soil or rock mass
movement, or a mixture of both, down and
out of the slope. The natural properties of
slope stability in uence its susceptibility.
Recently year, Vietnam is in uenced by
climate change and human activities such
excavation of slopes for road cuts or such
deforestation, which are one of the causes
contributed to landslide happening [1].
Especially, the Northwest mountainous
regions of Vietnam with various strong
dissections by tectonics, the areas are
104
heavily a�ected by landslide phenomenon
[2]. Frequency and magnitude of landslides
in this region have been increased, not only
causing losses and damages to people,
also damaging enormous properties in
terms of both direct and indirect costs [3,
4]. Landslide susceptibility mapping is
an urgent task for the government for the
mountainous regions [1], including Yen
Bai province, to nd proper and e�ective
strategies in land use planning and
management, also forecasting and nding
measures to mitigate subsequent losses to
future landslides [3, 4].
Research on the assessment and
prediction of landslide susceptibility
uses a variety of methods depending
on the size of the study area. For
example: The heuristic method applies
geomorphological mapping to large scale areas based on experts’ judgment of
variables such as slopes, faults and geology
[5]. The deterministic method applies
to the small - scale area by analyzing
the geotechnical stability condition of
parameters. A statistical approach is a new
approach to mapping landslide hazards
by combining the possibility of landslides
from statistical data and the physical
parameters of landslides. This approach is
appropriate for assessing landslides in a
medium - scale area which helps inform
the regional spatial planning [6, 7].
Research on landslides has been widely
applied using a method or comparing
them [8 - 12].
Open-source Geographic Information
System (GIS) software can process
statistical models [13]. One of them is R
program, which has cutting - edge spatial
packages to behave as a fully featured GIS
[14]. Several advantages of the utilization
of R language for spatial analysis such
as its command line interfaces allow
a rapid description of work ow and
reproducibility, has sophisticated and
customizable graphics and have an
extensive range of functions through an
additional package, integrated processing,
analysis and modeling framework. R
statistics has a wide range of functions
and libraries that allow using all statistical
tools with advanced visualization
capabilities [15]. The recent updates of
the libraries attached to R environment
made the output and result very handy and
without the need to change the working
environment or data format, which will
reduce the uncertainty of switching back
and forth between di�erent geospatial and
statistical analysis platforms [12]. Some
studies have analyzed land susceptibility
using R Program [16 - 18]. This study
uses R program to control landslides and
generate a landslides susceptibility map
in Van Yen district, Yen Bai province.
2. Study area
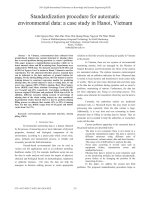
2.1. Geographical location
The study area is Mo Vang commune
in Van Yen district (Figure 1) (Van Yen
is a mountainous district in the north of
Yen Bai province, Vietnam), between
the latitude 21º50’30”N and 22º12’N
and between longitude 104º23’E and
104º48’E. The region happens landslide
phenomena, losing properties and
damaging constructions each year.
Figure 1: The study area map
2.2. Topography, hydrology and
climate
Van Yen’s topography is relatively
complex, with many hills and mountains.
The terrain gradually rises from the
Southeast to the Northwest. The di�erence
in topography between regions in the
district is very large, with the highest
peak at 1.952 m, the lowest place being
20 m above sea level.
105
The river system is dense with
di�erent terrain types: Craggy high
mountains, rolling hills, alternating with
valleys and narrow alluvial elds along
the river.
Van Yen district is located in a hot
and humid tropical climate, combined
with divided terrain to form two climate
sub - regions:
relationship between analysis factors [23].
- Northern region (from Trai Hut to
the North): Average elevation is 500 m
above sea level. The average temperature
is 21 - 23 ºC. Average rainfall is 1.800
mm/year. Humidity is often 80 - 85 %,
this area is a�ected by Lao wind;
- Southern mountainous region (from
Trai Thu to the South): In uenced by the
northeast monsoon, with heavy rainfall,
average 1.800 - 2.000 mm/year, average
temperature 23 - 24 ºC, air humidity 81
to 86 %.
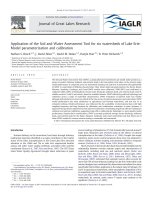
consists of a set of inputs (conditioning
Its central processing unit is the neuron,
which performs mathematical procedures
to generate a result based on a set of input
variables [24]. The application of an ANN
in landslide susceptibility analysis is ideal
because this phenomenon is dynamic and
nonlinear [25]. The ANN architecture
factors), a set of intermediate layers
(hidden
layers)
that
perform
the
processing and an output layer [24] with
the prediction result (Figure 2).
2.3. Population
The average population as of 2019
is 129.059 people. Of which, 61.981
men, accounting for 50,37 %; Female
61.075 people, accounting for 49,63 %.
The population in urban areas accounts
for 10,26 %; rural areas accounted for
89,76 %. The natural population growth
Figure 2: The structure of ANN
rate is 15,12 %, the average population
density is 88,5 people/km2. The whole
ANN implementation in this research
district has 12 ethnic groups: Kinh was performed using the R program
ethnic group (52,86 %), Tay ethnic group in QGIS which was written by Python
(15,58 %), Dao ethnic group (25,4 %),
language.
H’mong ethnic group (4,43 %), other
In QGIS, adding a script is simple.
ethnic groups (1.73 %).
The easiest way is to open the Processing
3. Data and methodology
toolbox and choose Create new R script
An arti cial neural network (ANN)
is a set of interconnected nodes useful from the R menu (labelled with an R icon)
for modeling problems with a complex at the top of the Processing Toolbox.
106
Figure 3: Flow chart of the research
Figure 4: Clip DEM by case study area mask
Collected data in raster format
(DTM, NDVI, Aspect, Geology, Faults,
Plan Curvature, Pro le Curvature, Rivers,
Roads, Slope) and vector format (study
area boundary layer, landslide inventory
layer). Clip all raster layers using as a
mask the vector layer of the group’s sub
- area (Figure 4 and Figure 5).
Causative factors for landslide
susceptibility mapping in a certain study
area should be selected carefully based
on relevance, availability, and scale of
mapping [19, 20]. Based on previous
studies in the same area [21, 22],
thereby determining the correlation and
contribution of factors in the occurrence
of landslides, therefore, 10 factors
considered for landslide susceptibility
mapping. Figure 3 describes causative
factors which were selected: DTM,
NDVI, Aspect, Geology, Faults, Plan
Curvature, Pro le Curvature, Rivers,
Roads, Slope as input data. Rasters must
have with equal resolution and extension
of the clipped DTM.
107
1. DTM
2. NDVI
3. Aspect
4. Geology
5. Faults
6. Plan Curvature
7. Pro�le Curvature
8. Rivers
9. Roads
10. Slope
Figure 5: The causative factors for landslide susceptibility mapping
Clip the landslide inventory layer using as a mask the vector layer of the group’s
sub - area (Figure 6).
Figure 6: Extraction of landslide inventory points in the study area
108
De ne areas with low possibility
of landslides according to the Slope
angle. We assume No Landslide Zones
(NLZ) are where the Slope is < 20° or
> 70° (Figure 7a). After that, vectorize
the resulted raster (use the raster values
as categories) to obtain the polygons of
NLZ (Figure 7b). Thus, the landslide
susceptibility areas will not appear in the
NLZ.
a) NLZ: The Slope is <20° or >70°
b) Vectorize the resulted raster to vector
Figure 7: No Landslide Zones (NLZ)
Create new eld ‘Hazard’ in both of
the attribute table (landslide inventory
points and NLZ polygons). Where, 0 is
assigned to the NLZ and 1 to the landslide
inventory. Perform a Union operation on
the Landslide Inventory polygons. Decide
a training - testing ratio that was used for
machine learning model.
After selecting the percentage of
polygons for training/testing accordingly
for both Landslide Inventory and NLZ.
Create new text attribute ‘Train_Test’ and
assign the value ‘Training’ or ‘Testing’
a) NLZ polygons
according to the select polygons. Create
40 random points inside the polygons
since the landslide inventory is a point
layer, we have to create the same number
of points that represent the NLZ. That
means we use 70/30 training/testing
ration we will need to have 56 training
points and 24 testing.
Using Select Features by Value
and select according to the ‘Hazard’
and ‘Train_Test’ eld to to assign the
corresponding value (Figure 8).
b) Landslide inventory
Figure 8: Attribute tables of NLZ polygons and Landslide inventory
109
Merge separately the training and testing layers into two point layers training
points and testing points. Sample the environmental factors with the training and
testing point layers. At the end, we have two layers trainingPointsSampled and
testingPointsSampled with following attribute tables:
a) TrainingPointSampled
b) TestingPointSampled
Figure 9: Attribute tables of two layers trainingPointsSampled and testingPointsSampled
4. Result and discussions
(“�rstlandslide susceptibility layer” <
After running the r.landslide tool, the 0.25)* 1 + ((“�rst landslide susceptibility
layer” >= 0.25) AND (“�rst landslide
result is a landslide susceptibility layer
susceptibility layer” < 0.5)) *2 + ((“�rst
(Figure 10).
landslide susceptibility layer”>= 0.5)
AND (“�rst landslide susceptibility layer”
< 0.75))*3 + (“�rst landslide susceptibility
layer” >=0.75)* 4
Figure 10: The �rst landslide susceptibility
layer
Reclassify the susceptibility raster
map using 4 classes such as: [0, 0.25) =
low; [0.25, 0.5) = moderate; [0.5, 0.75) =
high; [0.75, 1] = very high (Figure 12b).
Use the QGIS tool Raster->Raster
Calculator along with this expression:
110
Figure 11: The second landslide
susceptibility layer after reclassi�cation
with resolution: 12.5 m
Validation of the e ciency of
the GIS and R program on producing
landslide susceptibility maps was done
using Accuracy Assessment tool (which
is also written in Python language).
Reclassify the
rst landslide
susceptibility layer into two classes
(0 and 1): [0,0.5) = 0 and [0.5,1) = 1.
The reclassi ed raster is used only for
the validation purpose. In QGIS, use
Processing => Scripts => Accuracy
Assessment and Sampling and �rst
landslide susceptibility layer and
testingPointsSampled.gpkg,
where
reference data column is Hazard.
Table 1 shows that landslide
sensitivity classi cation accuracy reaches
75 %. The accuracy of the classi cation
results is average, which can be useful to
decision makers and planners in choosing
the right site for long - term development.
Table 1. Error matrix
Use the QGIS Processing tool
Processing => Raster Analysis => Raster
layer zonal statistics to compute the
population counts in each susceptibility
class. The percentage of population per
each susceptibility class was showed by a
pie chart (Table 2).
Table 2. Landslide susceptibility Zonal Statistic
Figure 12: Landslide susceptibility statistic chart
The study applied GIS and the R
program of QGIS to process input information
layers, created necessary data layers for the
purpose of calculating and statistic the extent
of landslides in the Mo Vang area, Van Yen
district, Yen Bai province, Vietnam. Research
results show that landslide with very high
risk is 23 %, high is 19 %, medium is 7 %
and low is 51 %.
R is an open - source program
widely used because it can integrate data,
analysis, and graphs in a single narrative.
We use this program to model landslide
susceptibility algorithm using the ANN
method and apply it to a region. The result
of this model is no di�erent from using
ArcGIS software.
111
However, creating a landslides
susceptibility algorithm in R model has
an advantage in that other researchers can
reinterpret and reevaluate the program
by modifying its syntax and codes to get
a more comprehensive and appropriate
model applying in a speci c region.
Acknowledgments: The author
would like to thank Politecnico di Milano,
University and Hanoi University of
Natural Resources and Environment for
providing valuable data and an advanced
GIS course (the course is a product of
international cooperation between the
two universities within the framework of
the Protocol, code number NDT/IT/21/14
led by Dr. Truong Xuan Quang).
REFERENCES
[1]. Q. H. Le (2014). Landslide
inventory and susceptibility assessment for
mountainous provinces in Vietnam. The
government project 2012 - 2017.
[2]. T. Trinh, D. M. Wu & J. Z. Huang
(2016). Application of the analytical hierarchy
process (AHP) for landslide susceptibility
mapping: A case study in Yen Bai province,
Vietnam. Conference: ICETI, Volume: 1,
ISBN 978-1-138-02996-5.
[3]. Bui, T. D., B. Pradhan, O. Lofman,
I. Revhaug & O. B. Dick (2012). Landslide
susceptibility mapping at Hoa Binh province
(Vietnam) using an adaptive neuro-fuzzy
inference system and GIS. Comput. Geosci.
45, 199 - 211.
[4]. Duc, D. M. (2013). Rainfall triggered large landslides on December
15th 2005 in Van Canh district, Binh Dinh
province, Vietnam. Landslides 10(2), 219 230.
[5]. Reichenbach, P., Rossi, M.,
Malamud, B. D., Mihir, M., Guzzetti, F.
(2018). A review of statistically based
landslide susceptibility models. Earth Science Reviews, 180, 60 - 91.
[6]. Rossi, M., Reichenbach, P. (2016).
112
LAND-SE: A software for statistically based
landslide. Geoscienti c Model Development,
p. 9533 - 9543.
[7]. Fausto, G., Alberto C., Mauro C.,
Paola R. (1999). Landslide hazard evaluation:
A review of current techniques and their
application in a multi - scale study, Central
Italy. Geomorphology, p. 181 - 216.
[8]. Anis, Z., Wissem, G., Vali, V.,
Smida, H., Essghaie, G. M. (2019). GIS
- based landslide susceptibility mapping
using bivariate statistical methods in North western Tunisia. Open Geosciences, 11:708726.
[9]. Pamela, Sadisun, I. A., Ari anti,
Y. (2018). Weights of evidence method
for Landslide susceptibility mapping in
Takengon, Central Aceh, Indonesia. IOP
Conference Series: Earth and Environmental
Science, 118, 012037.
[10]. Silalahi, F.E.S., Pamela, Ari anti,
Y., Hidayat, F. (2019). Landslide susceptibility
assessment using frequency ratio model in
Bogor, West Java, Indonesia. Geoscience
Letters, 6(1).
[11]. Singh Pradhan, A. M., Dawadi, A.,
Kim, Y. T. (2012). Use of di erent bivariate
statistical landslide susceptibility methods: A
case study of Khulekhani watershed, Nepal.
Journal of Nepal Geological Society, 44, 1 12.
[12]. Sumaryono, Muslim D., Sulaksana
N., Triana Y. D. (2015). Weights of evidence
method for Landslide susceptibility mapping
in Tandikek and Damar Bancah, West
Sumatra, Indonesia. International Journal of
Science and Research (IJSR), Vol. 4, Issue
10, October 2015, 1283 - 1290.
[13]. Christos P., Christos C. (2018).
Comparison and evaluation of landslide
susceptibility maps obtained from the weight
of evidence, logistic regression, and arti�cial
neural network models. Natural Hazards, vol.
93, no. August 2018, p. 249 - 274.
[14]. Roger, S. B., Edzer, P. and Virgilio
G. R. (2013). Applied spatial data analysis
with R. New York: Springer.
[15]. Hadley, W. (2014). Tidy data.
Journal of Statistical Software, vol. 59, no.
10, p. 1 - 23.
[16]. Althuwaynee, O. F., Musakwa, W.,
Gumbo, T., Reis, S. (2017). Applicability of
R statistics in analyzing landslides spatial
patterns in Northern Turkey. 2nd International
Conference on Knowledge Engineering and
Applications (ICKEA).
[17]. Thinnukool O., Kongchouy, N.,
Choonpradub C. (2014). Detection of land
use change using R program (A case study of
Phuket island, Thailand). Research Journal of
Applied Sciences, 9:228-237.
[18]. Tonini, Marj Abellan, Antonio
(2013). Rockfall detection from terrestrial
LiDAR point clouds: A clustering approach
using R. Journal of Spatial Information
Science. 8. 10.5311/JOSIS.2014.8.123.
[19]. Cascini, L. (2008). Applicability
of landslide susceptibility and hazard zoning
at di erent scales. Eng. Geol. 102(3-4), 164
- 177.
[20]. Soeters, R. & C. J. V. Van Westen
(1996). Slope instability recognition analysis
and zonation.
[21]. Nguyen, T. V. (2009). Building
methodology for estimating geo-hazard risk in
the northwest mountainous cities of Vietnam
using RS&GIS: Case study in Yen Bai city.
Ministry of Sciences and Technology.
[22]. Nguyen, X. K. (2012). Assessment
on present situation of geo-hazards in
provinces of Ha Giang, Cao Bang, Tuyen
Quang and Bac Kan - Causes, forecast zoning
and recommendation for risk prevention and
reduction.
[23]. Tien Bui, D.; Tuan, T. A.; Klempe,
H.; Pradhan, B.; Revhaug, I (2016). Spatial
prediction models for shallow landslide
hazards: A comparative assessment of the
e cacy of Support Vector Machines, Arti�cial
Neural Networks, Kernel Logistic Regression
and Logistic Model Tree. Landslides 2016,
13, 361 - 378.
[24]. Ciaburro, G.; Venkateswaran,
B. (2017). Neural Network with R: Smart
models using CNN, RNN, Deep Learning
and Arti�cial Intelligence Principles. Packt
Publishing Ltd: Birmingham, UK, 2017;
Volume 91.
[25]. Chen, H.; Zeng, Z.; Tang, H.
(2015). Landslide deformation prediction
based on Recurrent Neural Network. Neural
Process. Lett. 2015, 41,169 - 178.
113