Báo cáo khoa học: Surface density of cellobiohydrolase on crystalline celluloses A critical parameter to evaluate enzymatic kinetics at a solid–liquid interface ppt
Bạn đang xem bản rút gọn của tài liệu. Xem và tải ngay bản đầy đủ của tài liệu tại đây (580.5 KB, 10 trang )
Surface density of cellobiohydrolase on crystalline
celluloses
A critical parameter to evaluate enzymatic kinetics at a solid–liquid
interface
Kiyohiko Igarashi, Masahisa Wada, Ritsuko Hori and Masahiro Samejima
Department of Biomaterials Sciences, Graduate School of Agricultural and Life Sciences, The University of Tokyo, Japan
Cellulose degradation is one of the most important
processes in the carbon cycle, since cellulose is the
major component of the cell wall of plants and the
most abundant polymer in nature. In addition to
the cell wall of terrestrial plants, cellulose is found in
marine algae, marine animals and bacteria, and it gen-
erally consists of a mixture of crystalline (cellulose I)
and disordered amorphous regions. Cellulose I is fur-
ther classified into two polymorphs, triclinic cellulose
I
a
and monoclinic cellulose I
b
[1–3], whose detailed
structures have been established recently through syn-
chrotron X-ray and neutron fiber diffraction studies
[4,5]. Cellulose I
a
is metastable, and is irreversibly con-
verted into cellulose I
b
by hydrothermal treatment in
alkaline solution [6].
To degrade cellulose, many organisms produce cellu-
lases that hydrolyze b-1,4-glucosidic linkages of the
polymer. Almost all cellulases can act at amorphous
Keywords
cellobiohydrolase; cellobiose
dehydrogenase; crystalline cellulose;
glycoside hydrolase; solid–liquid interface
Correspondence
M. Samejima, Department of Biomaterials
Sciences, Graduate School of Agricultural
and Life Sciences, The University of Tokyo,
1-1-1 Yayoi, Bunkyo-ku, Tokyo 113–8657,
Japan
Fax: +81 3 58415273
Tel: +81 3 58415255
E-mail:
(Received 3 April 2006, revised 26 April
2006, accepted 2 May 2006)
doi:10.1111/j.1742-4658.2006.05299.x
The enzymatic kinetics of glycoside hydrolase family 7 cellobiohydrolase
(Cel7A) towards highly crystalline celluloses at the solid–liquid interface
was evaluated by applying the novel concept of surface density (q) of the
enzyme, which is defined as the amount of adsorbed enzyme divided by the
maximum amount of adsorbed enzyme. When the adsorption levels of
Trichoderma viride Cel7A on cellulose I
a
from Cladophora and cellulose I
b
from Halocynthia were compared, the maximum adsorption of the enzyme
on cellulose I
b
was $1.5 times higher than that on cellulose I
a
, although
the rate of cellobiose production from cellulose I
b
was lower than that
from cellulose I
a
. This indicates that the specific activity (k) of Cel7A
adsorbed on cellulose I
a
is higher than that of Cel7A adsorbed on cellulose
I
b
. When k was plotted versus q, a dramatic decrease of the specific activity
was observed with the increase of surface density (q-value), suggesting that
overcrowding of enzyme molecules on a cellulose surface lowers their activ-
ity. An apparent difference of the specific activity was observed between
crystalline polymorphs, i.e. the specific activity for cellulose I
a
was almost
twice that for cellulose I
b
. When cellulose I
a
was converted to cellulose I
b
by hydrothermal treatment, the specific activity of Cel7A decreased and
became similar to that of native cellulose I
b
at the same q-value. These
results indicate that the hydrolytic activity (rate) of bound Cel7A depends
on the nature of the crystalline cellulose polymorph, and an analysis that
takes surface density into account is an effective means to evaluate cellulase
kinetics at a solid–liquid interface.
Abbreviations
BMCC, bacterial microcrystalline cellulose; CBD, cellulose-binding domain; CD, catalytic domain; CDH, cellobiose dehydrogenase; FT-IR,
Fourier transform infrared spectrometer; GH, glycoside hydrolase; TEM, transmission electron microscope.
FEBS Journal 273 (2006) 2869–2878 ª 2006 The Authors Journal compilation ª 2006 FEBS 2869
regions of cellulose, whereas only a limited number
can hydrolyze crystalline cellulose [7]. Cellobiohydro-
lase, belonging to glycoside hydrolase (GH) family 7,
is the major secreted protein of many cellulolytic fungi
and is one of the best studied of the enzymes hydrolyz-
ing crystalline cellulose to cellobiose [7–11]. These
enzymes have a two-domain structure: a $50 kDa
catalytic domain (CD) and a small (3 kDa) cellulose-
binding domain (CBD) connected by a highly O-gly-
cosylated linker region [12–15]. Loss of the CBD
causes a significant decrease of crystalline cellulose
decomposition, but has less effect on the hydrolysis of
soluble or amorphous cellulose [16], suggesting that
the adsorption of the enzyme on the surface via the
CBD is important for the effective hydrolysis of crys-
talline cellulose [17–21]. However, if an excess amount
of the enzyme is adsorbed, the CD is unable to bind
appropriately to the cellulose chain owing to steric
interference by other enzyme molecules. This is called
nonproductive binding [15], and the hydrolysis of crys-
talline cellulose is inhibited, even though the amount
of bound enzyme is increased [22].
Although the kinetics of crystalline cellulose hydro-
lysis by cellulases has been investigated intensively, it
remains difficult to compare findings, because of the
variability of cellulose samples. The main reason for
this variability is the difference of surface area between
celluloses from different sources and ⁄ or different prep-
arations. When the hydrolytic activity of cellulase for
one cellulose sample is higher than that for another, it
is difficult to determine whether this is because the
sample has a larger surface area available to the cellu-
lase, or whether the sample is indeed more susceptible
to degradation. In the present study, we therefore
investigated a novel approach to evaluate cellulase kin-
etics on solid substrates by using the surface density of
the enzyme (defined as the adsorbed amount of the
enzyme divided by the maximum adsorption of the
enzyme) as a parameter, in order to avoid the influence
of heterogeneity of crystalline cellulose.
Results
Analysis of highly crystalline celluloses
Highly crystalline celluloses, cellulose I
a
from Cladopho-
ra and cellulose I
b
from Halocynthia and from hydro-
thermally treated Cladophora, were characterized by
transmission electron microscope (TEM), synchrotron
diffraction, and Fourier transform infrared spectrometer
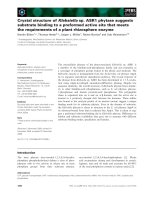
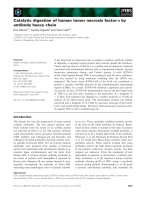
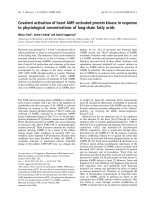
(FT-IR). Electron micrographs (Fig. 1A–C) showed
that cellulose microcrystals prepared by hydrochloric
acid treatment appear as slender rods, more than 1 mm
in length and about 20 nm wide. Although the micro-
graphs are very similar, differences were observed in the
synchrotron X-ray fiber diffraction diagrams (Fig. 1D–
F). The diagrams of crystalline celluloses from Halocyn-
thia (Fig. 1E) and hydrothermally treated Cladophora
(Fig. 1F) were typical of resolved I
b
patterns, whereas
that of Cladophora cellulose showed patterns of both
cellulose I
a
and I
b
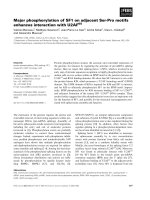
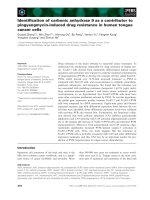
. The FT-IR spectra of the samples
were different (Fig. 2). The characteristic peaks of cellu-
lose I
a
(3240 cm
)1
) and cellulose I
b
(3270 cm
)1
) in the
spectrum of Cladophora cellulose were consistent with a
mixture of 70% cellulose I
a
and 30% cellulose I
b
(Fig. 2A), whereas only the peak at 3270 cm
)1
was seen
in the spectra of Halocynthia (Fig. 2B) and hydrother-
mally treated Cladophora (Fig. 2C) celluloses. This is
because the hydrothermal treatment converted Clado-
phora cellulose I
a
to cellulose I
b
.
Adsorption of Cel7A on crystalline celluloses
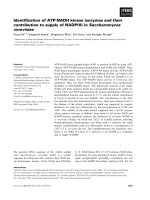
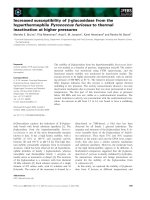
The enzyme concentration dependence of adsorbed
Cel7A was estimated at various time points of incuba-
tion. Figure 3A shows the results at 120 min of incuba-
tion and Fig. 3B is the Scatchard plot (A-A ⁄ [F]) of the
data in Fig. 3A. Cellulose I
b
from Halocynthia showed
the highest adsorption of Cel7A, which was approxi-
mately 1.5 times higher than that of cellulose I
a
from
Cladophora at all Cel7A concentrations tested. Since the
Scatchard plots (Fig. 3B) for the three cellulose samples
were all nonlinear, the binding of Cel7A cannot be fitted
to a simple Langmuir equation; instead, a two-binding
site model (Eqn 1) should be employed for simulation.
The adsorption parameters obtained by simulation
using Eqn 1 are summarized in Table 1. Although the
adsorption constants for high-affinity binding (K
ad1
)
varied among substrates, those for low-affinity binding
(K
ad2
) were all quite similar. The hydrothermal treat-
ment, which converts cellulose I
a
to cellulose I
b
,
decreased K
ad1
and increased A
1
, but had no effect on
K
ad2
or A
2
. The maximum amount of adsorbed enzyme
(A
max
) for cellulose I
b
from Halocynthia was
3.2 ± 0.4 nmolÆmg cellulose
)1
, which was 1.5 times
higher than that for cellulose I
a
from Cladophora
(2.2 ± 0.2 nmolÆmg cellulose
)1
).
Hydrolysis of highly crystalline celluloses
The time course of changes in cellobiose concentration
was monitored for various concentrations of Cel7A
using highly crystalline celluloses as substrates. Figure 4
shows the degradation of cellulose I
a
from Cladophora
as a representative result. The hydrolysis of the
crystalline cellulose was well fitted by the double expo-
Surface density of GH family 7 cellobiohydrolase K. Igarashi et al.
2870 FEBS Journal 273 (2006) 2869–2878 ª 2006 The Authors Journal compilation ª 2006 FEBS
nential plot versus time (Eqn 7), which shows an initial
rapid increase followed by constant production of
cellobiose. The cellobiose production increased with
increase of total Cel7A concentration up to 2.2 lm
(Abs
280
$0.2), but decreased at higher concentrations.
The velocities of cellobiose production were estimated
by differentiation of cellobiose concentration in the
reaction mixture, as described in Experimental proce-
dures, then plotted versus Cel7A concentration.
Figure 5 shows the results obtained at the incubation
time of 120 min. As expected from the time course
of cellobiose concentration, cellobiose production by
Cel7A from cellulose I
a
increased with increasing
enzyme concentration, reaching a maximum value
(0.56 lmolÆmin
)1
) at a free enzyme concentration, [F],
of 1.3 lm, and then decreasing with further increase of
enzyme concentration to 0.42 lmolÆmin
)1
at [F] ¼
6.9 lm. Similar patterns were obtained using cellulose I
b
from Halocynthia and hydrothermally treated Cladopho-
ra as substrates, although the concentration provid-
ing maximum cellobiose production was lower
([F] $0.5 lm ) than in the case of cellulose I
a
from
Cladophora.
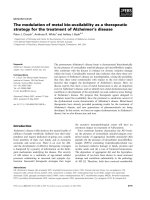
Surface density plot of Cel7A
To analyze the difference between the hydrolytic
properties towards cellulose I
a
and cellulose I
b
, the
specific activity of adsorbed enzyme (k) was plotted
versus surface density of Cel7A (q), as shown in
Fig. 6. The specific activity towards all crystalline
celluloses was high at low surface density, but
decreased with increase of the q-value, suggesting
that the crowding of Cel7A on the surface of crys-
talline celluloses causes a decrease of the activity.
The specific activity for cellulose I
a
from Cladophora
was approximately twice that for cellulose I
b
from
Halocynthia. Interestingly, hydrothermal treatment
caused a significant decrease of specific activity for
Cladophora cellulose, and the q–k curve became quite
similar to that for cellulose I
b
from Halocynthia,
although these celluloses had been prepared from
different sources by different methods. This suggests
that the surface density plot compensates for the dif-
ferent surface areas of crystalline celluloses, and
reflects the specific activity of Cel7A for the crystal-
line polymorphs.
Fig. 1. TEM pictures (top row) and synchrotron X-ray fiber diffraction diagrams (bottom row) of highly crystalline celluloses. Bar indicates
500 nm. (A) and (D) Cellulose I
a
from Cladophora; B and E, cellulose I
b
from Halocynthia; C and F, cellulose I
b
from hydrothermally treated
Cladophora. Circles in the bottom row indicate characteristic differences between cellulose I
a
and cellulose I
b
.
K. Igarashi et al. Surface density of GH family 7 cellobiohydrolase
FEBS Journal 273 (2006) 2869–2878 ª 2006 The Authors Journal compilation ª 2006 FEBS 2871
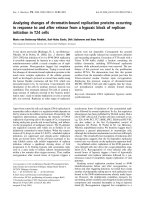
Cellobiose production and high- and low-affinity
absorption were plotted versus surface density, as
shown in Fig. 7. The cellobiose production reached
maximum at q ¼ 0.4 (cellulose I
a
from Cladophora)
and q ¼ 0.3 (cellulose I
b
from Halocynthia and hydro-
thermally treated Cladophora), suggesting that suffi-
cient space for another 1.5 or 2.3 enzyme molecules
per adsorbed molecule must be left free in order to
achieve optimum hydrolysis of crystalline cellulose.
The surface density dependence at high- and low-affin-
ity adsorption sites (solid and dashed lines, respect-
ively) showed that the high-affinity curve almost
reaches saturation at the q-value of 0.4 (cellulose I
a
)or
0.3 (cellulose I
b
), whereas the low-affinity curve rises
linearly with increase of q. Moreover, the cellobiose
production increased at lower concentration, where the
high-affinity adsorption was observed, whereas it
declined with increase of low-affinity adsorption. These
results may indicate that the high- and low-affinity
binding curves represent the amounts of productive
and nonproductive enzyme, respectively.
Discussion
The hydrolysis of crystalline cellulose has generally been
evaluated using microcrystalline cellulose [(Avicel),
FMC Corp, Newark, DE] as a substrate, but heterogen-
eity of the substrate often causes variable results in the
case of cellobiohydrolase [7,20]. To avoid this difficulty,
bacterial microcrystalline cellulose (BMCC) has been
used as a homogeneous crystalline cellulose substrate
instead [22–24]. However, as we have shown, the proper-
ties of BMCC as a substrate of cellulase are strongly
dependent on the preparation conditions [25]. In the
present study, we wished to compare the highly crystal-
line celluloses from Cladophora and Halocynthia, and
faced difficulties in evaluating their hydrolysis, presuma-
bly because of the differences of surface area and ⁄ or sur-
face structure. There are several techniques to estimate
the surface area of solid cellulose from the amounts of
A
B
Fig. 3. Enzyme concentration dependence of the amount of
adsorbed Cel7A (A) and Scatchard plot (B).
n, cellulose I
a
from
Cladophora; s, cellulose I
b
from Halocynthia; d, cellulose I
b
from
hydrothermally treated Cladophora. The adsorption of Cel7A was
measured after incubation for 120 min with 1 mgÆmL
)1
of crystalline
cellulose at 30 °C as described in Experimental procedures. The
lines represent fitting the data to Eqn 1 in Experimental procedures.
A
B
C
Fig. 2. FT-IR spectra of highly crystalline celluloses. A, cellulose I
a
from Cladophora; B cellulose I
b
from Halocynthia; C, cellulose I
b
from hydrothermally treated Cladophora. Dotted line shows charac-
teristic peaks of cellulose I
a
and cellulose I
b
at 3240 cm
)1
(right)
and 3270 cm
)1
(left), respectively.
Surface density of GH family 7 cellobiohydrolase K. Igarashi et al.
2872 FEBS Journal 273 (2006) 2869–2878 ª 2006 The Authors Journal compilation ª 2006 FEBS
bound small molecular compounds, such as nitrogen,
water or dye, but the results cannot be used to evaluate
the surface area available to cellulases, since CBDs are
adsorbed only on limited regions of crystalline cellulose,
mainly hydrophobic surfaces, as demonstrated previ-
ously [26–29]. Therefore, we developed the novel con-
cept of using surface density as a parameter to express
the adsorption of cellobiohydrolase relative to the maxi-
mum amount of adsorption of the enzyme (A
max
), in
order to obtain the specific activity of Cel7A for crystal-
line cellulose.
This approach has several advantages: (1) A
max
pro-
vides a measure of the surface area of crystalline cellu-
lose available as a substrate of cellulase. It is reported
that cellulose I
b
from Halocynthia has a greater hydro-
phobic surface than cellulose I
a
from Cladophora [30].
Indeed, in the present study, A
max
of Cel7A on cellu-
lose I
b
from Halocynthia was 1.5 times higher than
that on cellulose I
a
from Cladophora. (2) Generally,
specific activity of cellulase is evaluated based on
the amount of added enzyme. However, this is
Fig. 5. Free enzyme concentration dependence of cellobiose pro-
duction by Cel7A after incubation for 120 min.
n, cellulose I
a
from
Cladophora; s, cellulose I
b
from Halocynthia; d, cellulose I
b
from
hydrothermally treated Cladophora. The rate of cellobiose produc-
tion was estimated by the fitting the time course of cellobiose con-
centration to Eqn 7, and by calculation using Eqn 8.
Fig. 6. Surface density dependence of specific activity for adsorbed
enzyme after incubation for 120, 180, 240, and 320 min.
n, cellu-
lose I
a
from Cladophora; s, cellulose I
b
from Halocynthia; d, cellu-
lose I
b
from hydrothermally treated Cladophora. q-andk-values
were estimated by using Eqns 3 and 9, respectively.
Table 1. Adsorption parameters of highly crystalline celluloses for Cel7A. The adsorption parameters were calculated by nonlinear fitting of
the data after incubation for 120, 180, 240, 320 min to Eqn 1.
K
ad1
a
K
ad2
a
A
1
b
A
2
b
A
max
b
Cladophora 8.5 ± 0.7 0.44 ± 0.04 0.22 ± 0.02 2.0 ± 0.2 2.2 ± 0.2
Halocynthia 3.2 ± 0.2 0.43 ± 0.02 0.80 ± 0.08 2.4 ± 0.3 3.2 ± 0.4
Hydrothermally
treated Cladophora
4.7 ± 0.4 0.43 ± 0.04 0.58 ± 0.03 2.1 ± 0.3 2.6 ± 0.3
a
lM
)1
,
b
nmolÆmg cellulose
)1
.
Fig. 4. Time course of cellobiose production from Cladophora cellu-
lose by Cel7A. The total concentration of Cel7A in the reaction mix-
ture was as follows:
n, 0.40 lM; d, 0.84 lM; m,1.3lM; h, 2.2 lM;
s,4.3l
M; n,8.6lM. The cellobiose concentration in the reaction
mixture was measured with a CDH–cytochrome c redox system as
described in Experimental procedures.
K. Igarashi et al. Surface density of GH family 7 cellobiohydrolase
FEBS Journal 273 (2006) 2869–2878 ª 2006 The Authors Journal compilation ª 2006 FEBS 2873
inappropriate for cellobiohydrolases, since only
adsorbed enzyme represents ‘working enzyme’ which
generates the product (cellobiose). Therefore, we
should evaluate the specific activity of adsorbed
enzyme. (3) During the hydrolytic process, the shape
and surface area of the solid substrate should change
with the reaction time. By using surface density as a
parameter, however, we can monitor the changes of
surface area and compensate for them, whether they
arise from the nature of the cellulose preparations, or
from changes during hydrolysis. In the present study,
indeed, the A
max
values decreased slightly with increas-
ing incubation time, perhaps because of a reduction of
the surface area owing to enzymatic degradation (data
not shown). However, cellobiose production also
decreased correspondingly with increasing incubation
time, suggesting that the surface density plot can allow
for the real-time changes of the substrate caused by
the enzymatic reaction.
In nature, there are two crystalline polymorphs of
cellulose, celluloses I
a
and I
b
[1–3], and cellulose I
a
has
been reported to be degraded much faster than cellu-
lose I
b
[31,32]. To analyze the differences in degrada-
bility in detail, we prepared three crystalline cellulose
samples, I
a
-rich crystalline cellulose from Cladophora,
natural cellulose I
b
from Halocynthia , and cellulose I
b
generated by hydrothermal treatment of Cladophora
cellulose, and we compared the hydrolysis of these
samples by Cel7A. The q–k plot of Cel7A (Fig. 6)
clearly indicates that the higher degradability of cellu-
lose I
a
is mainly due to a higher specific activity of the
enzyme for this substrate than for cellulose I
b
, but is
not due to a larger surface area. As hydrothermal
treatment does not cause any change of shape of cellu-
lose microfibrils [33], differences of specific activity
should reflect differences in the arrangements of cellu-
lose chains in the two crystalline polymorphs. Quite
recently, the detailed structures of celluloses I
a
and I
b
were solved by synchrotron X-ray and neutron fiber
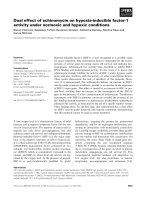
diffraction analyses [4,5]. The top views of the hydro-
phobic surfaces of celluloses I
a
and I
b
are compared in
Fig. 8. If cellulose chains of the first layer (colored
cyan) are superimposed in the two crystalline poly-
morphs, the cellobiose units in the second layer of cel-
luloses I
a
(colored yellow) are completely opposed to
those of cellulose I
b
(colored green). This suggests that
Cel7A can distinguish this difference between the first
and second layers of crystalline celluloses. A possible
reason for this is that the structural difference may
cause a difference of steric hindrance at CBD or CD,
and thus may affect the processivity of Cel7A on the
crystalline celluloses [8,22,34].
The enzyme concentration dependence of absorp-
tion ([F]–A plot; Fig. 3A) fitted well to the two-bind-
ing site equation reported by Sta
˚
hlberg et al. [16]. In
addition, when the high- and low-affinity adsorption
curves and cellobiose production were plotted versus
surface density (Fig. 7), it appeared that cellobiose
production increased in the high-affinity phase of
adsorption, whereas it was apparently inhibited with
increase of low-affinity binding. This may be because
high-affinity adsorption involves both CD and CBD
(productive binding), whereas low-affinity adsorption
A
B
C
Fig. 7. Surface density dependence of high- (solid line) and low-
affinity (dashed line) adsorption of Cel7A with plot of cellobiose pro-
duction. These lines are drawn using the parameters in Table 1,
and the plots were obtained from the results after incubation for
120, 180, 240, and 320 min. A, cellulose I
a
from Cladophora;B,cel-
lulose I
b
from Halocynthia; C, cellulose I
b
from hydrothermally trea-
ted Cladophora.
Surface density of GH family 7 cellobiohydrolase K. Igarashi et al.
2874 FEBS Journal 273 (2006) 2869–2878 ª 2006 The Authors Journal compilation ª 2006 FEBS
may involve only CBD (nonproductive binding). In
Table 1, moreover, a higher K
ad1
-value was observed
for cellulose I
a
than cellulose I
b
, although K
ad2
for
all samples were quite similar to each other. This
phenomenon might be explained by the different
affinity of productive binding, i.e. CD of Cel7A may
hold cellulose I
a
more tightly than cellulose I
b
,
resulting in higher cellobiose production from cellu-
lose I
a
than cellulose I
b
at same q-value. Since low
affinity (nonproductive) binding contributes much
more to the total amount of adsorbed enzyme than
high-affinity (productive) binding, a drastic decrease
of specific activity is observed with increase of q,as
shown in Fig. 7. To elucidate the relationship
between adsorption and hydrolysis, further experi-
ments with mutant enzymes and detailed kinetic
studies will be necessary.
The simple analytical method used in the present
study, i.e. measuring the adsorption of the enzyme and
the concentration of products in the same reaction
mixture, makes it possible to evaluate the enzyme kin-
etics at a solid–liquid interface. This approach not only
provides novel insights into cellulose–cellulase interac-
tion, but also should be relevant to many other
enzymes acting on insoluble substrates having a limited
surface area.
Experimental procedures
Cellulose and enzyme preparations
Cellulose samples from green alga Cladophora sp. and
tunicate Halocynthia roretzi were used in this study. They
were purified by repeated treatments with 5% KOH and
0.3% NaClO
2
solutions [35], then broken into small frag-
ments using a double-cylinder type homogenizer. The
Cladophora cellulose was further hydrothermally treated
in 0.1 m NaOH solution at 260 °C [33]. The cellulose
samples thus obtained were hydrolyzed with 4 m HCl
solution at 80 °C for 6 h, and then suspensions of cellu-
lose microcrystals dispersed in water were prepared as
reported previously [36].
Cel7A from Trichoderma viride (formerly known as cello-
biohydrolase I) was purified from a commercial cellulase
mixture, Meicelase (Meiji Seika Kaisha Co., Ltd, Tokyo,
Japan) as described previously [25,37]. Recombinant cello-
biose dehydrogenase (CDH) was produced by Pichia
pastoris and purified from the culture filtrate as described
previously [38]. The purity of these enzymes was confirmed
by SDS ⁄ PAGE. No detectable contamination of b-glu-
cosidase or hydroxyethylcellulose-degrading activity was
observed in Cel7A or CDH.
Analysis of highly crystalline celluloses
Dilute suspensions of crystalline celluloses were dropped on
carbon-coated copper grids, allowed to dry, and observed
with a JEOL 2000EX TEM (Jeol Ltd., Tokyo, Japan),
operating at 200 kV under diffraction contrast in the
bright-field mode [39].
For the X-ray fiber diffraction analysis, oriented films
of cellulose microcrystals were prepared as previously
reported [40]. The X-ray fiber patterns were obtained on
a flat imaging plate, R-AXIS IV
++
(Rigaku Corporation,
Tokyo, Japan), at room temperature using synchrotron
radiation with a wavelength of 0.1 nm in beam line
BL40B2 at the SPring-8 facility in Japan.
Fig. 8. Views of the hydrophobic surfaces
of cellulose I
a
(left) and cellulose I
b
(right).
The cellulose chains in the first layer are su-
perimposed and colored cyan. The chains in
the second layer are colored yellow (cellu-
lose I
a
) and green (cellulose I
b
). The struc-
tures are based on the results reported by
Nishiyama et al. [4,5].
K. Igarashi et al. Surface density of GH family 7 cellobiohydrolase
FEBS Journal 273 (2006) 2869–2878 ª 2006 The Authors Journal compilation ª 2006 FEBS 2875
Dilute suspensions were cast on glass plates and the dried
films were analyzed with a JASCO FT-IR 615 spectrometer
(JASCO Corporation, Tokyo, Japan) in the region of
4000–400 cm
)1
; 64 scans of 4 cm
)1
resolution were signal-
averaged and stored.
Adsorption of Cel7A on crystalline celluloses
Crystalline cellulose (0.1% w ⁄ v) was incubated with various
concentrations of enzymes (total concentration,
Abs
280
$0.04–1.6) in 1 mL of 50 mm sodium acetate buffer,
pH 5.0, at 30 °C using an end-over-end mixer (12 r.p.m.).
The mixture was centrifuged (15 000 g · 30 s) to terminate
the reaction after incubation for 15, 30, 60, 120, 180, 240,
and 320 min, and the supernatant (900 lL) was collected.
The absorbance at 280 nm of the supernatant was measured
after the termination of the enzymatic reaction, and the con-
centration of free enzyme [F](lm) was determined based on
an absorption coefficient at 280 nm of 88 250 m
)1
Æcm
)1
for
T. viride Cel7A, estimated from the amino acid sequence
of the enzyme [41]. The amount of adsorbed enzyme (A,
nmolÆmg cellulose
)1
) was calculated by subtraction of the
amount of free enzyme from the amount of added enzyme, as
described previously [16,22,23,42]. The amount of adsorbed
enzyme was plotted versus free enzyme concentration, based
on a two-binding-site model for Cel7A analysis [16], using
the following equation:
A ¼ A
1
=ð1=K
ad1
þ½FÞ þ A
2
=ð1=K
ad2
þ½FÞ ð1Þ
where A
1
and A
2
are the adsorption maxima of high- and low-
affinity binding (nmol ⁄ mg-cellulose); K
ad1
and K
ad2
are the
adsorption constants of the high- and low-affinity binding
sites (lm
)1
). The maximum amount of adsorbed enzyme
(A
max
,nmolÆmg cellulose
)1
) and the surface density (q)of
Cel7A were defined according to the following equations:
A
max
¼ A
1
þ A
2
ð2Þ
q ¼ A=A
max
¼ A=ðA
1
þ A
2
Þð3Þ
Measurement of cellobiose formation
The concentration of cellobiose formed in the supernatant
was estimated from the amount of cytochrome c reduced by
CDH, as follows. The supernatant (after incubation for 15,
30, 60, 120, 180, 240, and 320 min) was kept at 4 °C for 18 h
to allow the anomeric configuration to reach equilibrium.
The supernatant (100 lL) was then incubated for 3 min with
200 nm recombinant CDH and 50 lm cytochrome c (bovine
heart, Wako Pure Chemical Industries, Ltd, Osaka, Japan)
in 50 mm sodium acetate buffer, pH 4.0, at 30 °C, and the
absorbance at 525.6 (Abs
525.6
: isosbestic point of oxidized
and reduced cytochrome c) and 550.0 nm (Abs
550.0
) were
measured. The reduced cytochrome c concentrations were
calculated using the following equations
Abs
550:0
¼ e
ox
550:0
½C
ox
þe
red
550:0
½C
red
ð4Þ
Abs
525:6
¼ e
525:6
ð½C
ox
þ½C
red
Þ ð5Þ
½C
red
¼ðe
525:6
Abs
550:0
À e
ox
550:0
e
red
550:0
Abs
525:6
Þ=
e
525:6
ðe
red
550:0
À e
ox
550:0
Þð6Þ
where e
ox
550:0
(¼ 7.80 mm
)1
Æcm
)1
) and e
red
550:0
(¼ 25.8 mm
)1
Æcm
)1
)
are the absorption coefficients at 550.0 nm for oxidized
and reduced cytochrome c, respectively; e
525.6
(¼ 10.2
mm
)1
Æcm
)1
) is the absorption coefficient of cytochrome c
at 525.6 nm; [C
ox
] and [C
red
] are the concentrations of oxid-
ized and reduced cytochrome c, respectively. The proportion
of b-anomer in cellobiose was estimated to be 64.9 ± 0.4%
at the temperature employed in the present study, and it was
assumed that two moles of cytochrome c is reduced by one
mole of b-anomeric cellobiose. Examination of the cellobiose
concentration after 18 h incubation at 4 ° C indicated that
further hydrolysis was minimal (< 2 l m), and this was con-
firmed by comparison of the cellobiose concentrations in
reaction mixtures containing supernatant with and without
ultrafiltration. Since precipitation prevented the measure-
ment of cellobiose concentration at the highest enzyme con-
centration (Abs
280
$1.6), these data was eliminated from the
results.
Analysis of the rate of cellobiose production from
crystalline celluloses
The rate of cellobiose production at various time points
was estimated from fitting of cellobiose concentrations in
the reaction mixtures to the following equation based on
Va
¨
ljama
¨
e et al. [22]:
PðtÞ¼að1 À e
Àbt
Þþcð1 À e
Àdt
Þð7Þ
where P(t) is the cellobiose concentration (lm); t is time
(min); and a, b, c, and d are empirical constants. The rate
of cellobiose production (v) was calculated by the differenti-
ation of Eqn 7 as follows:
v ¼ dPðtÞ=dt ¼ abe
Àbt
þ cde
Àdt
ð8Þ
Thus, the specific activity of adsorbed enzyme k (min
)1
)
was defined as follows:
k ¼ v=A ð9Þ
In order to evaluate the steady-state reaction of Cel7A, the
rate of cellobiose production and the specific activity were
calculated from the data points after incubation for 120,
180, 240, and 320 min. It must be pointed out that we have
used Eqns 7 and 8 only for estimating the rate of cellobiose
production at each time point. We do not include any phys-
ical interpretation to the equations or the constants since
they are empirical.
Surface density of GH family 7 cellobiohydrolase K. Igarashi et al.
2876 FEBS Journal 273 (2006) 2869–2878 ª 2006 The Authors Journal compilation ª 2006 FEBS
Acknowledgements
The authors are grateful to Professor Gunnar Johans-
son (Department of Biochemistry, University of Upp-
sala) for valuable discussions about the kinetics of
cellobiohydrolases. We thank Dr K. Noguchi (Tokyo
University of Agriculture and Technology, Tokyo,
Japan) for his help during the synchrotron radiation
experiments, which were performed at BL40B2 in
SPring-8 with the approval of the Japan Synchrotron
Research Institute (JASRI) (Proposal no. 2002A0435-
NL2-np). This research was supported by a Grant-in-
Aid for Scientific Research to MS (no. 17380102)
from the Japanese Ministry of Education, Culture,
Sports and Technology, and a Research Fellowship to
RH from the Japan Society for the Promotion of
Science.
References
1 Atalla RH & Vanderhart DL (1984) Native cellulose. A
composite of two distinct crystalline forms. Science 223,
283–285.
2 Sugiyama J, Vuong R & Chanzy H (1991) Electron
diffraction study on the two crystalline phases occurring
in native cellulose from an algal cell-wall. Macromole-
cules 24, 4168–4175.
3 Vanderhart DL & Atalla RH (1984) Studies of micro-
structure in native celluloses using solid-state
13
C NMR.
Macromolecules 17, 1465–1472.
4 Nishiyama Y, Langan P & Chanzy H (2002) Crystal
structure and hydrogen-bonding system in cellulose I
b
from synchrotron X-ray and neutron fiber diffraction.
J Am Chem Soc 124, 9074–9082.
5 Nishiyama Y, Sugiyama J, Chanzy H & Langan P
(2003) Crystal structure and hydrogen bonding system
in cellulose I
a
from synchrotron X-ray and neutron fiber
diffraction. J Am Chem Soc 125, 14300–14306.
6 Sugiyama J, Okano T, Yamamoto H & Horii F (1990)
Transformation of Valonia cellulose crystals by an alka-
line hydrothermal treatment. Macromolecules 23, 3196–
3198.
7 Teeri TT (1997) Crystalline cellulose degradation: new
insight into the function of cellobiohydrolases. Trends
Biotechnol 15, 160–167.
8 Divne C, Sta
˚
hlberg J, Reinikainen T, Ruohonen L,
Pettersson G, Knowles JK, Teeri TT & Jones TA (1994)
The three-dimensional crystal structure of the catalytic
core of cellobiohydrolase I from Trichoderma reesei.
Science 265, 524–528.
9 Divne C, Sta
˚
hlberg J, Teeri TT & Jones TA (1998) High-
resolution crystal structures reveal how a cellulose chain
is bound in the 50 A
˚
long tunnel of cellobiohydrolase I
from Trichoderma reesei. J Mol Biol 275, 309–325.
10 Reinikainen T, Srisodsuk M, Jones A & Teeri TT
(1993) Enzymatic hydrolysis of crystalline cellulose by
Trichoderma reesei cellobiohydrolase I. Protein Eng 6,
49–49.
11 Teeri TT, Koivula A, Linder M, Wohlfahrt G, Divne C
& Jones TA (1998) Trichoderma reesei cellobiohydro-
lases: why so efficient on crystalline cellulose? Biochem
Soc Trans 26, 173–178.
12 Abuja PM, Schmuck M, Pilz I, Tomme P, Claeyssens
M & Esterbauer H (1988) Structural and functional
domains of cellobiohydrolase I from Trichoderma reesei:
a small angle X-ray scattering study of the intact
enzyme and its core. Eur Biophys J Biophys 15, 339–
342.
13 Johansson G, Sta
˚
hlberg J, Lindeberg G, Engstrom A &
Pettersson G (1989) Isolated fungal cellulase terminal
domains and a synthetic minimum analog bind to cellu-
lose. FEBS Lett 243, 389–393.
14 Shoemaker S, Schweickart V, Ladner M, Gelfand D,
Kwok S, Myambo K & Innis M (1983) Molecular clon-
ing of exo-cellobiohydrolase I derived from Trichoderma
reesei Strain-L27. Bio ⁄ Technology 1, 691–696.
15 Tomme P, Van Tilbeurgh H, Pettersson G, Van Damme
J, Vandekerckhove J, Knowles J, Teeri T & Claeyssens
M (1988) Studies of the cellulolytic system of Tricho-
derma reesei QM 9414: analysis of domain function in
two cellobiohydrolases by limited proteolysis. Eur J
Biochem 170, 575–581.
16 Sta
˚
hlberg J, Johansson G & Pettersson G (1991) A new
model for enzymatic hydrolysis of cellulose based on
the two-domain structure of cellobiohydrolase I.
Bio ⁄ Technology 9, 286–290.
17 Lee YH & Fan LT (1982) Kinetic studies of enzymatic
hydrolysis of insoluble cellulose: analysis of the initial
rates. Biotechnol Bioeng 24, 2383–2406.
18 Lee YH & Fan LT (1983) Kinetic studies of enzymatic
hydrolysis of insoluble cellulose. (II) Analysis of
extended hydrolysis times. Biotechnol Bioeng 25, 939–
966.
19 Nidetzky B, Steiner W & Claeyssens M (1994) Cellulose
hydrolysis by the cellulases from Trichoderma reesei:
adsorptions of two cellobiohydrolases, two endocellu-
lases and their core proteins on filter paper and their
relation to hydrolysis. Biochem J 303, 817–823.
20 Sattler W, Esterbauer H, Glatter O & Steiner W
(1989) The effect of enzyme concentration on the rate
of the hydrolysis of cellulose. Biotechnol Bioeng 33,
1221–1234.
21 Steiner W, Sattler W & Esterbauer H (1988) Adsorption
of Trichoderma reesei cellulase on cellulose: experimen-
tal data and their analysis by different equations.
Biotechnol Bioeng 32, 853–865.
22 Va
¨
ljama
¨
e P, Sild V, Pettersson G & Johansson G (1998)
The initial kinetics of hydrolysis by cellobiohydrolases I
K. Igarashi et al. Surface density of GH family 7 cellobiohydrolase
FEBS Journal 273 (2006) 2869–2878 ª 2006 The Authors Journal compilation ª 2006 FEBS 2877
and II is consistent with a cellulose surface – erosion
model. Eur J Biochem 253, 469–475.
23 Gilkes NR, Jervis E, Henrissat B, Tekant B, Miller RC
Jr, Warren RA & Kilburn DG (1992) The adsorption of
a bacterial cellulase and its two isolated domains to
crystalline cellulose. J Biol Chem 267, 6743–6749.
24 Va
¨
ljama
¨
e P, Sild V, Nutt A, Pettersson G & Johansson G
(1999) Acid hydrolysis of bacterial cellulose reveals differ-
ent modes of synergistic action between cellobiohydrolase
I and endoglucanase I. Eur J Biochem 266, 327–334.
25 Samejima M, Sugiyama J, Igarashi K & Eriksson K-EL
(1997) Enzymatic hydrolysis of bacterial cellulose. Car-
bohydr Res 305, 281–288.
26 Linder M, Mattinen ML, Kontteli M, Lindeberg G,
Sta
˚
hlberg J, Drakenberg T, Reinikainen T, Pettersson G
& Annila A (1995) Identification of functionally impor-
tant amino acids in the cellulose-binding domain of
Trichoderma reesei cellobiohydrolase I. Protein Sci 4,
1056–1064.
27 Mattinen ML, Kontteli M, Kerovuo J, Linder M,
Annila A, Lindeberg G, Reinikainen T & Drakenberg T
(1997) Three-dimensional structures of three engineered
cellulose-binding domains of cellobiohydrolase I from
Trichoderma reesei. Protein Sci 6, 294–303.
28 Reinikainen T, Ruohonen L, Nevanen T, Laaksonen L,
Kraulis P, Jones TA, Knowles JKC & Teeri TT (1992)
Investigation of the function of mutated cellulose-bind-
ing domains of Trichoderma reesei cellobiohydrolase I.
Proteins 14, 475–482.
29 Lehtio J, Sugiyama J, Gustavsson M, Fransson L,
Linder M & Teeri TT (2003) The binding specificity and
affinity determinants of family 1 and family 3 cellulose
binding modules. P Natl Acad Sci USA 100, 484–489.
30 Helbert W, Nishiyama Y, Okano T & Sugiyama J
(1998) Molecular imaging of Halocynthia papillosa cellu-
lose. J Struc Biol 124, 42–50.
31 Hayashi N, Sugiyama J, Okano T & Ishihara M (1997)
The enzymatic susceptibility of cellulose microfibrils of
the algal-bacterial type and the cotton-ramie type.
Carbohyd Res 305, 261–269.
32 Hayashi N, Sugiyama J, Okano T & Ishihara M (1997)
Selective degradation of the cellulose I
a
component in
Cladophora cellulose with Trichoderma viride cellulase.
Carbohydr Res 305, 109–116.
33 Yamamoto H, Horii F & Odani H (1989) Structural
changes of native cellulose crystals induced by annealing
in aqueous alkaline and acidic solutions at high tem-
peratures. Macromolecules 22, 4130–4132.
34 Kipper K, Va
¨
ljama
¨
e P & Johansson G (2005) Processive
action of cellobiohydrolase Cel7A from Trichoderma
reesei is revealed as ‘burst’ kinetics on fluorescent poly-
meric model substrates. Biochem J 385, 527–535.
35 Sugiyama J, Persson J & Chanzy H (1991) Combined
infrared and electron diffraction study of the poly-
morphism of native celluloses. Macromolecules 24 ,
2461–2466.
36 Araki J, Wada M, Kuga S & Okano T (1998) Flow
properties of microcrystalline cellulose suspension pre-
pared by acid treatment of native cellulose. Colloid
Surface A 142, 75–82.
37 Imai T, Boisset C, Samejima M, Igarashi K & Sugiyama
J (1998) Unidirectional processive action of cellobiohy-
drolase Cel7A on Valonia cellulose microcrystals. FEBS
Lett 432, 113–116.
38 Yoshida M, Ohira T, Igarashi K, Nagasawa H, Aida K,
Hallberg BM, Divne C, Nishino T & Samejima M
(2001) Production and characterization of recombinant
Phanerochaete chrysosporium cellobiose dehydrogenase
in the methylotrophic yeast Pichia pastoris. Biosci
Biotechnol Biochem 65, 2050–2057.
39 Wada M & Okano T (2001) Localization of I
a
and I
b
phases in algal cellulose revealed by acid treatments.
Cellulose 8, 183–188.
40 Nishiyama Y, Kuga S, Wada M & Okano T (1997)
Cellulose microcrystal film of high uniaxial orientation.
Macromolecules 30, 6395–6397.
41 Pace CN, Vajdos F, Fee L, Grimsley G & Gray T
(1995) How to measure and predict the molar absorp-
tion coefficient of a protein. Protein Sci 4, 2411–2423.
42 Samejima M, Ohkubo T, Igarashi K, Isogai A, Kuga S,
Sugiyama J & Eriksson K-EL (1997) The behaviour of
Phanerochaete chrysosporium cellobiose dehydrogenase
on adsorption to crystalline and amorphous celluloses.
Biotechnol Appl Biochem 25, 135–141.
Surface density of GH family 7 cellobiohydrolase K. Igarashi et al.
2878 FEBS Journal 273 (2006) 2869–2878 ª 2006 The Authors Journal compilation ª 2006 FEBS