Báo cáo khoa học: Inhibitory properties and solution structure of a potent Bowman–Birk protease inhibitor from lentil (Lens culinaris, L) seeds ppt
Bạn đang xem bản rút gọn của tài liệu. Xem và tải ngay bản đầy đủ của tài liệu tại đây (962.13 KB, 16 trang )
Inhibitory properties and solution structure of a potent
Bowman–Birk protease inhibitor from lentil
(Lens culinaris, L) seeds
Enzio M. Ragg
1
, Valerio Galbusera
1
, Alessio Scarafoni
1
, Armando Negri
2
, Gabriella Tedeschi
2
,
Alessandro Consonni
1
, Fabio Sessa
1
and Marcello Duranti
1
1 Department of Agri-Food Molecular Sciences, Universita
`
degli Studi, Milano, Italy
2 Department of Animal Pathology, Hygiene and Veterinary Public Health-Section of Biochemistry, Universita
`
degli Studi, Milano, Italy
Bowman–Birk inhibitor (BBI) proteins are serine prote-
ase inhibitors. First isolated from soybean seeds by
Bowman [1] and subsequently characterized by Birk
et al. [2], BBIs are found in several plant sources, spe-
cially mono- and dicotyledonous seeds [3]. BBIs from
dicots usually have a molecular mass of 7–8 kDa and
are double-headed serine protease inhibitors, while
those from monocots are more variable both in size
and inhibitory sites.
Like many other cotyledonary proteins, BBIs are the
products of a multigene family within the same species
[4–6] and consequently several isoforms have been
Keywords
Bowman–Birk inhibitor; antitryptic activity;
dicotyledonous plant; Lens culinaris; nuclear
magnetic resonance
Correspondence
E. M. Ragg, Department of Agri-Food
Molecular Sciences, Universita
`
degli Studi,
via Celoria 2, 20133 Milano, Italy
Fax: +39 0250316801
Tel: +39 0250316800
E-mail:
(Received 10 May 2006, revised 29 June
2006, accepted 5 July 2006)
doi:10.1111/j.1742-4658.2006.05406.x
Bowman–Birk serine protease inhibitors are a family of small plant pro-
teins, whose physiological role has not been ascertained as yet, while
chemopreventive anticarcinogenic properties have repeatedly been claimed.
In this work we present data on the isolation of a lentil (Lens culinaris, L.,
var. Macrosperma) seed trypsin inhibitor (LCTI) and its functional
and structural characterization. LCTI is a 7448 Da double-headed tryp-
sin ⁄ chymotrypsin inhibitor with dissociation constants equal to 0.54 nm
and 7.25 nm for the two proteases, respectively. The inhibitor is, however,
hydrolysed by trypsin in a few minutes timescale, leading to a dramatic loss
of its affinity for the enzyme. This is due to a substantial difference in the
k
on
and k*
on
values (1.1 lm
)1
Æs
)1
vs. 0.002 lm
)1
Æs
)1
), respectively, for the
intact and modified inhibitor. A similar behaviour was not observed with
chymotrypsin. The twenty best NMR structures concurrently showed a
canonical Bowman–Birk inhibitor (BBI) conformation with two antipodal
b-hairpins containing the inhibitory domains. The tertiary structure is
stabilized by ion pairs and hydrogen bonds involving the side chain and
backbone of Asp10-Asp26-Arg28 and Asp36-Asp52 residues. At physiolo-
gical pH, the final structure results in an asymmetric distribution of oppos-
ite charges with a negative electrostatic potential, centred on the
C-terminus, and a highly positive potential, surrounding the antitryptic
domain. The segment 53–55 lacks the anchoring capacity found in analog-
ous BBIs, thus rendering the protein susceptible to hydrolysis. The inhibi-
tory properties of LCTI, related to the simultaneous presence of two key
amino acids (Gln18 and His54), render the molecule unusual within the
natural Bowman–Birk inhibitor family.
Abbreviations
BApNA, N-benzoyl-
DL-arginine-p-nitroanilide; BBI, Bowman–Birk inhibitor; COSY-DQf, two-dimensional correlation spectroscopy double-
quantum filtered; C.S.I., chemical shift index; DSS, 2,2-dimethyl-2-silapentane-5-sulfonate sodium salt; GPpNA, N-glutaryl-
L-phenylalanine-p-
nitroanilide; LCTI, Lens culinaris trypsin inhibitor; LCTI*, Lens culinaris trypsin inhibitor hydrolysed form; MD, molecular dynamics; MSTI,
Medicago scutellata trypsin inhibitor; PSTI-IVb, Pisum sativum trypsin inhibitor isoform IVb; SA, simulated annealing; sBBI, soybean
Bowman–Birk inhibitor; SFTI, sunflower trypsin inhibitor.
4024 FEBS Journal 273 (2006) 4024–4039 ª 2006 The Authors Journal compilation ª 2006 FEBS
identified [7,8]. Despite their pronounced microhetero-
geneity, BBIs share a relatively high degree of sequence
homology, especially in the inhibitory domains, and a
highly conserved disulphide bridge network [9], form-
ing a consensus motif (Prosite code: PDOC00253).
There have been various hypotheses on the physiolo-
gical function of BBIs, including defence and protec-
tion, developmentally regulatory and sulphur-storage
roles, with no conclusive definition as yet [10]. Plant
cell biology data on BBIs biosynthesis and transloca-
tion to the secretory pathway are also missing.
From the inhibitory viewpoint most BBIs, especially
those from dicotyledonous seeds, have a double-
headed structure bearing two independent proteinase
binding sites, often one trypsin and one chymotrypsin
domain. Various synthetic peptides consisting of a sin-
gle inhibitory domain and bearing the inhibitory activ-
ity have been produced and this has served to identify
the role of specific amino acid residues in the protein-
ase inhibition [11].
The renewed interest for this class of protease inhibi-
tors [12] is mainly based on the findings that BBIs may
act as cancer preventive and suppressing agents in a
wide variety of in vitro and in vivo model systems [13].
In some cases, as in the treatment of oral leukoplakia
lesions, the use of BBIs has reached phase II of clinical
trials [14,15]. Besides the anticarcinogenic effects, BBIs
also showed anti-inflammatory activity, by inhibiting
the inflammation-mediating proteases [16]. More
recently, a number of patents on the use of BBIs
against various apparently unrelated diseases have
appeared [17–19]. The molecular basis of these BBI
activities has not been established so far, however,
because a high protease activity has been shown to be
connected with tumour formation and other diseases
associated with angiogenesis; it has been suggested
that the chemopreventive action might be related to
the protease, especially antichymotrypsin, inhibitory
activity [20].
There has been more and more research into the
involvement of specific food proteins and peptides as
causative agents in the prevention and control of
various diseases, many of which are related to the
Western lifestyle, such as obesity, diabetes and cardio-
vascular diseases. Furthermore, the search for novel
biologically active protein molecules and their exploita-
tion as drugs or nutraceutical agents imply their func-
tional and structural characterization. Based on these
considerations, the identification of novel BBI inhibi-
tors, either as natural compounds or synthetic pep-
tides, and the elucidation of their structural and
functional properties, is extremely important. A recent
review dealt with legume-derived inhibitors [21].
We present here our results on the isolation, func-
tional and structural analysis of a BBI from lentil
(Lens culinaris L. var. Macrosperma) seeds. Our isola-
tion procedure yielded a protein in sufficient amounts
and purity to obtain the complete amino acid sequence
and
1
H-NMR chemical shift assignment, as well as the
measurement of interproton distances, by means of
homonuclear correlation and nuclear Overhauser
effect experiments. The experimental values were then
applied as restraints for molecular dynamics calcula-
tions leading to the three-dimensional solution
structure of the protein. Kinetic studies have shown
that the isolated BBI from Lens culinaris seeds (Lens
culinaris trypsin inhibitor; LCTI) is characterized by
unusual inhibitory properties within the family of nat-
ural Bowman–Birk inhibitors.
Results
Purification, mass spectrometry analysis and
primary structure determination of LCTI
The purification of LCTI from lentil seeds involved var-
ious chromatographic steps, including a final affinity
chromatography step on agarose-immobilized trypsin.
The antitrypsin activity was measured at every purifica-
tion step by N-benzoyl-dl-arginine-p-nitroanilide
(BApNA) hydrolysis assays. Purity was greater than
98%, as proved by RP-HPLC and SDS ⁄ PAGE (not
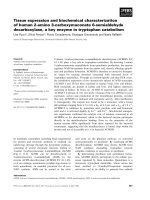
shown). The final product was characterized by N-ter-
minal amino acid sequencing, mass spectrometry
(MALDI-TOF) (Fig. 1), amino acid sequence analysis
of Lys-C generated fragments and
1
H-NMR. The isola-
ted 67 amino acid protein had the same primary struc-
ture as a recently published BBI, named LCI1.7,
extracted from Lens culinaris var. Microsperma [22],
with the exception of a C-terminal missing glutamic
acid residue (SwissProt Acc. No. Q8W4Y8). The
molecular mass calculated from the primary structure
(7448.29 Da assuming seven disulfide bonds) agrees
with the one determined by mass spectrometry
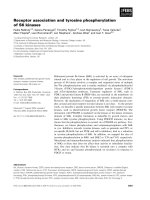
(7446.63 Da). In the amino acid sequence (Fig. 2),
several characteristic regions could be identified, inclu-
ding 14 Cys residues and the consensus sequences
CTR(K)SxPPTC and CxY(L ⁄ R)SxPxQ(K)C for the
antitrypsin and antichymotrypsin sites, respectively [5].
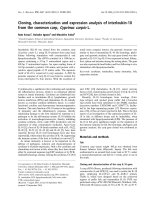
Figure 2 shows the amino acid sequence alignment of
LCTI with other inhibitors of the Leguminosae family
of known 3D structure. Sequence identity of lentil BBI
ranged from a minimum of 47% with Lima bean BBI
to a maximum of 82% with pea BBI. Major differences
are located at the N- and C-termini. Identities or con-
servative substitutions were observed at the inhibition
E. M. Ragg et al. Inhibitory properties and NMR structure of a lentil BBI
FEBS Journal 273 (2006) 4024–4039 ª 2006 The Authors Journal compilation ª 2006 FEBS 4025
sites, with the only exception being Medicago scutellata
BBI, which, because it is a double trypsin inhibitor [23],
has an arginine residue instead of a tyrosine or leucine
in the position P1 of the antichymotryptic site (P and P¢
nomenclature according to Schechter and Berger [24]).
Antitrypsin and antichymotrypsin activity assays
The inhibitory activity of LCTI was determined at
pH 8.2, by monitoring the hydrolysis of the chromo-
genic substrates BApNA and N-glutaryl-l-phenylalan-
ine-p-nitroanilide (GPpNA) in the presence of bovine
trypsin and a-chymotrypsin, respectively, and increas-
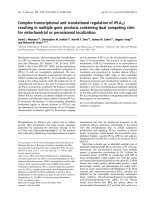
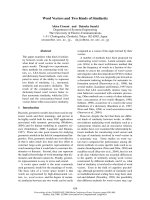
ing amounts of LCTI. Figure 3 reports the amount of
hydrolysed BApNA as a function of time. In the pres-
ence of LCTI, two distinct kinetic regimes with differ-
ent rate constants were present. This effect was more
evident for equimolar LCTI ⁄ trypsin mixtures, whereas
in the case of low amounts of LCTI the first kinetic
phase vanished after a few minutes of the reaction.
N-terminal amino acid sequencing of the proteolytic
fragments (see below) proved that hydrolysis actually
occurred in the antitrypsin site at the cleavable N-ter-
minal P1-P1¢ bond (not shown).
The kinetic model assumed (Scheme 1) implies the
formation of a 1 : 1 complex [25] and is the simplest
one able to fit with sufficient accuracy the experimental
results.
The k
cat
⁄ K
M
ratio was derived by fitting the experi-
mental data in the absence of inhibitor and agreed
with k
cat
and K
M
independently determined by
means of standard Lineweaver–Burk analysis. At
[LCTI] ⁄ [trypsin] ¼ 0.38, as LCTI is hydrolysed within
a few minutes (Fig. 3, curve 1), its inhibitory activity is
mainly due to Lens culinaris trypsin inhibitor hydro-
Fig. 2. Sequence alignment of LCTI with other inhibitors from Leguminosae family of known 3D structure. Accession numbers are from
Brookhaven Protein Data Bank and refer to the following proteins: LCTI (2AIH_lens, this work); MSTI (1MVZ_Medicago); PSTI-IVb (1PBI_
pea); sBBI (1BBI_soya); lima bean trypsin inhibitor (LBTI) (1H34_lima). T and CT denote P1 residues in the antitrypsin and antichymotrypsin
sites, respectively.
Fig. 3. Hydrolysis of 213 lM BApNa as function of time in the pres-
ence of 0.1 l
M trypsin (pH 8.2, 37 °C) and the following amounts
of LCTI: 0 l
M (¯, curve 0), 0.038 lM (*, curve 1), 0.11 lM (·, curve
2), 0.225 l
M (h, curve 3).
Fig. 1. MALDI-TOF mass spectrum of LCTI. Sin: sinapinic acid. The
insert shows an expansion of the molecular peak.
Scheme 1.
Inhibitory properties and NMR structure of a lentil BBI E. M. Ragg et al.
4026 FEBS Journal 273 (2006) 4024–4039 ª 2006 The Authors Journal compilation ª 2006 FEBS
lysed form (LCTI*), leading to an accurate measure-
ment of k*
on
and k*
off
. At [LCTI] ⁄ [trypsin] ¼ 1.1 and
2.25 the conversion of LCTI into LCTI* (Fig. 3,
curves 2 and 3), allowed the simultaneous computation
of k
off
, k*
on
and k*
off
. The k
on
value was assumed by
analogy with soybean BBI [26]. The two dissociation
constants (K
d
¼ k
off
⁄ k
on
and K*
d
¼ k*
off
⁄ k*
on
, relative
to the virgin and modified inhibitor, respectively) were
calculated on the basis of the derived kinetic constants.
The results, obtained after simultaneous fitting of all
the experimental curves, are reported in Table 1.
The same type of kinetic analysis was applied for
assaying the antichymotryptic activity. In analogy to
the previous experiment, a partial loss of chymotrypsin
inhibitory activity was observed, but it was less evident
due to a lower rate of hydrolysis and, more import-
antly, to a minor difference between K
d
and K*
d
(Table 1).
1
H-NMR sequential assignments and secondary
structure determination
A total of 62 NH-H
a
interactions were detected
through the analysis of the TOCSY and two-dimen-
sional correlation spectroscopy double-quantum
filtered (COSY-DQf) experiments, allowing the identifi-
cation of the characteristic amino acid spin systems.
The arginine residues were identified through the
connectivities with their e-NH protons. Two amide
protons, belonging to spin systems of the type NH-
CH
a
-CH
b
2
and later identified as Asp10 and Asp36,
were detected at very low field (11.48–11.49 p.p.m.).
Sequential assignments were performed using well
established procedures [27] on the basis of the
d
NN
(i,i+1) and d
aN
(i,i+1) interactions observed in the
NOESY experiments. Other weak connectivities were
detected in the TOCSY and NOESY spectra, where
the sequential assignment pathway between residues 12
and 16 was found split in two, thus suggesting that a
minor form of LCTI (% 10%) was present in the solu-
tion. As residue 16 is located in the antitrypsin site,
this form was attributed to LCTI*. Additional reso-
nances, attributed to LCTI*, were found for Thr53
and His54. This finding is consistent with the presence
of a minor peak in the mass spectra, which corres-
ponds to a mass increase of 18 Da, as expected from
the hydrolysis of one peptide bond (Fig. 1, insert).
Moreover, minor peaks corresponding to the sequence
starting with Ser17 were detected in the previously
mentioned amino acid sequence analysis (not shown).
Indeed, both NMR and MS spectra showed that the
amount of hydrolysed form increased when the inhib-
itor was kept in solution at pH 3.1 for few days,
suggesting a particular intrinsic lability of the Arg16-
Ser17 bond to hydrolysis at acidic pH.
The sequential inter-residue interactions provided a
means for defining the cis-trans conformation for the
two pairs of contiguous prolines. Thus, Pro20 and
Pro46 were found in trans-conformation, because of
the strong Pro19H
a
-Pro20H
d
and Pro45H
a
-Pro46H
d
interactions, whereas Pro19 and Pro45 were classified
as cis by means of the detected sequential d
aa
(i,i+1)
interactions, respectively, with Gln18 and Asn44.
No d
(i,i+3)
interaction was observed, thus excluding
the presence of any helical segment or type-I ⁄ II turn,
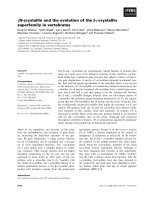
within the protein. Figure 4 reports the relevant
sequential NOE interactions for the two inhibitory
regions, located in the Thr11-Val25 and Lys37-Tyr51
segments. They are characterized by clusters of strong
d
aN
(i,i+1) and weak d
aN
(i,i+1) interactions and,
Table 1. Kinetic and thermodynamic parameters for the inhibitory activity of LCTI against bovine trypsin (BT) and a-chymotrypsin (BCT),
measured at pH 8.2. k
on
· 10
)6
values taken from [26].
k
on
· 10
)6
(M
)1
Æs
)1
) k
off
· 10
3
(s
)1
) k* · 10
)3
(M
)1
Æs
)1
) k*
off
· 10
3
(s
)1
) K
d
· 10
9
(M) K*
d
· 10
9
(M) K
hyd
BT 1.1 0.60 ± 0.15 2.0 ± 0.8 0.82 ± 0.01 0.54 ± 0.1 410 ± 95 759
BCT 0.2 1.45 ± 0.21 12.5 ± 5.0 0.40 ± 0.05 7.25 ± 1.08 32 ± 13 4.4
Fig. 4. LCTI b-hairpin elements (segments Thr11-Val25 and Lys37-
Tyr51), with observed NOE interactions (double-arrow) and hydro-
gen bonds involving the slowly exchanging amide protons (dotted
line). T and CT denote the antitrypsin and antichymotrypsin sites,
respectively.
E. M. Ragg et al. Inhibitory properties and NMR structure of a lentil BBI
FEBS Journal 273 (2006) 4024–4039 ª 2006 The Authors Journal compilation ª 2006 FEBS 4027
together with several detected long-range d
aa
and d
aN
interactions, define two b-hairpin secondary structure
elements.
Figure 5A reports the chemical shift index (C.S.I.)
for H
a
, in comparison with the corresponding soybean
BBI values. Random coil values were taken from [28].
Positive values indicate a residue propensity for exten-
ded or b-sheet structure [29]. Thus, the C.S.I. analysis
identifies six b-sheet regions. The LCTI data are very
similar to soybean, with the exception of the 26–29
segment, with positive C.S.I. values more similar to
Medicago scutellata trypsin inhibitor (MSTI) [23] and
the 49–55 segment, characterized by a marked reduc-
tion in propensity for an extended conformation.
At the end of the antitrypsin and antichymotrypsin
b-hairpin, the segments Thr21-Cys22 and Gln47-Gln49
experience long-range interactions, respectively, with
the segment Thr53-Lys55 and Arg28-Glu29. In these
cases, however, the pattern of the observed NOE inter-
actions is not sufficient to indicate the presence of
additional b-strands, but rather a spatial proximity of
these short segments to the b-hairpins.
Measured values of the vicinal coupling constants
provided additional restraints for the corresponding
dihedral angles, to be introduced in the restrained
molecular mechanics and dynamics calculations. The
N- and C-terminus segments appeared rather structure-
less, with no detected long-range NOE up to the
Cys8-Cys61 disulphide bond.
Deuterium exchange experiments and
temperature coefficient measurements
The analysis of the secondary structure suggested the
presence of several hydrogen bonded amide protons,
mainly located near the two inhibitory sites. Deuter-
ium exchange experiments were thus performed, by
directly dissolving the protein in D
2
O and acquiring a
series of one-dimensional spectra at room temperature.
After a few hours after dissolution, 11 amide protons
were still observable and could easily be assigned. In
order to fully characterize the solvent accessibility of
the amide protons, the chemical-shift temperature coef-
ficients (Dd
NH
⁄ DT) were determined by performing a
series of TOCSY experiments at various temperatures
(Table 2). As absolute values less than 5 p.p.b.ÆK
)1
indicate solvent protection, the temperature coefficients
are a complementary measurement for the more direct
deuterium-exchange experiments and are particularly
suitable for amide protons in the fast-exchange regime.
The analysis of the experimentally determined values,
and their implication with the peptide tertiary struc-
ture, will be discussed below.
Solution structure of LCTI
The observed NOEs also provided information on the
global protein folding. All the measured vicinal coup-
ling constants and NOE interactions were translated
into restraints for the generation of the solution struc-
ture. Statistics for the total amount of experimental
data are reported in Table 3.
A simulated annealing (SA) procedure was used
starting from a randomly generated linear polypeptide
chain. The actual protocol is described in detail below.
Initially, no disulphide bond definition was introduced
and a limited subset of distances, derived from
NOESY experiments performed at short mixing times
(t
mix
¼ 80 ms), was utilized for generating a starting
restraints set, together with ideal values for /,w dihed-
ral angles. One hundred and fifty structures were
thus obtained and analysed in terms of total energy,
Fig. 5. (A) Comparison of C.S.I. values for LCTI (white) and
soybean BBI (black) calculated with 3-point smoothing. Data for
soybean BBI were taken from Biological Magnetic Resonance Data
Bank (Acc. no. 1495); (B) Local rmsd values calculated from the
superimposition of the 20 NMR-derived structures. b-hairpin
regions are underlined.
Inhibitory properties and NMR structure of a lentil BBI E. M. Ragg et al.
4028 FEBS Journal 273 (2006) 4024–4039 ª 2006 The Authors Journal compilation ª 2006 FEBS
restraint violations and chirality for C
a
atoms. From
the initial set, a family of 55 structures was extracted
with consistent folding topology and disulphide bonds.
The selected structures where refined by another
restrained SA step, starting at 100K, and final minimi-
zation. In order to reduce the overall molecular charge,
during refinement 11 chloride ions were introduced at
random positions, after protonation of all side chains
(the NMR experiments were all performed at pH 3.1),
introduction of a layer of water molecules and switch-
ing the force-field to Charmm22. Vicinal coupling con-
stants for amide protons and the full set of NOESY
cross-peak volumes were finally introduced in place of
the previous dihedral angles and interproton distance
restraints. Assuming isotropic motions, an overall cor-
relation time value of 7 ± 1 ns was found. This value
is consistent with the presence of monomeric species.
Indeed, under these conditions the protein was found
to adopt a monomeric form, as assessed by size exclu-
sion chromatography on Superdex peptide-HPLC and
DOSY experiments.
The best 20 structures were selected on the basis of
Ramachandran plot quality [30]: for this subset of
structures 64.1% amino acid residues were in the most
favoured region; 31.6% in the allowed one; 4.3% in
the generously allowed one. No amino acid was found
in the disallowed region. Figure 6 reports the superim-
posed C
a
chains of the NMR-derived structures.
The calculated rmsd values for selected regions are
reported in Table 3, as well as the statistics of the
considered structures and the relevant conformational
energy parameters. Figure 5B shows the local rmsd
values calculated with a five-residue window. As
judged by the reported rmsd values, the two inhibitory
sites consist of fairly rigid secondary structure ele-
ments, connected by segments with augmented
conformational mobility. The antitrypsin domain
comprises the 11–25 segment, incorporating an anti-
parallel b-sheet (amino acids 11–15 and 21–25) and a
type-VIb b-turn. For this region, the calculated rmsd
value within the deposited structures is 0.62 A
˚
(Table 3). The conformation of the 16–20 region is
mainly defined by the two vicinal prolines (Pro19 and
Pro20), found, respectively, in the cis- and trans-con-
formation, as previously discussed. The corresponding
/,w-values are reported in Table 4 in comparison with
those obtained from the X-ray structure of Pisum sati-
vum trypsin inhibitor isoform IVb (PSTI-IVb) [31].
Folding similarities of LCTI with PSTI-IVb and soy-
bean Bowman–Birk inhibitor (sBBI) are shown in
Fig. 7, reporting the superimposition of C
a
carbons
(rmsd 1.99 and 2.10 A
˚
, respectively, calculated consid-
ering the peptide region within the Cys8-Cys61 bond).
Some conformational heterogeneity of LCTI around
the scissile bond is present, as two conformations were
actually found at the level of Arg16-Ser17, one being
similar to the one of PSTI-IVb. The b-hairpin motif is
stabilized by a hydrogen bond network connecting
Thr11-Val25 and Leu13-Arg23 pairs. The presence of
such hydrogen bonds is proved also by the chemical
shift temperature coefficients (Dd ⁄ DT < 5 p.p.b.ÆK
)1
)
and the very slow solvent exchange rates of the corres-
ponding amide protons (k
ex
<3· 10
)3
min
)1
). Thr21-
NH is also characterized by a low value of chemical
shift temperature coefficient and slow exchange rate.
All other amide protons residing between Thr15 and
Gln18 are solvent exposed. The amide protons of
Cys22 and Cys24, with low chemical temperature coef-
ficients, are not fully exposed to solvent. This indicates
that these residues are involved in other tertiary inter-
actions, in particular with the 52–55 segment. A spatial
Table 2. Temperature coefficients (Dd ⁄ DT) and deuterium
exchange rates (k
ex
) of LCTI amide protons. Estimated accuracy of
temperature coefficient is ± 0.1 p.p.b.ÆK
)1
.
Residue
Dd ⁄ DT
(p.p.b.ÆK
)1
)
k
ex
· 10
3
(min
)1
) Residue
Dd ⁄ DT
(p.p.b.ÆK
)1
)
k
ex
· 10
3
(min
)1
)
D2 )6.1 – C35 )4.4 < 600
D3 )6.5 > 600 D36 )5.8 > 600
V4 )7.8 < 40 K37 )2.1 < 3
K5 )7.6 < 40 C38 )10.0 –
S6 )5.8 > 600 V39 )5.1 < 3
A7 )6.8 – C40 )9.4 –
C8 )4.0 > 600 A41 )3.4 < 600
C9 )5.1 > 600 Y42 )6.5 > 600
D10 )5.8 > 600 S43 )4.8 –
T11 )5.8 < 3 N44 )10.0 –
C12 )8.8 – Q47 )6.5 < 3
L13 )4.4 < 3 C48 )8.0 < 40
C14 )8.5 < 40 Q49 )1.2 < 3
T15 )7.8 > 600 C50 )3.8 < 40
R16 )7.4 > 600 Y51 )5.7 < 3
S17 )1.2 > 600 D52 )0.1 –
Q18 )9.4 – T53 )7.5 –
T21 )2.4 < 3 H54 )2.1 < 600
C22 )4.8 < 40 K55 )8.8 –
R23 )2.7 < 3 F56 – –
C24 )
3.7 < 40 C57 )7.5 –
V25 )4.5 < 3 Y58 )12.7 > 600
D26 )1.7 > 600 K59 )7.5 –
V27 )8.7 – A60 )8.4 < 40
R28 )4.1 < 3 C61 )2.2 > 600
E29 )6.8 – H62 )7.4 –
S30 )2.4 < 40 N63 )7.2 > 600
C31 )8.5 – S64 )8.0 –
H32 )12.7 – E65 )3.1 –
S33 )11.4 > 600 I66 )7.4 < 40
A34 )5.0 – E67 )8.2 > 600
E. M. Ragg et al. Inhibitory properties and NMR structure of a lentil BBI
FEBS Journal 273 (2006) 4024–4039 ª 2006 The Authors Journal compilation ª 2006 FEBS 4029
interaction actually exists between Thr21 and Thr53
methyl groups and between Cys22 and the Thr53-
Lys55 segment. This latter segment is oriented perpen-
dicular to the average plane of the antitrypsin domain
and presents an extended but loose conformation, as
judged by the fast water exchange of His54-NH
(k
ex
< 600 · 10
)3
min
)1
), which, in an ideal b-sheet
structure should be hydrogen bonded with Cys22-CO.
The greater conformational mobility, with respect to
the antitrypsin b-hairpin, is substantiated by J
Na
coup-
ling values of 5.5 Hz, by the measured low chemical
shift indexes and by the calculated rmsd value, increas-
ing up to 0.8 A
˚
just at the level of His54 (Fig. 5B).
The antichymotrypsin domain adopts in a similar
way a b-hairpin structure, comprising a type-VIb
b-turn (Table 4) within the 37–51 segment (rmsd ¼
0.64 A
˚
) and lying on a plane almost perpendicular
to that of the antitrypsin domain. The hydrogen
bond pattern involves Tyr51-NH ⁄ Lys37-CO, Gln49-
NH ⁄ Val39-CO and Gln47-NH ⁄ Ala41-CO pairs
(Fig. 4). The extent of the b-hairpin is defined by
Gln47 and Tyr51, which, together with the amide pro-
tons located in the middle of the b-sheet structure,
exchange very slowly with solvent and display low
chemical shift temperature coefficients (Table 2). The
hydrogen bond partner of Gln47 is Ala41, with Dd ⁄ DT
and k
ex
values lower than the dyad related Thr15. In
contrast to His54 in the antitrypsin domain, Arg28-
NH forms a strong hydrogen bond with Cys48-CO
(k
ex
<3· 10
)3
min
)1
). The observed Arg28-NH ⁄
Cys48-CO interaction is supported also by long range
NOEs (Val27-H
a
⁄ Cys48-NH and Arg28-NH ⁄ Cys48-
NH). The chemical shift index for the 27–29 segment
indicates a propensity to adopt an extended structure
(Fig. 5A). The r.m.s.d values (Fig. 5B) are lower than
the dyad-related segment 53–55, as well as the k
ex
val-
ues and temperature coefficients of the amide protons,
suggesting a closer interaction with the antichymotryp-
tic domain for the 27–29 segment. The J
Na
values
measured for the Val27-Arg28-Glu29 segment
(5.72 Hz, 5.68 Hz, and 3.12 Hz, respectively) indicate,
however, that a certain degree of local conformational
mobility is still retained up to Glu29, where the pep-
tide backbone folds into a sharp turn.
Relevant hydrogen bonds were found between
Asp10-NH ⁄ Asp26-COOH and Asp36-NH ⁄ Asp52-
COOH residue pairs (Fig. 8). The same hydrogen
bonds are found in PSTI-IVb [31]. Both Asp10 and
Asp36, related by the pseudo-dyad axis, have their
amide protons unusually low-field shifted and, as
judged by their very fast solvent exchange rates, are
solvent exposed. This feature is relative to positions 10
and 36 only and is common to the other BBIs, whose
Table 3. Statistics for the 20 best structures derived from the
restrained MD calculations. rmsd, root mean square deviation.
Conformational energy parameters E (kcalÆmol
)1
)
Bonds 41 ± 5
Dihedrals 356 ± 13
Impropers 15 ± 3
Angles 201 ± 21
Van der Waals )184 ± 12
Electrostatic )225 ± 32
Total Energy 204 ± 53
Deviations from average
‘‘topallhdg’’ structures
(rmsd)
bb
(6–61) 0.90 A
˚
(rmsd)
heavy
(6–61) 1.63 A
˚
‘‘Charmm22’’ structures
(rmsd)
bb
(6–61) 1.08 A
˚
(rmsd)
heavy
(6–61) 1.88 A
˚
(rmsd)
bb
(11–25) 0.62 A
˚
(rmsd)
bb
(37–51) 0.64 A
˚
Ramachandran plot statistics
Amino acids in most favoured region 64.1%
Amino acids in allowed region 31.6%
Amino acids in generously allowed region 4.3%
Amino acids in disallowed region 0%
Number of restraints
d
i,i
NOESY intensities 1099
d
i,i+1
NOESY intensities 654
d
i,i+2
NOESY intensities 49
d
i,i+n
NOESY intensities 266
Distance restraints 632
H-bond restraints 8
Coupling constants (
3
J
Na
)29
Restraint deviations
Distances
d
ij
> 0.9 A
˚
0
d
ij
> 0.5 A
˚
29
H-bond
d
ij
> 0.3 A
˚
0
d
ij
> 0.1 A
˚
3
Coupling constants
J
aN
> 0.10 Hz 10
J
aN
> 0.14 Hz 0
Restraint deviations (rmsd)
Distance restraints 0.21 ± 0.020 A
˚
H-bonds 0.024 ± 0.006 A
˚
J
aN
0.086 ± 0.011 Hz
R-factor 0.095 ± 0.002
Inhibitory properties and NMR structure of a lentil BBI E. M. Ragg et al.
4030 FEBS Journal 273 (2006) 4024–4039 ª 2006 The Authors Journal compilation ª 2006 FEBS
1
H-NMR spectra have been assigned, i.e. sBBI [32]
and MSTI [23]. However, Asp36 is not a highly con-
served residue, because in MSTI and sBBI a lysine is
present at that position, whereas PSTI-IVb has a leu-
cine. Despite this residue heterogeneity, a remarkable
similarity in the corresponding amide chemical shifts
exists; thus, the origin of the two unusual low-field
shifts should be localized in the hydrogen bonded part-
ners, the highly conserved Asp26 and Asp52 residing,
respectively, at the end of the antitrypsin and anti-
chymotrypsin b-hairpin domains. Asp26 side chain is
also involved in an additional ion pair (Fig. 8A) with
Arg28 (present in MSTI and sBBI but not in PSTI),
whose amide proton forms a strong hydrogen bond
with Cys48-CO on the antichymotryptic domain.
Indeed, the wealth of existing polar interactions pro-
vides high thermal stability and restricted conforma-
tional mobility for this protein region. The residue
dyad-related to Arg28 is His54, which should be
unable to form ion pairs with Asp52 and Asp36 at
neutral pH, and whose amide proton does not form,
as previously discussed, a strong hydrogen bond with
Cys22-CO in the antitrypsin domain. Another poten-
tial hydrogen bond acceptor of His54 side chain might
be Ala34-CO (Fig. 8B), but this interaction is not a
constant feature for all deposited structures, due to a
high mobility of the histidine side chain.
The final structure results in an asymmetric distribu-
tion of opposite charges, at pH values around neutral-
ity (Fig. 9). The electrostatic potential is unevenly
distributed on the protein surface, as a negative poten-
tial is calculated at the C-terminus, near the antichymo-
tryptic site, whereas the antitryptic domain is highly
positive due to a cluster of charged residues. This
might suggest a possible dimerization in solution at
neutral pH values, as described for other BBIs [33]. In
particular, the prerequisite indicated for BBI dimeriza-
tion, consisting in the unique interaction between
Arg ⁄ Lys at P1 of the first BBI subunit and Asp ⁄ Glu at
the carboxyl-terminus of the second subunit, is also
fulfilled by LCTI.
Discussion
This work reports the purification, primary structure
analysis, kinetic properties and solution structure of a
Fig. 6. Superimposition of the best 10 LCTI structures derived from restrained simulated annealing calculations. C
a
atoms only are dis-
played.
Table 4. Conformational parameters for the 15–21 and 21–47
regions of LCTI. Averaged /,w-values derived from the 20 NMR
structures in comparison with PSTI X-ray data. LCTI data from this
work. PSTI-IVb data taken from [31].
Residue
no.
LCTI
/ (°) w (°)
PSTI-IVb
/ (°) w (°)
15 )81.4 ± 5.8 149.3 ± 9.3 )75.3 164.7
16 )81.7 ± 0.1 115.1 ± 6.6 )84.0 )4.3
18.4 ± 9.2
17 )176.8 ± 0.1 )170.6 ± 9.2 )57.5 178.7
)63.2 ± 0.2
18 )155.9 ± 0.3 101.5 ± 5.9 )149.5 111.9
19 )67.9 ± 2.4 156.7 ± 6.5 )70.5 149.4
20 )71.6 ± 2.6 165.0 ± 15.1 )75.9 157.4
21 )151.5 ± 24.4 )168.1 ± 12.9 )115.6 131.5
41 )77.6 ± 32.6 142.5 ± 6.7 )95.7 150.0
42 )83.7 ± 0.3 22.5 ± 18.8 )87.4 58.7
43 )60.3 ± 0.5 )163.0 ± 14.8 )120.4 169.5
44 )143.1 ± 17.8 105.1 ± 6.4 )120.9 119.7
45 )68.7 ± 2.0 162.1 ± 8.0 )74.8 162.4
46
)68.6 ± 2.7 154.5 ± 5.7 )65.3 162.4
47 )123.7 ± 12.1 121.6 ± 33.7 )130.3 114.8
E. M. Ragg et al. Inhibitory properties and NMR structure of a lentil BBI
FEBS Journal 273 (2006) 4024–4039 ª 2006 The Authors Journal compilation ª 2006 FEBS 4031
trypsin ⁄ chymotrypsin Bowman–Birk inhibitor isolated
from lentil seeds. The polypeptide, consisting of 67
amino acid residues and having a molecular mass of
7448 Da, clearly belongs to the wide family of dicoty-
ledonous BBIs on the basis of its characteristic
primary structure with a conserved Cys consensus
pattern. The protein is coded by the Lens gene class
F1-R1, as depicted by Sonnante et al. [8]. As previ-
ously mentioned, lentil seeds contain various BBI iso-
forms which are the products of few genes; however,
only one specific form has been used for the kinetic
and structural analyses carried out in this work.
LCTI is one of the most potent natural Bowman–
Birk inhibitors [34,35], with measured inhibitory
parameters (K
d
) against trypsin and chymotrypsin,
respectively, equal to 0.54 nm and 7.25 nm. As with
many other BBIs, LCTI is cleaved specifically at the
P1-P1¢ bond by trypsin. The hydrolysed form is, how-
ever, characterized by a two orders of magnitude
weaker affinity for trypsin, leading to a K*
d
⁄ K
d
ratio
(termed K
hyd
) very far from unity, notably the refer-
ence value established for canonical BBIs [36,37].
Thus, the measured trypsin-inhibitory activity of LCTI
reflects a behaviour generally observed in synthetic
peptide mimics [34] and is rather unusual for a Bow-
man–Birk inhibitor isolated from a natural source. By
contrast, the kinetic and thermodynamic parameters,
derived for the antichymotryptic activity of LCTI,
Fig. 8. Electrostatic interactions and hydrogen bond networks determined in the solution structure of LCTI: Asp10-Asp26-Arg28 triad (A);
Asp36-Asp52 and His54-Ala34 residue pairs (B).
Fig. 7. Superimposition of the LCTI solution structure (PDB ID 2AIH, red) with PSTI-IVb (PDB ID 1PBI, green) and sBBI (PDB ID 1BBI, blue).
C
a
atoms only are displayed.
Inhibitory properties and NMR structure of a lentil BBI E. M. Ragg et al.
4032 FEBS Journal 273 (2006) 4024–4039 ª 2006 The Authors Journal compilation ª 2006 FEBS
reside within the framework of the established general
behaviour, as the determined K
hyd
value of 4.4 is fully
consistent with the predictions based upon the depend-
ence of such a parameter on pH [38].
For some inhibitors, complex formation is a two-
step process [39], involving the rapid formation of a
loose complex, which slowly evolves into a more
tightly bound one. The slow formation of a more sta-
ble complex would, however, lead to an apparent
increase in inhibitory activity. This is the opposite of
what we actually observed. The experimental design of
the inhibitory activity assays for this class of inhibitors
is thus particularly important [40], within the context
of structure–activity relationship studies, as the marked
loss of inhibitory activity due to fast hydrolysis might
lead to the determination of apparent lower affinities,
if not properly measured. This observation might
explain the measured K
d
value of 7.9 nm for a previ-
ously identified BBI from Lens culinaris (LCI-1.7) [41],
a value likely to correspond to an LCTI ⁄ LCTI* mix-
ture. In our case, the initial presence of LCTI* was
taken into account in the numerical analysis of the
inhibitory assay experiments (see below).
The K
hyd
value is directly related to the difference in
free-energy between the virgin and modified inhibitors
in solution. This might be due either to a higher free-
energy content of virgin LCTI, corresponding to a
conformational strain within the inhibitory loop, or to
a particularly low level in free-energy of its modified
form. As will be discussed later, we did not find evi-
dence for any notable deviation of the inhibitory
domain geometry, or of the overall LCTI structure, in
comparison to other available structures of BBIs,
which could account for a particular conformational
energy strain. The gain in free-energy originates from
a significant difference in the k
on
and k*
on
parameters
(1.1 · 10
6
m
)1
Æs
)1
vs. 0.002 · 10
6
m
)1
Æs
)1
), as the cor-
responding k
off
and k*
off
values are very similar. It is
worth mentioning that the measured rate constants are
consistent to those found previously [40] for soybean
trypsin inhibitor, with the only exception being k*
on
.
The solution structure of LCTI is equivalent to the
other reported BBIs [31,32]. The overall molecular
structure consists of two repetitive antipodal double-
strand b-sheets, each enclosing a type-VIb loop and
bearing two distinct inhibitory sites. The presence of a
pseudo-dyad axis is also reflected by the very similar
patterns of the C.S.I. values measured for the two
inhibitory domains, at the level of the 11–25 and
37–51 segments. Relevant local differences in the
amino acid sequence do not seem to significantly alter
the global structure, due to the strong cross-linking
role of the disulphide bonds. The generally conserved
tertiary structure and hydrogen bond network give rea-
son to the observed high thermal stability over a wide
range of pH values and makes the inhibitor suitable
for optimal binding with trypsin. Other residues, not
directly involved in the trypsin surface and catalytic
Fig. 9. Particle mesh Ewald electrostatic potential calculated for LCTI at pH 6. Isopotential curves are displayed at )60 kTÆe
)1
(red) and at
+60 kTÆe
)1
units (blue).
E. M. Ragg et al. Inhibitory properties and NMR structure of a lentil BBI
FEBS Journal 273 (2006) 4024–4039 ª 2006 The Authors Journal compilation ª 2006 FEBS 4033
pocket recognition, should therefore be responsible for
the high K
hyd
value. A few amino acids, localized in
the nonconserved regions of BBI trypsin inhibitory
domain, are peculiar to LCTI and to all other proteins
belonging to the same gene class [8] and might be con-
nected to this unusual feature. In synthetic trypsin
inhibitor peptides [42,43], the nature of the residue at
position P2¢ has been noted to modulate the rate of
hydrolysis. In particular, an increase in the hydrophilic
character, such as in a Ile-Gln substitution, would
favour peptide hydrolysis. Indeed, as pointed out by
Sonnante et al. [8], LCTI has Gln18 at position P2¢.
This substitution does not seem, however, to be detri-
mental to the association with trypsin, because a K
d
value actually falling into the nanomolar range has
been measured, in contrast to the finding of short pep-
tides [43]. The sequence ‘TRSQ’, corresponding to the
P2-P2¢ region of LCTI, is quite uncommon within the
Bowman–Birk family, it only being present only in
Lens culinaris [8], in the highly homologous Vicia
angustifolia inhibitor and in one isoform of sBBI [44].
The measured lower value of k*
on
compared to k
on
might be related to an increase in conformational
mobility, rendering the hydrolysed form less suitable
to rapidly interact with trypsin and leading to ineffi-
cient resynthesis of the peptide bond. In Bowman–Birk
inhibitors, the native b-hairpin conformation is expec-
ted to be stabilized by a hydrogen bond network invol-
ving the side chains of residues P2, P1¢ and P5¢, which
help to maintain the optimal conformation also in the
hydrolysed form [44]. The importance of Ser, a highly
conserved residue at P1¢ position, has however, been
questioned [45]. The synthetic 11-residue cyclic peptide,
corresponding to the core reactive site loops of both
Bowman–Birk inhibitor and sunflower trypsin inhib-
itor (SFTI) proteins, represents at the moment, the
shortest peptide with a canonical scaffold, endowed
with high inhibitory activity [46]. Addition of other
residues at the N- and C-terminus, however, helps in
increasing proteolytic stability, proving the critical role
of distant amino acids in fixing the conformation of
the hydrolysed form [42].
A certain degree of dynamics in the BBI structure has
been reported to be retained upon complex formation
[47]. The effect of single amino acid replacement on the
hydrolytic stability was studied in detail for the ovomu-
coid third domain at pH 6 [38]. In that case, a small
effect of P37¢ substitution was observed and explained
in terms of entropic effects, due to interactions of such
residue with the amino acid at position P2¢. The crystal
structure of the unbound form of the tomato inhibitor-
II (TI-II) also revealed a significant conformational
flexibility in the reactive site loop [48]. Here, two pairs
of /,w torsional angles were measured at the level of the
scissile bond (P1: ) 80°,0° and )60°,120°;P1¢: )60°,150°
and )160°,166°), values very similar to what was meas-
ured in LCTI (Table 2). In the case of Cucurbita maxima
trypsin inhibitor CMTI-V, the decrease in the inhibitory
activity upon hydrolysis with trypsin and the human
blood coagulation factor XII was studied in detail. It
was concluded that hydrolysis did not involve a major
variation in secondary structure, but was rather
favoured by an increase in entropy due to greater con-
formational mobility of the binding loop first fragment
[49]. Residues at positions P6¢ and P8¢ would partic-
ularly contribute to the proteolytic stability. This should
apply also to LCTI. To this respect, another region
important for defining the conformational properties of
LCTI* is the 53–55 segment, found to only interact
weakly with the antitrypsin domain because of a greater
intrinsic mobility. Within this segment, a low-field shift
for the amide proton resonances is actually observed
upon hydrolysis, suggesting a closer interaction with the
P6¢-P8¢ segment in the antitrypsin b-sheet domain. Thus,
the amino acid at position P37¢ (His54 in LCTI) plays a
pivotal role, where a rather bulky and mobile side chain
would render difficult a close packing of neighbour seg-
ments in the native form. Besides, His54 is located in a
region with the highest positive electrostatic potential,
generated by neighbour charged residues. This might
reflect into a higher mobility around the P1-P1¢ bond.
Actually, Thr15 has an increased solvent accessibility,
with respect to the dyad-related Ala41.
In conclusion, the unusual propensity of LCTI
towards hydrolysis, observed also by NMR and MS
spectrometry at acidic pH in the absence of trypsin,
might be the result of a concomitant series of factors.
They include the nature of the amino acid at position
P2¢ (Gln instead of Ile) and an increased conforma-
tional mobility of the segment 53–55, whose major role
is to anchor the antitrypsin b-hairpin domain into its
native conformation by means of an extensive hydro-
gen bond ⁄ ion pair network. Given the suggested defen-
sive role of BBIs in leguminous seeds against insects,
this inherent conformational mobility might provide a
mechanism by which the inhibitor can balance the
need for tight binding with the need for broad inhibi-
tory function [48].
Experimental procedures
Extraction and purification of BBI from Lens
culinaris seeds
Dehulled lentil seeds (Lens culinaris, L., var. Macrosperma)
of commercial origin (600 g) were ground to a meal. The
Inhibitory properties and NMR structure of a lentil BBI E. M. Ragg et al.
4034 FEBS Journal 273 (2006) 4024–4039 ª 2006 The Authors Journal compilation ª 2006 FEBS
resulting flour was sieved through a 60 mesh metal sieve
and suspended (1 ⁄ 10, w ⁄ v) in 100 mm sodium acetate buf-
fer, pH 4.5, for 2 h at 4 °C under mild stirring. The suspen-
sion was then sonicated (15 microns of amplitude) on ice,
five times for 30 s every 15 s, using a Soniprep150 MSE
apparatus (Fison, Crawley, UK) and centrifuged at
10 000 g at 4 °C for 20 min (J2-21M/E, Beckmann Instru-
ment, Palo Alto, CA, USA).
The proteins contained in the supernatant were precipita-
ted with ammonium sulphate (70% saturation) and centri-
fuged as described above. The pellet was dissolved with
distilled water and dialysed at 4 °C against Milli-Q water
overnight. The solution was heated in a water bath at 80 ° C
for 10 min, cooled on ice and centrifuged as already des-
cribed. The clear supernatant was brought to pH 3.0 with
0.2 m HCl in drops and then to pH 4.5 with 100 mm
Tris ⁄ HCl buffer, pH 8.0. After centrifugation, the buffer of
the supernatant was exchanged to 50 mm sodium acetate
buffer, pH 4.5, by using an ultrafiltration apparatus (cut-off
3000 Da; Amicon, Bedford, MA, USA) and the crude
extract was kept frozen at )20 °C until use. About 20 mL
of crude extract were loaded to a DEAE-cellulose column
(2.2 · 130 cm, Whatman, Maidstone, UK) equilibrated
with 50 mm Tris ⁄ HCl buffer, pH 8.0. The elution of the
retained proteins was carried out stepwise with the same
buffer containing 0.2, 0.4 and 0.5 m NaCl. The fraction
eluted with 0.2 m NaCl displayed the highest trypsin and
chymotrypsin inhibitory activity. The unretained fraction,
which also displayed inhibitory activity, was neglected in
this study. After desalting by gel filtration, the active
fraction was loaded onto an HPLC MonoQ column
(0.5 · 5 cm, Amersham Biosciences, Milano, Italy) equili-
brated with 50 mm Tris ⁄ HCl buffer, pH 8.0. The retained
proteins were eluted with linear gradient from 0 to 0.3 m
NaCl in 30 min. Of the seven fractions obtained, only the
third, eluted with the buffer containing 0.15 m NaCl
showed inhibitory activity. This latter fraction was submit-
ted to a trypsin-agarose affinity chromatography (TAC,
Sigma-Aldrich, Milano, Italy). The column (1 · 2.5 cm)
was equilibrated with 20 mm Tris ⁄ HCl buffer, pH 7.2 and
the bound proteins were eluted by using a 3 mm HCl solu-
tion. Final yield was 30 mg of purified protein. The homo-
genous protein is referred to as Lens culinaris trypsin
inhibitor.
Mass spectrometry and amino acid sequencing
Matrix-assisted laser desorption ionization ⁄ time of flight
(MALDI-TOF) mass spectrometric analyses were performed
by using a Bruker Daltonics Reflex IV instrument (Bruker
Daltonics, Bremen, Germany) equipped with a nitrogen laser
(337 nm) and operated in linear mode with a matrix of
sinapinic acid in 0.1% trifluoroacetic acid ⁄ CH
3
CN, 2 : 1.
External standards, ranging from 5 to 16 kDa (Bruker pro-
tein calibration standard) were used for calibration.
Amino acid sequence analyses were performed using a
pulse liquid sequencer (Procise 491, Applied Biosystems,
Foster City, CA, USA) following reduction and carbami-
domethylation of the protein. LCTI (0.2 mg) was dissolved
in 8 m urea, 50 mm dithiothreitol, 100 mm Tris ⁄ HCl,
pH 8.6. The mixture was deoxygenated under vacuum and
incubated overnight at 37 °C. The reduced peptide was
treated with iodoacetamide (0.1 mL of a 0.625 m solution
in 100 mm Tris ⁄ HCl, pH 8.6) in the dark for 45 min. The
carbamidomethylated LCTI was purified from the reaction
mixture on a HPLC mod 510, equipped with a detector
2487 and SymmetryÒ C18 column (Waters, Milano, Italy).
The two buffer system consisted of 0.1% trifluoroacetic
acid in Milli-Q water (buffer A) and the same buffer con-
taining 80% acetonitrile (buffer B). After elution with buf-
fer A for 5 min at a flow rate of 0.8 mLÆmin
)1
, a gradient
to 75% of buffer B in 75 min was applied. An aliquot of
the material (200 pmol) was used to determine the N-ter-
minal sequence of the entire polypeptide, allowing the iden-
tification of the first 30 residues. The remaining part was
digested with sequence grade Lys-C at a molar [E] ⁄ [S] ratio
of 1 : 350 in 25 mm Tris ⁄ HCl buffer, 1 mm EDTA, pH 8.5
at 37 °C for 18 h. The peptides were separated on a Sym-
metryÒ C18 column under the same conditions described
above. The recovered peptides were vacuum-dried and sub-
mitted to amino acid sequencing. Alignment of the peptides
was based on the N-terminal sequences of the entire
protein, of a fragment obtained following incubation with
trypsin (as detailed below) and of homologous BBIs
(Fig. 2).
Antitryptic and antichymotryptic inhibition
assays
Trypsin (TPCK-treated from bovine pancreas), a-chymo-
trypsin (TLCK-treated from bovine pancreas), BApNA and
GPpNA were purchased from Sigma-Aldrich. Solutions of
BApNA and GPpNA were freshly prepared by dissolving
suitable amounts of the chromogenic substrate in double-
distilled water, 150 mm Tris ⁄ HCl, 1 mm CaCl
2
, pH 8.2.
Concentrations were checked by absorbance measurements
on an aliquot of substrate solution after complete enzyme-
catalysed hydrolysis (p-nitroaniline: k ¼ 410 nm, e ¼ 8800
m
)1
Æcm
)1
). The reaction solutions contained BApNA and
GPpNA at concentrations between 100 lm and 300 lm in
75 mm Tris ⁄ HCl, 5 mm CaCl
2
, pH 8.2. Enzymes and LCTI
were dissolved in the same buffer, at concentrations varying
between 0.05 lm and 0.5 lm and between 0.01 lm and
0.5 lm for enzymes and inhibitor, respectively. Inhibitor
concentrations were checked by UV absorbance at 280 nm
using a molar extinction coefficient value calculated on the
basis of the amino acid sequence (e ¼ 4680 m
)1
Æcm
)1
). In
the antitrypsin and antichymotrypsin activity assays, hydro-
lysis of the chromogenic substrates was continuously monit-
ored at 410 nm, sampling the absorbance every 15 s for a
E. M. Ragg et al. Inhibitory properties and NMR structure of a lentil BBI
FEBS Journal 273 (2006) 4024–4039 ª 2006 The Authors Journal compilation ª 2006 FEBS 4035
40 min time span, a few seconds after reagent mixing. The
UV-visible spectrophotometer was a PerkinElmer Lambda-
25 (Milano, Italy), equipped with a thermostatted cell.
Temperature was set at 37 °C.
In order to ascertain the exact point of trypsin-catalysed
cleavage, LCTI (0.6 mg) was incubated for 0–6 h with
2.2 mL of trypsin 0.5 lm at 37 °C (100 mm Tris ⁄ HCl,
10 mm CaCl
2
, pH 8.2). Aliquots containing 0.15 mg of
LCTI-LCTI* mixture were dialysed (cut-off 3500 Da) and,
after lyophylization, reduced and carbamidomethylated. The
fragments were separated on SymmetryÒ C18 column.
Under these conditions, only peaks corresponding to the
intact protein and fragments derived from cleavage at P1-P1¢
were detected, as proved by amino acid sequence analysis.
Numerical analysis of the inhibitory activity
The absorbance data sampled during the tryptic and chym-
otryptic inhibition assays were converted into product con-
centrations and analysed using the scilab (v. 2.0) software
package (Copyright ª 1989–2005. INRIA ENPC, Paris
Cedex 05, France).
On the basis of the assumed kinetic model [25], a script
was devised in order to solve the following system of ordin-
ary differential equations by numerical methods:
d½P
dt
¼À
d½S
dt
¼
k
cat
K
M
½E½S
d½I
dt
¼ k
off
½CÀk
on
½E½I
d½C
dt
¼ k
on
½E½IÀðk
off
þk
Ã
off
Þ½Cþk
Ã
on
½E½I
Ã
d½I
Ã
dt
¼ k
Ã
off
½CÀk
Ã
on
ÂE ½I
Ã
8
>
>
>
>
>
>
>
>
>
>
<
>
>
>
>
>
>
>
>
>
>
:
ð1Þ
where [S], [P], [I] and [ I*] are the actual concentrations of
the substrate (BApNA or GPpNA), their hydrolysis prod-
ucts, and the inhibitor (respectively in the virgin and modi-
fied form); [C] is the concentration of the enzyme-inhibitor
(virgin or modified) complex; k
cat
and K
M
are the kinetic
and Michaelis–Menten constants relative to hydrolysis of
the chromogenic substrates. The first member of Eqn (1)
assumes steady-state conditions and is valid for
K
M
>> [S]. Fitting the experimental data in the absence
of inhibitor with the same script derived the k
cat
⁄ K
M
ratio,
as it was sufficient to set the initial LCTI concentration to
zero. Values for k
cat
were independently found equal to
135 min
)1
and to 3.85 min
)1
and K
M
values of 1250 lm
and 850 lm for BApNA and GPpNA, respectively, by
means of standard Lineweaver–Burk analysis of initial rate
kinetics. Fitting of the experimental data required as input
data the initial concentrations of BApNA, enzyme and
inhibitor, both in its virgin (I) and modified (I*) forms. The
initial amount of I* was estimated (10%) by
1
H-NMR and
RP-HPLC.
1
H-NMR spectroscopy
LCTI was dissolved in 0.6 mL D
2
O (99.9% isotopic purity,
ISOTEC, Miamisburg, OH, USA) or in H
2
O ⁄ D
2
O (90 : 10
v ⁄ v) mixture, at concentrations between 0.1 and 5 mm.No
buffer or salt was added. pH was adjusted to 3.1 (uncor-
rected pH values for deuterium effect), by addition of dilu-
ted HCl. Solutions were immediately transferred into 5 mm
O.D. NMR tubes (Wilmad, Buena, NJ, USA). NMR spec-
tra were performed at temperatures ranging between 5 °C
and 40 °C on an AMX-600 spectrometer (Bruker Spectro-
spin, Rheinstetten, Germany), equipped with a 5 mm
inverse probe and z-axis gradients. Spectra were referenced
on external DSS, set at 0 p.p.m.
Two-dimensional homonuclear correlation spectra
NOESY [50], COSY-dQF [51] and TOCSY [52] were
acquired using standard pulse sequences in phase-sensitive
mode. Typically, 800 · 2048 spectra were acquired using
time proportional phase increments [53] and transformed to
a final 2K · 2K real data matrix after apodization with a
90° and 60°-shifted sine-bell squared function in f2- and f1-
domain, respectively. Baseline correction was achieved by a
5th-degree polynomial function. TOCSY spectra were per-
formed at various temperatures with a spin-lock value set
at 0.045 s. Solvent suppression was achieved either by pre-
saturation and NOESY-type pulse sequences [50], or by
gradient-based pulse sequences [54] in the case of D
2
O and
H
2
O ⁄ D
2
O solutions, respectively.
For the quantitative evaluation of NOE interactions, a set
of three consecutive experiments with t
mix
¼ 0.08 s, 0.12 s
and 0.35 s was performed at 25 °C. Data processing was per-
formed using xwinnmr software (v. 2.6, Bruker Spectrospin)
on a Silicon Graphics (Mountain View, CA, USA) INDY
workstation. 2D-spectral analysis and cross-peak integration
were performed with sparky [55]. 2D-cross-peak intensities
were translated into NOE-distances by applying the two-spin
approximation d
ij
¼ d
ref
· (a
ij
⁄ a
ref
)
1 ⁄ 6
using as reference the
tyrosine proton pairs situated in ortho position (d
ref
¼
2.40 A
˚
) as well as geminal protons (d
ref
¼ 1.80 A
˚
). Distance
errors were set as )0.5 A
˚
and +1.0 A
˚
. The NOE-distances
were used only in the initial stages of the restrained simulated
annealing procedures. Final refinements were achieved by
directly using the NOESY cross-peaks intensities measured
at all mixing times and a complete relaxation matrix
approach (see below). The / angles torsional restraints were
calculated from measured
3
J
Na
coupling constant values.
The / angles were restrained to )139 ± 30° for J
Na
>7Hz
and to )60±30° for J
Na
< 5 Hz. Other / angles relative to
residues detected in b-sheet secondary structure elements
were restrained to )139 ± 30° in the early stages of struc-
tural refinement.
Chemical shift temperature coefficients for amide protons
were measured from TOCSY experiments performed
between 5 °C and 35 °C. Solvent exchange rates were classi-
fied according to the observed persistence of the amide NMR
Inhibitory properties and NMR structure of a lentil BBI E. M. Ragg et al.
4036 FEBS Journal 273 (2006) 4024–4039 ª 2006 The Authors Journal compilation ª 2006 FEBS
signal in D
2
O solution at 25 °C: very slow exchange:
k
ex
<3· 10
)3
min
)1
; slow exchange: 3 · 10
)3
< k
ex
<
40 · 10
)3
min
)1
; medium exchange: 40 · 10
)3
< k
ex
<
600 · 10
)3
min
)1
; fast exchange: k
ex
> 600 · 10
)3
min
)1
.
Solution structure calculation
An initial randomly folded polypeptide chain and its topol-
ogy file were generated by xplor [56]. Topologies and
charges were taken from the ‘topallhdg.pro’ file present in
the xplor library. Torsional parameters for Pro20 and
Pro46 were defined by setting the appropriate patch for cis-
prolines. At this stage, no disulphide bond was defined.
A simulated annealing (SA) protocol was then applied [57]
in order to create an initial set of 150 structures. During
simulation, the folding of the polypeptide chain was driven
by / torsional angle constraints and a reduced set of long-
range NOE distances, taken from the NOESY experiment
performed at t
mix
¼ 0.08 s. These structures were subjected
to a further SA, using all the NOE-derived interproton dis-
tances measured at t
mix
¼ 0.08 s and all / torsional angle
restraints. Other distance restraints included hydrogen bonds
for the slowly exchanging amide protons, residing in the
b-sheet regions and reported in Fig. 4. In order to introduce
proper directionality, for each observed hydrogen bond
a pair of distance restraints was actually defined, namely
d
(C) ¼ O,H(N)
¼ 2.0 A
˚
and d
(C) ¼ O,N(H)
¼ 3.0 A
˚
[23]. From
the initial set, the 55 best structures were extracted on the
basis of NOE-restraints violations and were subjected to a
second energy refinement step with the full relaxation matrix
approach [58], where the NOE-based distances were substi-
tuted with all NOE cross-peak volumes measured at three
mixing times. A correlation time optimum value of 7 ± 1 ns
was found by systematic search, assuming isotropic motions.
A further selection of the best 24 structures was made on the
basis of total energy. Finally, the ionization state for all io-
nisable side chains was defined for pH 3.1. Force-field was
switched to Charmm22 [59], 11 chloride atoms were added
and the protein was soaked with a solvation layer consisting
of 600 water molecules. In order to limit electrostatic interac-
tions, the charges of the N-terminus and of Lys, Arg and His
side chains were reduced to 0.2 units [60]. In order to achieve
convergence and quality for the final set of structures, all
structures were subjected to a final refinement with the full
relaxation matrix approach, consisting of several steps of
restrained Molecular Dynamics (MD) at low temperature
(20K)100K) followed by 300 steps of restrained energy-min-
imization. During this final stage of refinement, torsional
angle restraints were replaced by vicinal coupling constant
restraints. Chirality was checked during all SA steps with
whatif [61]. Final quality control was performed with pro-
check v. 3.4.4 [30]. Electrostatic potential calculations,
molecular graphics and rendering were made with the aid of
vmd v. 1.8 [62]. The best 20 structures, selected on the basis
of lowest total energy, NMR R-factors and Ramachandran
plot analysis, have been deposited in the Brookhaven Protein
Data Bank (PDB code: 2AIH), together with the restraints
used for the structure generation. Chemical shift values have
been deposited in Biological Magnetic Resonance Data
Bank (BMRB code: 7078). NMR R-factors were calculated
as R ¼ S[(I
c
i
)
1 ⁄ 6
) (I
i
°)
1 ⁄ 6
] ⁄S(I
i
°)
1 ⁄ 6
, where I
i
° and I
c
i
are the
normalized observed and calculated NOESY cross-peak
intensities, respectively [56]. Local rmsd values were calcula-
ted with data smoothing after superimposition of the depos-
ited structures with a five-residue window.
Acknowledgements
This work was supported by two grants from MIUR
(Project FIRST-2004).
References
1 Bowman DE (1944) Fractions derived from soybeans
and navy beans, which retard tryptic digestion of casein.
Proc Soc Exp Biol Medical 57, 139–140.
2 Birk Y, Gertler A & Khalef S (1963) A pure trypsin
inhibitor from Soya beans. Biochem J 87, 281–284.
3 Birk Y (1985) The Bowman-Birk inhibitor: trypsin and
chymotrypsin inhibitor from soybean. Int J Pept Prot
Res 25, 113–131.
4 Deshimaru M, Yoshimi S, Shioi S & Terada S (2004)
Multigene family for Bowman-Birk type proteinase inhi-
bitors of wild soya and soybean: the presence of two
BBI-A genes and pseudogenes. Biosci Biotech Biochem
68, 1279–1286.
5 Piergiovanni AR & Galasso I (2004) Polymorphism of
trypsin and chymotrypsin binding loops in Bowman-
Birk inhibitors from common bean (Phaseolus vulgaris
L.). Plant Sci 166, 1525–1531.
6 Mello MO, Tanaka AS & Silva Filho MC (2003) Mole-
cular evolution of Bowman-Birk type proteinase inhibi-
tors in flowering plants. Mol Phyl Evol 27, 103–112.
7 Prakash B, Selvaraj S, Murthy MR, Sreerama YN, Rao
DR & Gowda LR (1996) Analysis of the amino acid
sequences of plant Bowman-Birk inhibitors. J Mol Evol
42, 560–569.
8 Sonnante G, De Paolis A & Pignone D (2005) Bow-
man-Birk inhibitors in Lens: identification and charac-
terization of two paralogous gene classes in cultivated
lentil and wild relatives. Theor Appl Genet 110, 596–604.
9 Odani S & Ikenaka T (1973) Studies on soybean trypsin
inhibitors. 8. Disulfide bridges in soybean Bowman-Birk
inhibitors. J Biochem (Tokyo) 74, 697–715.
10 Mosolov VV & Valueva TA (2005) Proteinase inhibitors
and their function in plants: a review. Appl Biochem
Microbiol 41, 227–246.
11 McBride JD, Watson EM, Brauer ABE, Jaulent AM
& Leatherbarrow RJ (2002) Peptide Mimics of the
E. M. Ragg et al. Inhibitory properties and NMR structure of a lentil BBI
FEBS Journal 273 (2006) 4024–4039 ª 2006 The Authors Journal compilation ª 2006 FEBS 4037
Bowman-Birk Inhibitor Reactive Site Loop. Biopolymers
66, 79–92.
12 Qi RF, Song ZW & Chi CW (2005) Structural features
and molecular evolution of Bowman-Birk protease
inhibitors and their potential application. Acta Biochim
Biophys Sin 37, 283–292.
13 Kennedy AR (1998) Chemopreventive agents: protease
inhibitors. Pharmacol Ther 78, 167–209.
14 Armstrong WB, Kennedy AR, Wan XS, Taylor TH,
Nguyen QA, Jensen J, Thompson W, Lagerberg W &
Meyskens FL Jr (2000) Clinical modulation of oral leu-
koplakia and protease activity by Bowman-Birk inhibi-
tor concentrate in a phase IIa chemoprevention trial.
Clin Cancer Res 6, 4684–4691.
15 Kennedy AR (1998) The Bowman-Birk inhibitor from
soybeans as an anticarcinogenic agent. Am J Clin Nutr
68, 1406–1412.
16 Ware JH, Wan XS, Newberne P & Kennedy AR
(1999) Bowman-Birk inhibitor concentrate reduces
colon inflammation in mice with dextran sulfate
sodium-induced ulcerative colitis. Dig Dis Sci 44, 986–
990.
17 Ausich R, Defreitas Z, Sheabar F, Shao A & Newman
J (2003) Composition and method for reducing post-
prandial blood glucose. PCT Int App1 WO2003092603.
18 Rostami A & Kennedy AR (2004) Use of Bowman-
Birk Inhibitor for the treatment of multiple sclerosis
and other autoimmune diseases. US Patent application
US2004142050.
19 Sweeney HL, Morris CA & Kennedy AR (2005)
Bowman-Birk Inhibitor compositions for treatment of
muscular atrophy and degenerative muscle disease. PCT
Int App1 WO2005011596.
20 Clemente A, Gee JM, Johnson IT, MacKenzie DA &
Domoney C (2005) Pea (Pisum sativum L.) Protease
Inhibitors from the Bowman-Birk Class Influence the
Growth of Human Colorectal Adenocarcinoma HT29
Cells in Vitro. J Agric Food Chem 53, 8979–8986.
21 Clemente A & Domoney C (2006) Biological Significance
of Polymorphism in Legume Protease Inhibitors from the
Bowman-Birk Family. Curr Prot Pept Sci 7, 201–216.
22 Weder JKP & Hinkers SC (2004) Complete Amino Acid
Sequence of Lentil Trypsin-Chymotrypsin Inhibitor LCI-
1.7 and a Discussion of Atypical Binding Sites of Bow-
man-Birk Inhibitors. J Agric Food Chem 52, 4219–4226.
23 Catalano M, Ragona L, Molinari H, Tava A & Zetta L
(2003) Anticarcinogenic Bowman-Birk Inhibitor Isolated
from Snail Medic Seeds (Medicago scutellata): Solution
Structure and Analysis of Self Association Behavior.
Biochemistry 42, 2836–2846.
24 Schechter J & Berger A (1967) On the size of the active
sites of proteases. Biochem Biophys Res Commun 27,
157–162.
25 Laskowski M & Kato I (1980) Protein inhibitors of pro-
teinases. Annu Rev Biochem 49, 593–626.
26 Malykh EV & Larionova NI (2002) Study of Antipro-
teinase Activity of Acylated Derivatives of Bowman-
Birk Soybean Proteinase Inhibitor. Biochemistry
(Moscow) 67, 1383–1387.
27 Wu
¨
thrich K (1986) NMR of Proteins and Nucleic Acids.
Wyley-VCH, New York.
28 Schwarzinger S, Kroon GJA, Foss TR, Wright PE &
Dyson HJ (2000) Random coil chemical shifts in acidic
8M urea: Implementation of random coil shift data in
NMRView. J Biomol NMR 18, 43–48.
29 Wishart DS, Sykes BD & Richards FM (1991) Relation-
ship between nuclear magnetic resonance chemical shift
and protein secondary structure. J Mol Biol 222, 311–
333.
30 Laskowski RA, MacArthur W, Moss DS & Thornton JM
(1993) PROCHECK: a program to check the stereochemi-
cal quality of protein structures.
J Appl Cryst 26, 283–291.
31 Li de la Sierra I, Quillien L, Flecker P, Gueguen J &
Brunie S (1999) Dimeric crystal structure of a Bowman-
Birk protease inhibitor from pea seeds. J Mol Biol 285,
1195–1207.
32 Werner MH & Wemmer DE (1992) Three-Dimensional
Structure of Soybean Trypsin ⁄ Chymotrypsin Bowman-
Birk Inhibitor in Solution. Biochemistry 31, 999–1010.
33 Kumar P, Rao AG, Hariharaputran S, Chandra N &
Gowda LR (2004) Molecular mechanism of dimeriza-
tion of Bowman-Birk inhibitors. Pivotal role of Asp76
in the dimerisation. J Biol Chem 279, 30425–30432.
34 McBride JD & Leatherbarrow RJ (2001) Synthetic Pep-
tide Mimics of the Bowman-Birk Inhibitor Protein.
Curr Med Chem 8, 909–917.
35 Jensen B, Unger KK, Uebe J, Gey M, Kim YM &
Flecker P (1996) Proteolytic cleavage of soybean Bow-
man-Birk inhibitor monitored by means of high-perfor-
mance capillary electrophoresis. Implications for the
mechanism of proteinase inhibitors. J Biochem Biophys
Methods 33, 171–185.
36 Bode W & Huber R (1992) Natural protein proteinase
inhibitors and their interaction with proteinases. Eur J
Biochem 204, 433–451.
37 Laskowski M & Qasim MA (2000) What can the struc-
tures of enzyme-inhibitor complexes tell us about the
structures of enzyme substrate complexes? Biochim
Biophys Acta 1477, 324–337.
38 Ardelt W & Laskowski M (1991) Effect of single amino
acid replacement on the thermodynamics of the reactive
site peptide bond hydrolysis in ovomucoid third
domain. J Mol Biol 220, 1041–1053.
39 Larinova NI, Gladysheva IP & Gladyshev DP (1997)
Human leukocyte elastase inhibition by Bowman-Birk
soybean inhibitor. Discrimination of the inhibition
mechanisms. FEBS Lett 404, 245–248.
40 Zhou JM, Liu C & Tsou CL (1989) Kinetics of trypsin
inhibition by its specific inhibitors. Biochemistry 28,
1070–1076.
Inhibitory properties and NMR structure of a lentil BBI E. M. Ragg et al.
4038 FEBS Journal 273 (2006) 4024–4039 ª 2006 The Authors Journal compilation ª 2006 FEBS
41 Weder JK & Kahleyss R (2003) Reaction of lentil tryp-
sin-chymotrypsin inhibitors with human and bovine
proteinases. J Agric Food Chem 51, 8045–8050.
42 Gariani T & Leatherbarrow RJ (1997) Stability of pro-
tease inhibitors based on the Bowman-Birk reactive site
loop to hydrolysis by proteases. J Pept Res 49, 467–475.
43 Gariani T, McBride JD & Leatherbarrow RJ (1999)
The role of P2¢ position of Bowman-Birk proteinase
inhibitor in the inhibition of trypsin. Studies on P2¢
variation in cyclic peptides encompassing the reactive
site loop. Biochim Biophys Acta 1431, 232–237.
44 McBride JD, Brauer AB, Nievo M & Leatherbarrow RJ
(1998) The role of threonine in the P
2
position of Bow-
man-Birk proteinase inhibitors: studies on P
2
variation
in cyclic peptides encompassing the reactive site loop.
J Mol Biol 282 , 447–458.
45 Brauer AB & Leatherbarrow RJ (2003) The conserved
P1¢-Ser of Bowman-Birk-type proteinase inhibitors is
not essential for the integrity of the reactive site loop.
Biochem Biophys Res Commun 308, 300–305.
46 Brauer AB, Kelly G, McBride JD, Cooke RM, Mat-
thews SJ & Leatherbarrow RJ (2001) The Bowman-Birk
Inhibitor reactive site loop sequence represents an inde-
pendent structural b-hairpin motif. J Mol Biol 306, 799–
807.
47 Park EY, Kim J-A, Kim H-W, Kim YS & Song HK
(2004) Crystal Structure of the Bowman-Birk Inhibitor
from Barley Seeds in Ternary Complex with Porcine
Typsin. J Mol Biol 343, 173–186.
48 Barrette-Ng IH, Ng KKS, Cherney MM, Pearce G,
Ghani U, Ryan CA & James MN (2003) Unbound
Form of Tomato Inhibitor-II Reveals Interdomain Flex-
ibility and Conformational Variability in the Reactive
Site Loops. J Biol Chem 278, 31391–31400.
49 Cai M, Gong YX, Prakash O & Krishnamoorthi R
(1995) Reactive-Site Hydrolyzed Cucurbita maxima
Trypsin Inhibitor-V: Function, Thermodynamic Stabi-
lity, and NMR Solution Structure. Biochemistry 34,
12087–12094.
50 Jeener J, Meier BH, Bachmann P & Ernst RR (1979)
Investigation of exchange processes by two-dimensional
NMR spectroscopy. J Chem Phys 71, 4546–4553.
51 Rance M, Sørensen OW, Bodenhausen G, Wagner G,
Ernst RR & Wu
¨
thrich K (1983) Improved spectral reso-
lution in COSY
1
H NMR spectra of proteins via double
quantum filtering. Biochem Biophys Res Commun 117,
479–485.
52 Braunschweiler L & Ernst RR (1983) Coherence trans-
fer by isotropic mixing: application to proton correla-
tion spectroscopy. J Magn Reson 53, 521–528.
53 Redfield AG & Kunz SD (1975) Quadrature Fourier
NMR detection: simple multiplex for dual detection and
discussion. J Magn Reson 19, 250–254.
54 Sklenar V, Piotto M, Leppik R & Saudek V (1993)
Gradient-tailored water suppression for
1
H-
15
N HSQC
experiments optimized to retain full sensitivity. J Magn
Reson 102, 241–245.
55 Goddard TD & Kneller DG (2004) SPARKY 3. Univer-
sity of California, San Francisco, USA.
56 Brunger AT (1992) X-PLOR, Version 3.1. A System for
X-ray crystallography and NMR. Yale University Press,
New Haven, CT, USA.
57 Nilges M, Clore GM & Gronenborn AM (1988) Deter-
mination of three-dimensional structure of proteins
from interproton distance data by dynamical simulated
annealing from a random array of atoms. FEBS Lett
239, 129–136.
58 Yip P & Case DA (1989) A New Method for Refine-
ment of Macromolecular Structures based on Nuclear
Overhauser Effect Spectra. J Magn Reson 83, 643–
648.
59 Brooks BR, Bruccolleri RE, Olafson BD, States DJ,
Swaminathan S & Karplus M (1983) CHARMM: a pro-
gram for macromolecular energy minimisation, and
dynamics calculation. J Comput Chem 4, 187–217.
60 Schneider TR, Brunger AT & Nilges M (1999) Influence
of internal dynamics on accuracy of protein NMR
structures: derivation of realistic model distance data
from a long molecular dynamics trajectory. J Mol Biol
285, 727–740.
61 Vriend G (1990) WHAT IF: a molecular modeling and
drug design program. J Mol Graph 8, 526–529.
62 Humphrey W, Dalke A & Schulten K (1996) VMD –
Visual Molecular Dynamics. J Mol Graph 14, 33–38.
Supplementary material
The following material is available for this article
online:
Fig. S1. Plot of chymotrypsin-catalysed hydrolysis of
GPpNA.
Fig. S2. Plot of the TOCSY spectrum of LCTI (finger-
print region) with sequential assignments.
Fig. S3. Expansion of a NOESY spectrum for LCTI,
high-field region.
Fig. S4. Expansion of a mass spectrum of LCTI dis-
solved in water, pH 3.1, 25 ° C, after 10 days.
Fig. S5. Determination of the aggregation state of
LCTI by size exclusion chromatography.
Fig. S6. Determination of the aggregation state of
LCTI by DOSY.
Fig. S7. Ramachandran plot and statistics of the 20
deposited structures.
Fig. S8. Ensemble Ramachandran Plot for the 20
deposited structures.
Table S1. Experimental vicinal coupling constants and
calculated values for the most representative structure.
This material is available as part of the online article
from
E. M. Ragg et al. Inhibitory properties and NMR structure of a lentil BBI
FEBS Journal 273 (2006) 4024–4039 ª 2006 The Authors Journal compilation ª 2006 FEBS 4039