Taxation and Public Finance in Transition and Developing Economies docx
Bạn đang xem bản rút gọn của tài liệu. Xem và tải ngay bản đầy đủ của tài liệu tại đây (5.4 MB, 670 trang )
Taxation and Public Finance in Transition
and Developing Economies
Robert W. McGee
Taxation and Public Finance
in Transition and Developing
Economies
Edited by
Florida International University
North Miami, FL 33181
USA
DOI: 10.1007/978-0-387-25712-9
Library of Congress Control Number: 2007940378
© 2008 Springer Science+Business Media, LLC
All rights reserved. This work may not be translated or copied in whole or in part without the written
permission of the publisher (Springer Science+Business Media, Inc., 233 Spring Street, New York, NY
10013, USA), except for brief excerpts in connection with reviews or scholarly analysis. Use in connection
with any form of information storage and retrieval, electronic adaptation, computer software, or by similar
or dissimilar methodology now known or hereafter developed is forbidden.
not identified as such, is not to be taken as an expression of opinion as to whether or not they are subject to
proprietary rights.
Printed on acid-free paper
9 8 7 6 5 4 3 2 1
springer.com
ISBN: 978-0-387-25711-2 e-ISBN: 978-0-387-25712-9
Editor
Robert W. McGee
The use in this publication of trade names, trademarks, service marks and similar terms, even if they are
Preface
Much has been written about the economic and political problems of
countries that are in the process of changing from centrally planned systems
to market systems. Most studies have focused on the economic, legal,
political and sociological problems these economies have had to face during
the transition period. However, not much has been written about the dramatic
changes that have to be made to the accounting and financial system of a
transition economy. This book was written to help fill that gap.
Taxation and Public Finance in Transition and Developing
Economies is the third in a series to examine accounting and financial system
reform in transition economies. The first book used Russia as a case study.
The second volume in the series examined some additional aspects of the
reform in Russia and also looked at the accounting and financial system
reform efforts that are being made in Ukraine, Bosnia & Herzegovina,
Armenia, Eastern Europe and Central Asia.
The present volume examines taxation and public finance in
transition and developing economies. It is divided into three parts. Part I
consists of four general studies on various aspects of tax compliance,
corruption, budget efficiency and fiscal policy. Part II includes nine
comparative studies of various aspects of public finance. Part III consists of
23 country and regional studies of countries in Europe, Asia, Latin America
and Africa.
Florida International University Robert W. McGee
v
Table of Contents
Preface
PART ONE: GENERAL STUDIES
1 Bureaucracy, Corruption and Tax Compliance 3
Ahmed Riahi-Belkaoui
2 Enlarging the European Union: Taxation and
Corruption in the New Member States
11
M. Peter van der Hoek
3 No Taxation with or without Representation:
Completing the Revolutionary Break with Feudalist
Practices
25
Tibor R. Machan
4 Enhancing Efficiency of Government Budget and
Fiscal Policy
39
Robert W. McGee and Yeomin Yoon
PART TWO: COMPARATIVE STUDIES
5 A Comparative Study of Indirect Taxes in Transition
Economies and the European Union
57
Robert W. McGee
6 Tax Administration Costs in Transition Economies
and the OECD: A Comparative Study
67
Robert W. McGee
7 A Comparative Study of Tax Misery and Tax
Happiness in Transition Economies and the European
Union
81
Robert W. McGee
vii
v
8 Fiscal Freedom in Transition Economies and the
OECD: A Comparative Study
93
Robert W. McGee
9 Trends in the Ethics of Tax Evasion: An Empirical
Study of Ten Transition Economies
119
Robert W. McGee
10 Tax Evasion, Tax Misery and Ethics: Comparative
Studies of Korea, Japan and China
137
Robert W. McGee
11 The Ethics of Tax Evasion: A Comparative Study of
Bosnian and Romanian Opinion
167
Robert W. McGee, Meliha Basic, and Michael Tyler
12 Tax Evasion and Ethics: A Comparative Study of the
USA and Four Latin American Countries
185
Robert W. McGee and Silvia López Paláu
13 Tax Competition: Can Slovenia Learn Anything from
Ireland?
225
Sheila Killian, Mitja Čok, and Aljoša Valentinčič
PART THREE: COUNTRY & REGIONAL STUDIES
14 A Survey of Argentina on the Ethics of Tax Evasion 239
Robert W. McGee and Marcelo J. Rossi
15 Taxation in the Republic of Armenia: An Overview
and Discussion from the Perspectives of Law,
Economics and Ethics
263
Robert W. McGee
16 Opinions on Tax Evasion in Armenia 277
Robert W. McGee and Tatyana B. Maranjyan
17 Opinions on Tax Evasion in Asia 309
Robert W. McGee
Table of C ontents viii
18 Monitoring of Tax Corruption in Transition
Economies: Evidence from Bulgaria
321
Konstantin V. Pashev
19 Tax Compliance of Small Business in Transition
Economies: Lessons from Bulgaria
363
Konstantin V. Pashev
20 Tax System Change: The Bulgarian Experience 389
Georgi Smatrakalev
21 A Survey of Chinese Business and Economics Students
on the Ethics of Tax Evasion
409
Robert W. McGee and Yuhua An
22 Tax Reform Needs in China and the United States:
Perhaps a Chance to Learn from Each Other
423
Robert Sarikas, Liu Xiaobing, Yin Zi and Arsen Djatej
23 The Croatian Tax System: From Consumption-Based 433
Helena Blažić
24 The Ethics of Tax Evasion: A Survey of Estonian
Opinion
461
Robert W. McGee, Jaan Alver, and Lehte Alver
25 The Ethics of Tax Evasion: A Survey of Guatemalan
Opinion
481
Robert W. McGee and Christopher Lingle
26 A Study of Tax Evasion Ethics in Kazakhstan 497
Robert W. McGee and Galina G. Preobragenskaya
27 Attitudes Toward Tax Evasion in Mali 511
Robert W. McGee and Bouchra M’Zali
28 Pension Reform in Romania: How Far Should It Go? 519
Oana Diaconu
29 Tax Reforms in Russia: The Introduction of the
Unified Social Tax
533
Andrei Kuznetsov and Lubov Goncharenko
Table of Contents ix
to Income-Based
30 Taxation, Transition and the State: The Case of Russia 547
Gerard Turley
31 The Ethics of Tax Evasion: A Survey of Slovak
Opinion
575
Robert W. McGee and Radoslav Tusan
32 Taxation and Public Finance in the Slovak Republic 603
Vincent Šoltés and Emília Jakubíková
33 Opinions on Tax Evasion in Thailand 609
Robert W. McGee
34 VAT in Ukraine: An Interim Report 621
Richard M. Bird
35 The Ethics of Tax Evasion: An Empirical Study of
Business and Economics Student Opinion in Ukraine
639
Irina Nasadyuk and Robert W. McGee
36 A Survey of Vietnamese Opinion on the Ethics of Tax
Evasion
663
Robert W. McGee
Index 675
x Table of C ontents
PART ONE: GENERAL STUDIES
1
Bureaucracy, Corruption and Tax Compliance
Ahmed Riahi-Belkaoui
∗
Introduction
Why do individuals resist tax compliance with their tax commitments and
why does this situation differ internationally? The question has been
extensively researched from the theoretical perspectives of general deterrence
theory, economic deterrence models and fiscal psychology (Cuccia 1994).
This study takes the view that the actions of governments can best explain
the phenomenon of tax compliance internationally. It shows that where
governments reduce bureaucracy and increase the control of corruption, tax
compliance will be at its highest. It argues for an implicit social contract
where the government and/or the state create a tax environment unburdened
by the inefficiencies of bureaucracy, and corruption for tax compliance to be
effective. This is especially crucial for developing countries where economic
development can be drastically hampered by lower public revenues from lack
of tax compliance.
The second section of the paper describes the relationship of
data. The fourth section presents the regression analysis and discussions, and
the fifth section concludes.
Bureaucracy, Corruption and Tax Compliance
Tax compliance has been extensively reviewed (e.g. Andreoni et al. 1998;
Jackson and Milliron 1986; Kinsey 1986; Long and Swingen 1991; Cuccia
1994). Three theoretical perspectives are used to explain the degree of tax
compliance, namely general deterrence theory, economic deterrence models,
and fiscal psychology. What appears from these three theories is that tax
noncompliance is deterred by sanctions (e.g. Tittle 1980), and can be modeled
∗
The author appreciates the valuable assistance of Vijay Kamdar.
bureaucracy, corruption, and tax compliance. The third section describes the
3
doi: 10.1007/978-0-387-25712-9_1, © Springer Science + Business Media, LLC 2008
R.W. McGee (ed.), Taxation and Public Finance in Transition and Developing Economies,
as a purely economic decision under uncertainty (e.g. Allingham and Sandmo
1972), or can be the result of non-economic factors such as demographics,
attitudes, and perceptions or compliance (e.g. Kinsey 1986). But, given the
likelihood that cheaters are rarely caught and penalized, and also defy a strict
profile description, the three theories and related findings do not provide a
definite explanation of why people pay taxes (Alm et al. 1992, p. 22), and over
predict noncompliance (Andreoni et al. 1998, p. 855). Tax noncompliance is a
pervasive phenomenon in all societies. There is good evidence of a shadow
economy, internationally (for a survey, see Cowell 1990, pp. 22–23). The crux
of the problem in the shadow economy is the fact that individuals are behaving
dishonestly by providing false information. When reviewing the literature on
the ethics of tax evasion from various religious perspectives and with a focus on
the question of whether tax evasion is unethical if the payments would go to an
evil or corrupt state, McGee (1999a) found differences among religions with the
surprising result that “the Jewish literature strongly suggests that it would be
unethical to evade taxes under the Nazi regime, even though the taxes collected
might be used to kill Jews” (McGee 1999a, p. 150). In the case of transition/
developing countries like Armenia, McGee (1999b) found that tax evasion is
easy because there is no mechanism to collect taxes and there is a widespread
feeling that people do not owe anything to the government because the
government does not do anything for them.
Basically, it is the distortion of information that can affect the state’s
problem of exercising control and authority on the economy (Cowell 1990,
p. 40). What would lead citizens to behave more honestly, provide correct
information and improve the tax compliance rate? One answer to this question
is the role of government in creating an intrinsic motivation to pay taxes,
which has sometimes been called “tax morale” (Frey 1994, 1997a, b).
Government can try to deter tax noncompliance through a large and strong
bureaucracy (Kornhauser 2002). The likely impact of a large bureaucracy is
the increase of bureaucratic corruption (Hall and Jones 1997; Bai and Wei
2003; Waller et al. 2000). Both large bureaucracy and bureaucratic corruption
are likely to reduce the tendency of individuals in a given state to accept and
trust their government in general and comply with the tax burden in particular
(Slemrod 2002; Slemrod and Katuscak 2002). The government may elect to
control corruption to create conditions more conducive to tax compliance.
Accordingly, the hypothesis to be tested in this study is that:
“Tax compliance is positively related to the level of control
of corruption and negatively related to the level of bure-
aucracy”.
Basically, regardless of the reputation cost and/or the legal punish-
ment tax noncompliance trigger, a citizen might chose to comply with taxes if
the level of bureaucracy is low and the level of control of corruption is high.
In short, less bureaucracy and corruption trigger higher tax compliance.
Taxation and Public Finance in Transition and Developing Economies 4
Data
The determination of the sample rested on securing the necessary data on the
variables of interest specified in the main hypothesis of the paper. A total of 30
developed and developing countries met this test. They are shown in Table 1.
Table 1 List of Countries
Name of country Tax compliance Bureaucracy Control of corruption
Argentina 2.41 15.4 –0.27455
Australia 4.58 23.7 1.60108
Austria 3.60 40.5 1.45711
Brazil 2.14 24.6 0.05762
Canada 3.77 21.5 2.05547
Chile 4.20 22.6 1.02921
Denmark 3.70 37.3 2.12902
Finland 3.53 33.4 2.08459
France 3.86 46.2 1.28239
Germany 3.41 32.6 1.62029
Indonesia 2.53 17.6 –0.79885
Israel 3.69 47.8 1.27669
Italy 1.77 43.8 0.80233
Malaysia 4.34 19.7 0.63342
Mexico 2.46 14.7 –0.27713
Netherlands 3.40 45.9 2.02641
New Zealand 5.00 33.4 2.07494
Norway 3.96 37.2 1.68655
Philippines 1.83 19.1 –0.22809
Poland 2.19 37.5 0.49190
Portugal 2.18 39.0 1.21791
Singapore 5.05 19.8 1.94751
South Africa 2.40 30.4 0.29886
Spain 3.29 32.9 1.21426
Sweden 1.91 41.6 2.08534
Switzerland 4.49 28.3 2.07173
Thailand 3.41 22.7 –0.16479
Turkey 2.07 32.1 –0.34887
U.K. 4.67 36.9 1.70652
U.S.A 4.47 19.9 1.40684
Bureaucracy, Corruption and Tax Compliance 5
Table 2
The Variables
This table describes the variables collected for the 30 countries included in our study.
We present the description and the sources from which each variable is collected.
Variable Description Source
1. Tax compliance
“Assessment of the level of tax
compliance. Scale from 0 to 6 where
higher scores indicate higher
compliance. Data is for 1995.”
(La Porta et al. 1999)
The Global
Competitiveness Report
1996 as reported in La
Porta et al. (1999)
2. Bureaucracy
Percentage of tax government
expenditures over gross domestic
product for 1991–1995
World Bank sources
3. Control of
corruption
Control of corruption score. Scale from
–2.5 to 2.5 where higher scores
indicates lower corruption
Kaufman et al. (2002)
Table 2 summarizes all the variables. They are computed as follows:
1. Tax compliance is measured by an assessment of the level of tax
compliance that varies from 0 to 6. Higher scores indicate higher
compliance (La Porta et al. 1999). The three highest scores are for
Singapore (5.25), New Zealand (5.00) and Australia (4.58). The three
lowest scores are for Italy (1.77), Philippines (1.83) and Sweden
(1.91).
2. Bureaucracy is measured by the percentage of government expen-
ditures over gross domestic product. Higher scores indicate higher
bureaucracy. The three highest bureaucracies are for Israel (47.8),
France (46.2) and Netherlands (45.9).
3. Corruption is measured by a “control of corruption” score obtained
from Kaufman et al. (2002). It measures perceptions of corruption,
conventionally defined as the exercise of public power for private gain.
The scores are oriented so that higher values correspond to better
outcomes, in a scale from –2.5 to 2.5. A higher index indicates lower
corruption and higher control of corruption. It may be also understood
as the lack of corruption. The three highest scores are for Denmark
(2.12), Sweden (2.085) and Finland (2.084). The three lowest scores
are for Indonesia (–0.79), Turkey (–0.34) and Argentina (–0.27).
Determinants of Tax Compliance Internationally
Table 3 presents the descriptive statistics for the main variables used in the
study, while Table 4 presents the Pearson correlations among the same
variables. Table 3 shows that there is a great variation among the countries in
the sample for each of the variables included.
6 Taxation and Public Finance in Transition and Developing Economies
Bureaucracy, Corruption and Tax Compliance
Table 3 Descriptive Statistics
Variables N Mean Std. Dev. Minimum Maximum
TC 30 3.410 1.010 1.770 5.050
GEGDP 30 29.822 10.505 9.300 47.800
COR 30 0.217 0.906 –0.798 2.129
Variables are defined as follows:
TC: Tax compliance score
GEGDP: Government Expenditures over Gross Domestic Product
COR: Corruption score
Table 4 Pearson Correlation
a
TC GEGDP COR
TC 1.000 –0.064
(0.736)
0.582
(0.0004)
*
GEGDP – 1.000 0.526
(0.001)
*
COR – – 1.000
a
Variables are defined in Table 3
*
Significant at 0.01 level
To examine the determinants of tax compliance, the following
regression was used:
01 2iiii
TC GEG COR U
α
αα
=
+++
Where
TC
i
= Tax compliance score for country i (La Porta et al. 1999)
GEG
i
= Government expenditures over gross domestic product
COR
i
= Control of corruption score for country i (Kaufman et al. 2002)
The results of the regression are presented in three columns of Table 5.
Column 1 of Table 5 presents the result of regressing tax compliance
against the control of corruption score. As expected, the impact of control of
corruption on tax compliance is positive and significant (t = 3.99, p = 0.01).
This is in conformity with our thesis that the control of corruption creates a
favorable tax morale, more conducive to tax compliance.
Column 2 of Table 5 presents the result of regressing tax compliance
against both the control of corruption and bureaucracy. The impact of control
of corruption is still positive and significant (t = 5.53, p = 0.01). The impact
of bureaucracy is negative and significant (t = –3.05, p = 0.01). This is in
conformity with our thesis that “bloated” bureaucracy creates an unfavorable
tax morale, more conducive to noncompliance with taxes.
Column 3 of Table 5 adds the impact of the type of legal system. The
legal system is used as a control variable with the added implication that tax
compliance will be higher in common law countries. The impact of the legal
system is positive and significant (t = 2.62, p = 0.05). The impact of both
7
a
a
control of corruption and bureaucracy is similar to the findings in columns 1
and 2. Basically, as expected, tax compliance is positively related to control of
corruption and negatively related to the level of bureaucracy, after controlling
for the type of legal system.
The results of Table 5 rely on White’s adjusted standard error
estimates (1980) to deal with heteroscedasticity. The Wald test for joint
significance is reported in the table. In addition, there is no evidence of
serious multicollinearity among the independent variables. The RESET
(regression specification error test), as suggested by Ramsey (1969) and
Thursby (1981, 1985), and the Hausman test (1978), as suggested by Wu
(1973) and Hausman (1978), were used as specification tests. The results of
the RESET test, used to check for omitted variables, incorrect functional
form, and nonindependence of regressors, show that the model used in this
study is not misspecified (see diagnostic check statistics in Table 5).
Table 5 Determinants of Tax Compliance
Dependent Variable
a
Tax Compliance TC
Independent Variable Model
1
Model
2
Model
3
Intercept 2.699
(11.76)
*
3.779 (8.68)
*
3.414 (5.99)
*
COR 0.672 (3.99)
*
0.923 (5.53)
*
0.663 (3.73)
*
GEGDP – –0.046 (–3.05)
*
–0.032 (–1.72)
***
CL – – 0.807 (2.62)
**
R
2
adjusted 31.85% 49.89% 56.32%
F 15.95
*
15.44
*
11.32
*
Wald test 0.01 0.01 0.01
Reset F value 0.04 0.05 0.06
Hausman F value 11.23
*
11.24
*
10.84
*
a
Variables are defined in Table 3. CL= Dummy variable with a value of 1 for common law
countries and a value of 0 for civil law countries
*
Significant at
0.01;
α
=
**
Significant at
0.05
α
=
and
***
Significant at
0.10
α
=
Conclusions
This study examines the international differences in tax compliance and
relates these differences to selected determinants of tax morale. The findings
of the empirical investigation from 30 developed and developing countries
indicate that tax compliance is highest in the countries characterized by high
control of corruption and low size of bureaucracy. It shows that a powerful
deterrent is the creation of a tax morale or climate, where citizens are
protected from corruption and “bloated” bureaucracies. This is an important
result for the developing countries where the lack of tax compliance and the
resulting low revenues can drastically hamper economic development. It is
very urgent for the developing countries to reduce both the corruption and the
8 Taxation and Public Finance in Transition and Developing Economies
Bureaucracy, Corruption and Tax Compliance
bureaucracy in order to create the type of tax morale conducive to both tax
compliance and economic development.
This study is a levels study as opposed to a changes study. One could
argue that changes in tax compliance are sensitive to changes in bureaucracy
and corruption in addition to the levels of current bureaucracy and corruption.
Future research that can secure data on changes on tax compliance could
include both forms of the variables, levels and changes, in a replicated study.
This study may also acts as an anchor for examining the myriad of
potentially correlated omitted variables in this study. Examples may include:
cultural differences regarding tolerance to bureaucracy; cultural differences
regarding tolerance to corruption; the relation between the government and
the population (democratic versus nondemocratic regimes); differences in tax
regimes that impact taxpayer compliance; differences in national wealth that
affect compliance; popularity of government with the population, to name
only a few. Future research needs to address the relevance of these and other
factors to the thesis of this study.
References
Allingham, M.G. and A. Sandmo. 1972. Income tax evasion: A theoretical analysis. Journal of
Public Economics 3(4): 323–338.
Alm, J., Jackson, B., and M. McKee. 1992. Deterrence and beyond: Toward a kinder, gentler
IRS. In Why People Pay Taxes: Tax Compliance and Enforcement, J. Slemrod (ed.).
University of Michigan Press, Ann Arbor.
Andreoni, J., Erard, B. and J. Fienstein. 1998. Tax compliance. Journal of Economic Literature
36: 818–860.
Bai, C E. and S J. Wei. 2003. A perspective on corruption and financial repression. Working
Paper, Harvard University.
Cowell, F.A. 1990. Cheating the Government: The Economics of Evasion. MIT Press,
Cambridge.
Cuccia, A.D. 1994. The economics of tax compliances: What do we know and where do we
go? Journal of Accounting Literature 13: 81–116.
Frey, B.S. 1994. Direct democracy: Politico-economic lessons from Swiss experience.
American Economic Review, Papers and Proceedings 84(2): 338–342.
Frey, B.S. 1997a. A constitution knaves crowds our civic virtues. Economic Journal 107:
1043–1053.
Frey, B.S. 1997b. Not Just for the Money. An Economic Theory of Personal Motivation.
Edward Elgar, Cheltenham.
Hall, R.E. and C.I. Jones. 1997. Fundamental determinants of output per worker across
countries. Working Paper, Stanford University.
Hausman, J.A. 1978. Specification tests in economics. Econometrics 4: 1251–1270.
Jackson, B. and V. Milliron. 1986. Tax compliance research: Findings, problems, and
prospects. Journal of Accounting Literature 5: 125–165.
Kaufman, D., Kray, A. and P. Zoido-Lobaton. 2002. Aggregating governance indicators.
Working Paper, The World Bank.
Kinsey, K. 1986. Theories and models of tax cheating. Criminal Justice Abstracts September:
403–425.
Kornhauser, M.E. 2002. Legitimacy and the right of revolution: The role of tax protests and
9
anti-tax rhetoric in America. Buffalo Law Review 50: 819.
La Porta, R., Lopez-de-Silvanes, F., Schleifer, A., and R.W. Vishny. 1999. The quality of
government. Journal of Economics, Law and Organizations 15: 222–279.
Long, S. and J. Swingen. 1991. Taxpayer compliance: Setting new agendas for research. Law
and Society Review 25(3): 637–683.
McGee, R.W. 1999a. Is it unethical to evade taxes in an evil or corrupt state? A look at Jewish,
Christian, Muslim, Mormon and Baha’i perspectives. Journal of Accounting, Ethics and
Public Policy 2(1): 149–181.
McGee, R.W. 1999b. Why people evade taxes in Armenia: A look at an ethical issue based on
a summary of interviews. Journal of Accounting, Ethics and Public Policy 2(2): 408–416.
Ramsey, F.I. 1969. Test for specification errors in classical linear least squares regression
analysis. Journal of the Royal Statistical 31(series B): 31.
Slemrod, J.B. and P. Katuscak. 2002. Do trust and trustworthiness pay off? NBER Working
Paper no. W9200.
Slemrod, J.B. 2002. Trust in public finance. NBER Working Paper no. W918.
Thursby, F.I. 1981. A test for strategy for discriminating between auto-correlation and
misspecification in regression analysis. Review of Economics and Statistics 63: 117–123.
Thursby, F.I. 1985. The relationship among the specification test of Hausman, Ramsey and
Chow. Journal of the American Statistical Association 80: 926–928.
Tittle, C. 1980. Sanctions and Social Deviance: The Question of Deterrence. Praeger, New
York.
Townsend, R. 1979. Optimal contracts and competitive markets with costly state verification.
Journal of Economic Theory 21: 265–293.
Waller, C.J., Verdier, T. and R. Gardner. 2003. Corruption: Top down of bottom up? Working
Paper, Indiana University Bloomington-Department of Economics.
White, H.A. 1980 Heteroscedasticity-consistent covariance matrix estimator and a direct test
for heteroscedasticity. Econometrica 10: 817–838.
Wu, P. 1973. Alternative tests of independence between stochastic regressors and disturbances.
Econometrics 15: 737–750.
10 Taxation and Public Finance in Transition and Developing Economies
2
Enlarging the European Union: Taxation
and Corruption in the New Member States
∗
M. Peter van der Hoek
Introduction
It was only 18 years ago that the Berlin Wall fell. Anyone who predicted at
the time that the former East Bloc states would join the European Union
within 18 years was considered to be a dreamer. However, after decades of
communism and Soviet domination the countries in Central and Eastern
Europe wanted to return to Europe, as the then Czech president Vaclav Havel
put it. The European Union responded promptly and positively by encourag-
ing the former socialist countries’ reorientation to the West. As early as 1989
the European Union set up the Phare
1
program to offer financial support to the
countries of Central Europe and to help them cope with drastic economic restruc-
turing and political change. The fact that this process started with Poland and
Hungary seems quite logical, since they were the first of the former East Bloc
countries to distance themselves from their communist past. The German unifica-
tion in 1990 marked the end of the historic division of Europe resulting from the
Yalta negotiations of the allies who defeated Germany in World War II.
In 1991, Poland and Hungary were the first countries to conclude
Europe Agreements with the European Union. Again, they were the front-
runners in Central and Eastern Europe. The aim of the agreements was to
establish a free trade area between the European Union and the associated
countries. In 1993, Agreements were also concluded with Bulgaria, the
Czech Republic, Romania and Slovakia. Estonia, Latvia and Lithuania fol-
∗
This research is supported in part by the University of New South Wales (UNSW) during the
author’s stay at the Australian Taxation Studies Program (Atax) as the 2004 Abe Greenbaum
Research Fellow and Rhodes University during the author’s stay as the 2006 Hobart Houghton
Research Fellow. Earlier versions of this paper were presented at seminars at UNSW and Rho-
des University. The author gratefully acknowledges the useful comments received from semi-
nar participants.
1
Phare is the acronym for Poland Hungary Assistance for Reconstruction of the Economy.
R.W. McGee (ed.), Taxation and Public Finance in Transition and Developing Economies, 11
doi: 10.1007/978-0-387-25712-9_2, © Springer Science + Business Media, LLC 2008
Taxation and Public Finance in Transition and Developing Economies
lowed in 1995 and Slovenia in 1996. Next, the associated countries applied
for European Union membership.
In 1992, the European Council adopted the now well-known Copen-
hagen criteria that candidate member countries will have to meet to a suffi-
cient number of benchmarks before accession negotiations can begin. The
benchmarks comprise political, economic and administrative criteria. In 1997,
the European Council invited five Central and Eastern European countries
(Hungary, Poland, Estonia, the Czech Republic and Slovenia) to start acces-
sion negotiations. Also, the European Union developed a pre-accession strat-
egy assisting the associated countries to prepare themselves for membership.
By inviting only five countries to open accession negotiations the
European Council divided the ten accession countries in Central and Eastern
Europe in a first wave (the five above-mentioned countries) and a second
wave (Bulgaria, Latvia, Lithuania, Romania, and Slovakia). In 1999, how-
ever, the European Union effectively abolished the concept of accessions in
two waves by also inviting the other countries to start accession negotiations.
As a result, the European Union engaged in simultaneous accession negotia-
tions with all candidate member countries (including the two Mediterranean
mini-states, Cyprus and Malta, but excluding Turkey).
In December 2002, the European Council closed negotiations with ten
candidate member countries. As a result, they joined the European Union on
May 1, 2004, and the European Union’s membership increased from 15 to 25
countries. Eight of the new member countries are former East Bloc states in-
cluding three former soviet republics (the Baltic States: Estonia, Latvia and
Lithuania) and five countries in Central and Eastern Europe (Hungary, Poland,
Slovenia, Slovakia, and the Czech Republic). The other two countries that
joined the European Union are mini-states in the Mediterranean (Cyprus
2
and
Malta). Accession negotiations with Bulgaria and Romania continued and
resulted in their accession on January 1, 2007. In addition, there are three
candidate member countries (Croatia, Macedonia and Turkey). Two of them
(Croatia and Turkey) have already begun accession negotiations. Albania and
the other former Yugoslav republics that are not yet (candidate) member
countries are potential candidate member states.
2
Since Turkey occupied the north of the island in 1974, Cyprus is divided in Turkish Cypriot
and Greek Cypriot communities. The Turkish Republic of Northern Cyprus is only recognized
by Turkey. Officially, Cyprus joined the European Union as one country. Effectively, however,
only the Greek Cypriot community joined.
12
Enlarging the European Union
Accession and Economic Conditions
The accession of the former East Bloc countries has progressed surprisingly
fast. It seems questionable, therefore, whether they were ready for European
Union membership in all respects. The Treaty on European Union says in Ar-
ticle 49 that “any European State which respects the principles set out in Arti-
cle 6(1) may apply to become a member of the Union.” Article 6(1) states that
“the Union is founded on the principles of liberty, democracy, respect for hu-
man rights and fundamental freedoms, and the rule of law, principles which
are common to the Member States.” The Copenhagen European Council has
made the principles set out in Article 6(1) of the Treaty on European Union
more concrete. These so-called Copenhagen criteria comprise a political crite-
rion, an economic criterion, and the ability to take on the acquis communautaire:
1. Stability of institutions guaranteeing democracy, the rule of law, human
rights and respect for and protection of minorities.
2. The existence of a functioning market economy, as well as the ability to cope
with competitive pressures and market forces within the European Union.
3. The ability to take on the obligations of membership, including adherence to
the aims of political, economic and monetary union.
The answer to the question whether candidate member states meet
these criteria is political in nature and, thus, open to political interpretation.
The impression has been raised that political pressure to keep the enlargement
process going has prevailed in a number of cases and that in fact not all new
member states sufficiently meet the Copenhagen criteria. The level of eco-
nomic development is generally still very low (and the unemployment rate
very high), while the administrative capacity is often still very limited. The
political criterion—democracy, the rule of law, human rights, etc.—together
with geopolitical considerations seem to have settled the matter in a number of
cases. The new member states in Central and Eastern Europe have little experi-
ence with a market system and the decision-making processes in Brussels. How-
ever, the European Union’s eastern enlargement is a fascinating adventure that
undoubtedly will lead to more stability in Europe and a reduction of the risk of
wars within the area to zero. That was precisely the main driving force behind
the creation of the European Union’s predecessors in the 1950s.
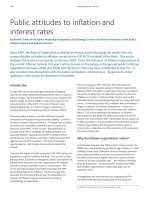
Approximately half of the new member states still cope with budget
deficits that exceed 3% of GDP (the Maastricht criterion). Figure 1 shows the
budget deficits in the period 1991–2007 in the three regions that the European
Bank for Reconstruction and Development (EBRD) discerns: Central
and Eastern Europe and the Baltic States, South Eastern Europe, and the
13
Taxation and Public Finance in Transition and Developing Economies
Commonwealth of Independent States.
3
In the first years after the collapse of
the Soviet Union budget deficits increased to high levels. The highest level
was reached in the Commonwealth of Independent States, it was somewhat
less high in South Eastern Europe and the relatively lowest level was reached
in Central and Eastern Europe and the Baltic States. From the mid-1990s,
deficits came more and more under control. Notably, from 2000 a kind of role
reversal emerged. Deficits are now at the highest level in Central and Eastern
Europe and the Baltic States and at the lowest level in the Commonwealth of
Independent. However, the average deficit in the Commonwealth of Inde-
pendent States is heavily influenced by the large surpluses in oil-rich
countries like Russia (8.1% in 2005) and Kazakhstan (5.3% in 2005). The
differences among individual countries are also large in Central and Eastern
while estimates for 2006 and 2007 do not fundamentally change the picture.
Table 1 Cumulative Inflows of Foreign Direct Investments Per Capita (US$),
1989–2006
New member states
1. Czech Republic 5,512
2. Estonia 5,098
3. Hungary 4,545
4. Slovakia 3,194
5. Latvia 2,203
6. Poland 2,123
7. Lithuania 1,669
8. Bulgaria 1,575
9. Slovenia 1,333
10. Romania 1,110
Candidate member states
1. Croatia 3,177
2. Macedonia 814
Source: EBRD
There are also considerable differences in attractiveness of the new
member states for foreign investors. Table 1 displays the cumulative inflows
of foreign direct investments since the fall of the Berlin Wall in each of the
new member states in Central and Eastern Europe and the Baltic States as
3
Central and Eastern Europe: Czech Republic, Hungary, Poland, Slovakia and Slovenia.
South Eastern Europe: Albania, Bosnia and Herzegovina, Bulgaria, Croatia, Macedonia,
Montenegro, Romania and Serbia.
Baltic States: Estonia, Latvia and Lithuania.
Commonwealth of Independent States: Armenia, Azerbaijan, Belarus, Georgia, Kazakhstan,
the Kyrgyz Republic, Moldova, Russia, Tajikistan, Turkmenistan, Ukraine and Uzbekistan.
Europe and the Baltic States, where general government balances in 2005 varied
from a surplus of 2.3% of GDP in Estonia to a deficit of 7.8% in Hungary,
14
Enlarging the European Union
well as in the candidate member countries in South Eastern Europe. Given the
differences in population size the table does not contain the total amounts of
foreign direct investments, but rather the amounts per capita. Obviously, the
Czech Republic is the foreign investors’ darling. Notable is the second place
of Estonia. As a former soviet republic its starting position was considerably
weaker than those of the other countries of the former East Bloc. Contrary to
Poland’s image in the popular press and with the public at large this country
has attracted a mediocre amount of foreign direct investments in the period
1989–2006. Also notable is that Croatia scores relatively high with an amount
of foreign direct investments that matches Slovakia’s, which is number four
on the ranking list of foreign direct investments in the new member states. On
average, Central and Eastern Europe and the Baltic States have attracted
$3,030 per capita in the period 1989–2006, which is nearly two times as much
as South East Europe’s average ($1,658).
Tax Capacity and Tax Effort
Since most countries in the region cope with continued budget deficits, as
Fig. 1 illustrates, the question arises as to how these countries can tackle their
deficit problems. In principle, governments have a choice between two strate-
gies: increasing revenues or cutting expenditure. It goes without saying that a
combination of both strategies is also possible. The question arises on what
basis a government can make a choice. In other words, at what point should
the emphasis be placed on cutting expenditure rather than raising revenues?
Answering this question involves evaluating a country’s tax capacity
and tax effort. Tax capacity is defined as the ability of a government to raise
tax revenues based on structural factors including the level of economic
development, the number of “tax handles” available, and the ability of the
population to pay taxes (Chelliah 1971, p. 293). Tax effort is defined as a
measure of how well a country is using its taxable capacity, that is tax effort is
the ratio of actual tax revenues to taxable capacity (Bahl 1971, p. 582). Indi-
ces of tax effort provide a tool for measuring differences between countries in
how effectively they are using their potential tax bases. These indices may
indicate the appropriate policy for dealing with budget deficits. For example,
countries with a high tax effort index may need to look at reducing expendi-
ture rather than raising taxes (Stotsky and WoldeMariam 1997).
15
Taxation and Public Finance in Transition and Developing Economies
Fig. 1 General government balances (in % of GDP), 1991–2007. Estimates for 2006
and 2007. Source: EBRD
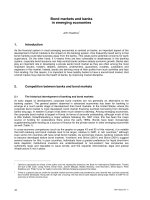
Figure 2 shows general government revenue as a percentage of GDP
over the period 1996–2004 in the three regions, while it includes as bench-
marks the USA and the EU-15 (the European Union of 15 member states as it
existed before May 1, 2004). In Central and Eastern Europe and the Baltic
States, the tax burden is comparable to that of the EU-15 and, thus, well above
the level of the USA. In the mid-1990s, South Eastern Europe’s tax burden
was well below the level of the EU-15 and even lower than the level of the
USA, but it increased in the late 1990s. From the turn of the century tax levels
in Central and Eastern Europe and the Baltic States and South Eastern Europe
are on average within the range of European Union countries, which is
roughly 30–55% of GDP (van der Hoek 2003, p. 22). Though large differ-
ences exist across individual countries, only one of the new member states has
a tax/GDP ratio below this range. The total tax level in Lithuania amounted to
27.4% in 2004, but it was somewhat higher in previous years. Slovenia’s
tax/GDP ratio amounted to 45.4% in 2004, which was the highest of the ac-
cession countries in Central and Eastern Europe and the Baltic States. In two
other accession countries (Hungary and Slovakia) the tax burden in 2004 was
also over 40% (nearly 45%). In particular in the period 1997–2000 the total
tax level of Slovakia was considerably higher than in 2004.
-18
-16
-14
-12
-10
-8
-6
-4
-2
0
2
1990 1991 1992 1993 1994 1995 1996 1997 1998 1999 2000 2001 2002 2003 2004 2005 2006 2007
CEE+BS SEE CIS
16
Enlarging the European Union
Fig. 2 General government revenue (in % of GDP), 1996–2004. Source: EBRD and
OECD
In the Commonwealth of Independent States the situation with regard to
the tax burden is the reverse. As can be expected, these countries face the
greatest taxation problems. They have been under communist rule for over
sixty years. The state financed itself through state-owned companies rather
than taxation, so the countries in this region have little experience with taxa-
tion and markets. No wonder that they are the only of the three regions where
the total tax level is clearly below the range of tax burdens in the member
states of the European Union. Until the early 2000s it was even lower than the
level of the USA. In 2004, five of the Newly Independent States had a
tax/GDP ratio that fell within the range of European Union countries (Uzbeki-
stan with 32.3%, Moldova with 34.7%, Ukraine with 35.6%, Russia with
38.6% and Belarus with 46.2%).
Approaches to Tax Capacity
It seems relevant to know how well the new European Union member states are
utilizing their tax capacity. Musgrave (2000) identifies three factors that deter-
mine a country’s taxable capacity:
• The stage of development, often measured by per capita income.
0
5
10
15
20
25
30
35
40
45
1996 1997 1998 1999 2000 2001 2002 2003 2004
CEE+BS SEE CIS EU-15 USA
17