Tài liệu Public attitudes to inflation and interest rates docx
Bạn đang xem bản rút gọn của tài liệu. Xem và tải ngay bản đầy đủ của tài liệu tại đây (772.42 KB, 16 trang )
208 Quarterly Bulletin 2007 Q2
Introduction
In May 1997, the Government gave the Bank of England
operational responsibility for setting interest rates to meet its
inflation target. The Government’s current remit requires the
Bank to target an annual inflation rate of 2%, based on the
consumer prices index (CPI). The level of interest rates
deemed appropriate to meet this target is decided on a
monthly basis by the Monetary Policy Committee (MPC).
Monetary policy is likely to be most effective if people
understand and support the goal of price stability, as well as
the use of interest rates to achieve it. The Bank uses a variety
of methods to raise public awareness and to explain the
decisions of the MPC. These include: the publication of
minutes of the MPC’s meetings, the Inflation Report and
Quarterly Bulletin; appearances by MPC members before
parliamentary committees; speeches, media interviews and
regional visits by MPC members; the work of the Bank’s
regional Agents; and a range of educational material for
schools.
To assess the degree of public awareness, GfK NOP carries out
a quarterly survey on behalf of the Bank. This survey includes,
among others, questions on the general public’s perceptions of
inflation over the past year, their expectations for inflation
over the next year, and their views on interest rates. This
survey provides valuable information that helps the MPC
assess the prospects for inflation. The box on page 209
discusses the structure of the survey, the calculation of a
measure of inflation expectations and the sampling
methodology in more detail.
Over the past year, MPC members have discussed the
implications of an apparent pickup in inflation expectations
between 2005 and 2006. In particular, they have considered
the extent to which the rise reflected increases in observed
inflation or whether it reflected other factors, such as the
observed rates of nominal demand growth or money and asset
prices. In their discussions, MPC members have considered a
range of measures of inflation expectations — these are
discussed further on pages 36–37 of the May 2007 Inflation
Report. This article examines the behaviour of inflation
expectations in the Bank/GfK NOP survey and some of the
factors that may influence them, drawing on survey results up
to February 2007.
(1)
It also considers the interaction between
inflation expectations and the general public’s views on
interest rates. Responses to other questions in the survey are
discussed in the annex.
Why do inflation expectations matter?
In the United Kingdom, the 1970s and, to a lesser extent, the
1980s were characterised by periods of high inflation. In 1981,
Geoffrey Howe, then Chancellor of the Exchequer, observed
that ‘squeezing inflation out from an economy which has
become accustomed to higher rates over a period of years
cannot be an easy or painless task… the inflation mentality
must be eradicated’. So why does this ‘inflation mentality’
(and inflation expectations in particular) play such an
important role?
In bargaining over their nominal pay, employees will be
concerned with the purchasing power of their post-tax
Since 2001, the Bank of England has published an annual article discussing the results from the
survey of public attitudes to inflation carried out by GfK NOP on behalf of the Bank. This article
analyses the results of surveys up to February 2007. Given the relevance of inflation expectations to
the current inflation outlook, this year’s article focuses on the pickup in the general public’s inflation
expectations between 2005 and 2006, and the factors that may have contributed to that rise. It
also considers the interactions with the public’s attitudes to interest rates. Responses to other
questions in the survey are discussed in the annex.
Public attitudes to inflation and
interest rates
By Ronnie Driver of the Bank’s Monetary Assessment and Strategy Division and Richard Windram of the Bank’s
Inflation Report and Bulletin Division.
(1) Results for the May 2007 survey were published on 14 June.
Research and analysis Public attitudes to inflation and interest rates 209Research and analysis Public attitudes to inflation and interest rates 209
earnings; that is, the amount of goods and services that they
can buy. For a given nominal wage, higher prices reduce real
spending power. Wages tend to be set on an infrequent basis,
increasing the onus on wage-setters to form a view on future
inflation. If inflation is expected to be persistently higher,
employees may seek higher nominal wages, which could in
turn lead to upward pressure on companies’ output prices and,
hence, higher consumer prices.
Inflation expectations also affect inflation directly by
influencing companies’ pricing behaviour. If companies expect
general inflation to be higher in the future, they may believe
that they can increase their prices without suffering a drop in
demand for their output.
Finally, inflation expectations also influence consumption and
investment decisions. For a given path of nominal market
interest rates, higher expected inflation by households and
companies implies lower expected real interest rates. That
would tend to make spending more attractive relative to
saving. But if nominal market interest rates rise in response to
expectations that the MPC will raise Bank Rate to curtail any
inflationary pressure, real rates might not actually decline.
Overall, it is essential for the effectiveness of monetary policy
that inflation expectations remain anchored to the target.
Good estimates of inflation expectations, and understanding
what influences them, are therefore important for successful
monetary policy.
How are inflation expectations formed?
Economists usually assume that individuals form their
expectations based on all the relevant information (including
about the structure of the economy). In other words, they
assume that people have ‘rational expectations’. But in reality,
it is unlikely that expectations are formed quite in this way.
Rational expectations ‘impute much more knowledge to the
agents… than is possessed by an econometrician, who faces
estimation and inference problems that the agents… have
somehow solved’ (Sargent (1993)).
In practice, different households may form their inflation
expectations in different ways. Some households may form
their expectations based on a structural relationship, such as
the trade-off between inflation and unemployment or
demand. Others may use an entirely empirical approach. For
example, people may adapt their expectations based on their
recent memories of inflation data.
(1)
Or they may use other
information that they observe to be closely correlated with
their experience of inflation. In addition, people may be
totally forward looking, totally backward looking or some
combination of the two. Some individuals may employ simple
rules of thumb when forming their expectations. Others may
simply assume that inflation will be equal to the inflation
Assessing inflation expectations using the
Bank/GfK NOP survey
Inflation expectations are not directly observed. To fill that
information gap, in 1999 the Bank commissioned GfK NOP to
conduct a regular survey of attitudes to inflation on its behalf.
GfK NOP conducts the survey each February, May, August and
November. Each survey covers around 2,000 individuals, with
an additional 2,000 taking part in a more comprehensive
exercise each February. Respondents are asked how they think
prices of goods and services in the shops have changed over
the past twelve months, and how they expect those prices to
change over the next twelve months. Inflation expectations
may vary across different people (as well as over time); for
example, people will buy different goods and services and so
will experience different movements in prices. For that reason,
interviewers also collect information about the respondents,
such as their age and income.
(1)
Given uncertainties about future inflation, respondents’
expectations will usually take the form of a range. In order to
capture this, respondents are shown a series of showcards,
each of which describes a range of price changes, and are asked
to select which one best summarises their expectations.
(2)
To assess the macroeconomic implications of the survey
results, it helps to create a summary measure. This requires an
assumption about how individuals’ specific expectations are
distributed within these ranges. To obtain a specific estimate,
individual expectations are assumed to be evenly distributed
within each range. However the highest and lowest ranges are
open-ended, so the distribution of individuals’ specific
expectations in these extreme ranges cannot be uniquely
defined. This creates difficulty with calculating mean
measures of expectations. Instead GfK NOP reports the
median outcome, which is unlikely to fall within the extreme
ranges.
As with all surveys, the Bank/GfK NOP survey is subject to
sampling error.
(3)
The sample is designed and weighted to
ensure it is representative of known population data on age,
gender, social class and region.
(1) See Lombardelli and Saleheen (2003) for a discussion of the relationship between
inflation expectations and demographic factors.
(2) The showcards used are: ‘Go down’, ‘Not change’, ‘Up by 1% or less’, ‘Up by 1% but
less than 2%’, ‘Up by 2% but less than 3%’, ‘Up by 3% but less than 4%’, ‘Up by 4%
but less than 5%’, ‘Up by 5% or more’, ‘No idea’.
(3) For more information see the ‘Survey methodology and notes’ available at
www.bankofengland.co.uk/statistics/nop/index.htm.
(1) For example, see Orphanides and Williams (2003).
210 Quarterly Bulletin 2007 Q2
target set by the Chancellor.
(1)
And the method people use to
form their expectations can change over time and over
monetary policy regimes.
(2)
In forming inflation expectations, people’s behaviour will be
influenced by the opportunity cost of gathering the
information needed to make inflation forecasts. People should
collect and process information until the cost of an additional
piece of information outweighs the benefits of an improved
forecast. Expectations are then said to be ‘economically
rational’ (Feige and Pearce (1976)). If the costs of collecting
information are high, expectations are more likely to deviate
from the full information (rational expectations) benchmark.
Some data are difficult to collect. For example, people may
find it costly to obtain information about the structure of the
economy (about which there is considerable uncertainty, even
among the economics profession). By contrast, other data
are relatively easy to collect. For example, most
macroeconomic data are readily available from the internet.
And dissemination of information by the media can also play a
part in reducing the costs associated with gathering
information.
The next section uses some of these concepts to look at recent
trends in public attitudes to inflation and, in particular, what
might help to explain the pickup in inflation expectations
between 2005 and 2006.
Recent trends in public attitudes to inflation
The Bank/GfK NOP survey asks respondents how they expect
‘prices in the shops to change over the next twelve months’.
This is designed to reflect a concept of inflation the general
public are likely to be familiar with, rather than any specific
measure of inflation (such as the CPI inflation rate). Although
necessary to gather meaningful information, this can lead to
complications when making comparisons with official
measures. There may also be significant variation in the way
different respondents interpret the question. It is worth noting
that, given the question, references to inflation expectations in
this article are to the one year ahead horizon, unless otherwise
specified.
The Bank typically uses the survey median to summarise the
distribution of responses to the questions on public attitudes
to inflation (see the box on page 209). Chart 1 shows that
median inflation expectations have been fairly stable over
much of the history of the survey. However median
expectations picked up at the start of 2006 and have remained
elevated since then: expectations were on average
0.5 percentage points higher in 2006 than in 2005, and the
February 2007 survey showed that median expectations were
unchanged at 2.7%, a series high. So what could have driven
the pickup between 2005 and 2006?
As discussed above, one potential explanation is that
respondents’ expectations of inflation over the next year are
closely linked to their perceptions of current inflation. The
survey asks respondents how they think the prices of ‘goods
and services’ have changed over the past twelve months.
According to the Bank/GfK NOP survey, inflation expectations
over the next twelve months have typically followed
perceptions of current inflation closely: the correlation
between the two since the survey began in 1999 is 0.92.
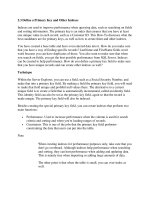
This correlation is based on the aggregate series and may mask
differences at a disaggregated level. Using the February 2007
survey results, Chart 2 plots each respondent’s perception of
inflation over the past year against their expectation of
inflation over the next year. The width of each bubble
corresponds to the proportion of respondents holding that
view. So if all respondents report that their perceptions and
expectations are the same, then all the bubbles would lie on
the 45° line. The chart shows that the largest bubbles do
indeed lie on this line: for just over half of the respondents
who expressed an opinion on both questions, inflation over the
next twelve months was expected to be in the same range as
their perception of past inflation. This confirms that, even at a
disaggregated level, the majority of households tend to report
similar perceptions and expectations of inflation.
The Bank has explored the relationship between inflation
expectations and perceptions in previous publications.
(3)
The
0.0
0.5
1.0
1.5
2.0
2.5
3.0
3.5
1999 2000 01 02 03 04 05 06 07
Percentage changes in prices
Averages in 2005 and 2006
Perceptions over the past year
Expectations over the next year
Source: Bank/GfK NOP survey.
(a) Median responses.
Chart 1 Bank/GfK NOP inflation perceptions and
expectations
(a)
(1) For example, Brazier et al (2006) present a model in which agents use ‘heuristics’ to
determine their inflation expectations. In some periods agents use an ‘inflation
target’ heuristic, where they expect inflation to be equal to the target. In other
periods, they use a ‘lagged inflation’ heuristic, where their expectation is a function of
previous inflation outturns.
(2) Erceg and Levin (2003) show that US surveys suggest that people change their
inflation expectations in response to monetary policy shifts. Farmer, Waggoner and
Zha (2007) show that not only does the current monetary policy regime matter for
expectations — the probability that this policy may change in the future is also
important.
(3) See, for example, Ellis (2006) or pages 24–26 of the November 2005 Inflation Report.
Research and analysis Public attitudes to inflation and interest rates 211
next section discusses why the two may be related in more
detail.
Potential links between inflation expectations
and inflation perceptions
Following an inflationary shock, inflation may take time to
adjust back to the target. The speed of this adjustment will
depend upon a number of factors. These include: the
persistence of any inflationary shock; the response of
monetary policy; and the way in which inflation expectations
are formed. Consequently, close correlations between
people’s perceptions and expectations of inflation, such as
seen in the data, are subject to a number of different
interpretations.
For example, a one-off increase in the price level should only
lead to a temporary rise in the inflation rate. In this instance,
inflation perceptions may pick up by more than inflation
expectations, such that a wedge opens up between the two.
But if the shock is deemed to be more persistent, perhaps
reflecting underlying inflationary pressures in the economy,
inflation expectations may also increase, and any wedge with
perceptions would be smaller.
In addition, any monetary policy response deemed necessary
will take time to have its full effect on inflation. Since the
Bank/GfK NOP survey measures inflation expectations over
the next twelve months, it may therefore be entirely rational
for respondents to expect any perceived deviation of inflation
from target to persist over that period.
(1)
In this case, any
wedge between people’s perceptions and expectations would
also be smaller.
And the relationship will also be affected by the time
households take to adjust their own expectations towards
target. For example, inflation expectations might take time to
return to target if it is costly for households to gather the
necessary information. But the speed of adjustment will also
be influenced by respondents’ attitudes to interest rates,
including their understanding of the monetary policy
framework and the transmission mechanism. The public’s
attitudes to interest rates are discussed later in the article.
Influences on inflation perceptions
If people’s expectations are related to their perceptions of
current inflation, what factors affect these perceptions? One
key driver is likely to be the official data. Another may be the
inflation rates of ‘high-visibility’ items. Finally, discussions in
the media could exert an influence on households’ attitudes to
inflation. This section considers these hypotheses in turn.
Correlations with official inflation data
As mentioned previously, the Bank/GfK NOP survey does not
ask about people’s views on a specific measure of inflation. So
Chart 3 shows the survey median inflation perception
alongside a selection of headline inflation rates.
(2)
CPI
inflation — the measure targeted by the MPC — increased
from 1.8% in March 2006 to 3.1% in March 2007 before falling
back to 2.8% in April.
(3)
As discussed in the May 2007 Inflation
Report, increases in food and energy prices accounted for
around half of that rise. But the inflation rates of goods and
services besides food and energy have also picked up over the
past year. In part that may reflect developments relating to
specific components, but it is also consistent with a broader
pass-through of higher costs and the strength of demand.
(4)
The upper panel in Table A presents simple correlations
between the survey-based measure of inflation perceptions
and the data shown in Chart 3. Simple correlations say
nothing about causal relationships and, given that the survey
asks about prices of ‘goods and services’ rather than the
inflation rate as measured by any specific index, it is not clear
which measure of inflation should be best correlated with the
responses. In addition, these correlations are sensitive to the
period over which they are calculated. So any conclusions
should be treated with caution. Overall, however, inflation
perceptions do appear to have some correlation with the
current inflation data.
(1) It should be noted that measures of longer-term inflation expectations (such as those
derived from financial markets) have also picked up a little since the middle of 2005.
But interpreting movements in market-based breakeven inflation rates is not
straightforward. For example, they contain an inflation risk premium and are linked to
RPI rather than CPI inflation.
(2) This analysis uses the consumer prices index (CPI), the retail prices index (RPI) and the
retail prices index excluding mortgage interest payments (RPIX). For further
discussion on the differences between these measures, see Office for National
Statistics (2004).
(3) At the time this Bulletin went to press, the May 2007 CPI data had not been
published.
(4) See the box on page 28 of the May 2007 Inflation Report.
0 0–1 1–2 2–3 3–4 4–5 >5<0
0
0–1
1–2
2–3
3–4
4–5
>5
<0
Perceptions of inflation over the past year (per cent)
Expectations of inflation over the next year (per cent)
Sources: Bank/GfK NOP survey and Bank calculations.
(a) Respondents who answered either question ‘No idea’ are excluded. As respondents are asked
to select from inflation ranges that typically cover one percentage point, some bubbles may
be partly obscured.
Chart 2 Individual views of inflation perceptions and
expectations
(a)
212 Quarterly Bulletin 2007 Q2
As discussed previously, the general public may use
information on the official inflation target measure to help
form their inflation perceptions. Until December 2003, the
target was specified in terms of RPIX inflation but then
subsequently changed to CPI inflation. So the correlation
between perceptions and CPI inflation might be expected to
have increased in recent years. Indeed, this correlation has
increased slightly since the inflation target was changed. But
perceptions remain most closely correlated with RPIX inflation
and this correlation has also increased towards the end of the
sample period. So it could be that inflation perceptions have
been influenced more in recent years by specific movements in
inflation that are common to both CPI and RPIX inflation
measures. The correlation of RPI inflation with perceptions of
inflation has declined in recent years.
Given the close relationship between inflation expectations
and perceptions, it is unsurprising that similar results hold
when examining correlations between expectations and
current inflation data (see the lower panel in Table A). The
correlations are slightly lower compared with those based on
inflation perceptions; this may reflect the additional degree
of uncertainty when forming expectations about future
inflation. It may also reflect people’s beliefs about the extent
to which any movements in actual inflation are expected to
persist.
So both inflation perceptions and expectations appear to have
a reasonably close relationship with actual inflation data. A
key question is whether perceptions and expectations have
increased by more or less than would have been expected on
the basis of past correlations, given the movements in actual
inflation. One way to answer this question is by using simple
regression techniques to estimate the relationship between
the survey measures of inflation perceptions and expectations
and actual inflation. These regressions take the form:
(1)
where
π
j ,t
represents either the Bank/GfK NOP median
perception of inflation over the past year or expectation of
inflation in the following year,
α
is a constant,
π
i ,t
is a measure
of current inflation, and
ε
t
is an error term. The regressions
were run three times each, using the inflation rates of CPI, RPI
and RPIX as the explanatory variables.
(1)
The results are shown
in Charts 4 and 5, where the swathes show the range of fitted
values from the regressions.
The results suggest that, towards the end of the sample period,
both perceptions and expectations were higher than would
παβπε
jt it t,,
=+ +
Table A Correlations between current inflation and inflation
perceptions
(a)
CPI RPI RPIX
1999–2007 0.53 0.55 0.49
2004–07 0.63 0.26 0.71
2005–07 0.59 0.20 0.66
Correlations between current inflation and inflation
expectations
(a)
CPI RPI RPIX
1999–2007 0.44 0.51 0.50
2004–07 0.36 0.17 0.58
2005–07 0.54 0.17 0.61
Sources: Bank/GfK NOP survey and ONS.
(a) Correlations between the median Bank/GfK NOP inflation perceptions/expectations and the average annual
inflation rates in the three months prior to the survey month.
(1) Measures of ‘current inflation’ are based on the average annual inflation rates in the
three months prior to the survey month. The results are fairly robust to using
alternative measures of ‘current inflation’, such as the inflation rate in the same
month as the survey is conducted.
1.6
1.8
2.0
2.2
2.4
2.6
2.8
3.0
2000 01 02 03 04 05 06 07
Change in inflation target
Range of fitted values
(b)
Percentage changes in prices
Perceptions over
the past year
(a)
0.0
Sources: Bank/GfK NOP survey, ONS and Bank calculations.
(a) Median responses.
(b) The range of fitted values shows the difference between the maximum and minimum fitted
values from the three regressions (CPI, RPI and RPIX) at each point in time.
Chart 4 Explaining Bank/GfK NOP perceptions with
measures of current inflation
0
1
2
3
4
5
1999 2000 01 02 03 04 05 06 07
CPI
RPI
RPIX
Survey measure of
inflation perceptions
(a)
Percentage changes in prices on a year earlier
Sources: Bank/GfK NOP survey and ONS.
(a) Median responses.
Chart 3 Bank/GfK NOP survey inflation perceptions and
measures of current inflation
Research and analysis Public attitudes to inflation and interest rates 213
have been expected simply by extrapolating from past
correlations on the basis of current inflation alone. It is
noteworthy that the level of expectations was lower during
2005 than would have been suggested by the average
relationship over the past. So the pickup in inflation
expectations since then is also larger than can be explained by
this simple metric.
Given that the rise in both inflation perceptions and
expectations was greater than the past relationship with
inflation would suggest, it is likely that other factors have
influenced households’ responses. One possibility is that
medium-term inflation expectations have risen, perhaps
reflecting the observed growth rates of nominal demand or
money and asset prices. An alternative explanation is that
households’ perceptions and expectations have been
influenced by movements in the prices of a subset of
‘high-visibility’ purchases or by discussions of inflation in the
media. The next section explores these last two explanations
in greater detail.
Relationship with inflation visibility
The headline rate of CPI inflation can mask a wide dispersion
of price changes across different items. Prices of some goods
may be falling, while prices of others may be rising more
quickly (Chart 6). In addition there is likely to be significant
variation in the amount and frequency of different households’
expenditure on the various goods and services that make up
the CPI basket. It may be difficult for consumers to keep track
of all these different prices and, hence, accurately judge the
current rate of overall inflation.
Given the wide variation in price changes across items,
households’ perceptions of inflation may be influenced more
by movements in the prices of certain ‘high-visibility’ items.
One way of measuring an item’s visibility is how important the
item is to the consumer. For example, consumers require basic
sustenance and heating/lighting for their homes.
Consequently, they may be particularly aware of swings in
food and gas and electricity prices. When these prices are
rising rapidly, households’ perceptions of inflation may
increase by more than aggregate inflation, which may in turn
feed through into higher inflation expectations.
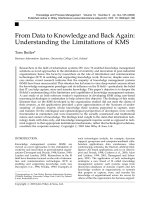
Food and gas and electricity prices have risen sharply since
March 2006, and account for a significant part of the pickup in
CPI inflation since then (Chart 7).
(1)
And it does appear that
inflation expectations have been more highly correlated with
food and gas and electricity price inflation than with aggregate
CPI inflation over the past couple of years (Table B).
(1) See the box on page 28 of the May 2007 Inflation Report.
0.6
0.4
0.2
0.0
0.2
0.4
0.6
0.8
1.0
1.2
1.4
Mar. June Sep. Dec. Mar.
Food and non-alcoholic beverages
Electricity, gas, liquid and solid fuels
Other
(b)
CPI
Percentage points
+
–
2006 2007
(a) Contributions to the cumulative increase in annual CPI inflation.
(b) Includes vehicle fuels and lubricants.
Chart 7 Contributions to the increase in annual CPI
inflation since March 2006
(a)
6
4
2
0
2
4
6
8
1997 99 2001 03 05 07
CPI
Median (50th percentile)
Percentage changes on a year earlier
+
–
(a) The limits of the dark band in the chart are the 35th and 65th percentiles of that distribution.
The pair of lighter bands include a further 30% of the items in the basket, so that the entire
coloured region includes 60% of the items in the basket.
Chart 6 Distribution
(a)
of price changes of
subcomponents of the CPI
2000 01 02 03 04 05 06 07
1.6
1.8
2.0
2.2
2.4
2.6
2.8
3.0
Percentage changes in prices
Change in inflation target
Expectations over
the next year
(a)
Range of fitted values
(b)
0.0
Sources: Bank/GfK NOP survey, ONS and Bank calculations.
(a) Median responses.
(b) The range of fitted values shows the difference between the maximum and minimum fitted
values from the three regressions (CPI, RPI and RPIX) at each point in time.
Chart 5 Explaining Bank/GfK NOP expectations with
measures of current inflation
214 Quarterly Bulletin 2007 Q2
An alternative way of thinking about visibility is the degree to
which members of the general public can observe discussions
of inflationary pressure in the press and media. For example,
more frequent discussions of inflation may increase awareness
of inflation among members of the general public. It may also
prompt them to reassess their views on a more regular basis, or
may increase or improve the information they have available
when forming their expectations. Unfortunately, the Bank/GfK
NOP survey only goes back to 1999, which is a relatively short
time period in which to examine the relationship with media
coverage. However, since people’s perceptions and
expectations of inflation are well correlated with RPIX
inflation, this can be used as a proxy for inflation expectations
further back.
Chart 8 shows the relationship between the frequency with
which inflation is discussed in a range of UK newspapers, RPIX
inflation and median Bank/GfK NOP inflation expectations.
The correlation between media coverage and actual RPIX
inflation is 0.48 over the period 1988–2007. But the
correlation is much better over recent years — it rises to 0.70
over the period 1999–2007, and 0.80 over the period 2003–07.
The number of stories about inflation has picked up sharply
over the past year, and is only slightly below its 1990 peak.
The fact that the timing of the recent increase in media
discussions coincides with the pickup in the Bank/GfK NOP
measure of expectations suggests that media discussions may
have played some role in pushing up households’ expectations
of future inflation.
However the relationship between media coverage of inflation
and inflation expectations is likely to be significantly more
complicated than this analysis suggests. For example, greater
newspaper coverage increases the amount of information
easily available to households, meaning that their inflation
expectations may lie closer to a rational expectations
benchmark (Carroll (2001)). To the extent that monetary
policy is credible, this benchmark should place greater
weight on the inflation target, so it is not clear that
expectations should automatically rise when media coverage
increases.
In addition, the analysis presented here does not distinguish
between articles referring to more or less inflationary pressure.
Articles that argue that inflation will remain high are likely to
have different implications for inflation expectations than
those which argue that inflation is likely to fall sharply. So,
while the content and nature of the discussion in the media is
likely to be important, more detailed work is required to assess
the relationship between media coverage and inflation
expectations.
Conclusions on inflation expectations
Based on the recent Bank/GfK NOP surveys, inflation
expectations remain elevated. The analysis presented so far
has discussed how the rise in inflation expectations coincided
with increases in people’s perceptions of current inflation,
which in turn may have been influenced by increases in
observed inflation, or the inflation rates of highly visible
subcomponents, such as food and gas and electricity prices. In
addition, discussions of inflation in the media could have
played a role in shaping people’s perceptions of current
inflation and expectations of future inflation. The MPC has
also discussed how expectations may have been influenced by
strong observed growth rates of nominal demand, money and
asset prices.
1988 90 92 94 96 98 2000 02 04 06
Inflation expectations
(right-hand scale)
Number of newspaper mentions
(a)
(left-hand scale)
0
1
2
3
4
5
6
7
8
9
10
0
20
40
60
80
100
120
140
RPIX inflation (right-hand scale)
Per centFour-quarter moving average
07
Sources: © 2007 Factiva, Inc. All rights reserved, Bank/GfK NOP survey and ONS.
(a) Based on Factiva data. Newspapers included in the search are the Daily Express, the
Daily Mail, the Daily Mirror, the Daily Star, The Daily Telegraph, the Financial Times,
The Guardian, The Independent, The Independent on Sunday, The Mail on Sunday, the
News of the World, The Observer, The People, The Sun, the Sunday Mirror,
The Sunday Telegraph, The Sunday Times and TheTimes. The search has been designed to
count the number of headlines containing the word ‘inflation’. It has been refined to
attempt to exclude headlines referring to non-UK inflation.
Chart 8 RPIX inflation, Bank/GfK NOP inflation
expectations and frequency of media inflation
discussions
Table B Correlations with inflation perceptions
(a)
Food and
non-alcoholic Electricity, gas, liquid CPI
beverages inflation and solid fuels inflation inflation
1999–2007 0.12 0.68 0.53
2004–07 0.58 0.75 0.63
2005–07 0.58 0.75 0.59
Correlations with inflation expectations
(a)
Food and
non-alcoholic Electricity, gas, liquid CPI
beverages inflation and solid fuels inflation inflation
1999–2007 0.25 0.54 0.44
2004–07 0.52 0.53 0.36
2005–07 0.58 0.69 0.54
Sources: Bank/GfK NOP survey and ONS.
(a) Correlations between the median Bank/GfK NOP inflation perceptions/expectations and the average annual
inflation rates in the three months prior to the survey month.
Research and analysis Public attitudes to inflation and interest rates 215
Understanding the likely future path of inflation expectations
is essential for successful monetary policy. This path will
depend on the persistence of the factors that people perceive
to be driving inflation and on the monetary policy response.
The wedge that has opened up recently between perceptions
and expectations of inflation could be consistent with at least
some of the pickup in inflation being perceived as temporary.
If this is the case, people’s expectations should begin to fall
back. But if expectations have been pushed up by other, more
persistent, factors, they may take longer to adjust.
In the May 2007 Inflation Report, the MPC projected inflation
to fall back towards the target as the effect of lower domestic
energy price inflation feeds through. But the Committee also
placed some weight on the possibility that inflation
expectations adjust more slowly, based on underlying strength
in growth rates of nominal demand and money. The speed of
adjustment will depend in part on the expected and actual
monetary policy responses. The remainder of this article
examines the interaction between inflation expectations and
interest rate expectations.
Attitudes to interest rates
The evolution of inflation expectations is likely to depend in
part on any expected response of monetary policy. As
discussed earlier, the Bank/GfK NOP survey asks about
people’s inflation expectations over the next twelve months. If
people expect monetary policy to respond in a way that will
affect inflation over this horizon, then a wedge may open up
between people’s inflation perceptions and expectations, as
has been observed since the end of 2005.
The Bank/GfK NOP survey asks several questions that assess
people’s views on interest rates and their understanding of the
transmission mechanism of monetary policy. The next section
discusses: (a) the degree to which people’s perceptions and
expectations of interest rates track actual movements in retail
rates; and (b) the speed with which people expect interest
rates to affect inflation. The responses to these questions may
provide some insights into the complex relationship between
expectations of interest rates and inflation.
Interest rate perceptions, expectations and
movements in retail rates
Question 5 of the Bank/GfK NOP survey asks respondents
‘how would you say interest rates on things such as
mortgages, bank loans and savings have changed over the past
twelve months?’. Since the start of August 2006, Bank Rate
has increased by 1 percentage point. Changes in Bank Rate
affect the cost of finance for high street banks, and so affect
the prices of their loan and savings products. It is still too early
to assess the impact of the 25 basis point increase in Bank Rate
in May on retail effective interest rates.
(1)
But as might be
expected, most of the 75 basis point rise that occurred
between August 2006 and April 2007 was passed through to
variable-rate products. But the average overall effective
mortgage rate only increased by about half the change in Bank
Rate over the same period (Table C).
(2)
This partly reflected
the increasing prevalence of fixed-rate mortgages over the
past few years.
Consistent with movements in retail rates, the net balance of
respondents who perceived that interest rates had increased
over the past year rose to +70 in the February 2007 survey
(Chart 9). This was driven by a significant increase in the
number of respondents who thought interest rates had risen a
lot — this proportion rose to 26%, from an average of 12%
over 2005 and 2006.
Question 6 asks ‘how would you expect interest rates to
change over the next twelve months?’. The net balance of
respondents expecting interest rates to rise has picked up
sharply since the trough in the middle of 2005, but has
remained relatively steady over the past few quarters
(Chart 9).
Over the past couple of years, the perceptions and
expectations balances have come together. One possible
explanation for this convergence may be that interest rate
expectations are increasingly based on people’s perceptions of
recent movements in interest rates. Indeed the individual data
show that, in February 2007, 63% of respondents who
expressed an opinion on both questions reported the same
interest rate perceptions and expectations. This compares to
an average of 44% over the eight surveys between
February 2003 and November 2004. But this increased
(1) Effective interest rates measure the average rate paid on the total stock of
outstanding balances.
(2) See pages 14–15 of the May 2007 Inflation Report.
Table C Bank Rate and effective household interest rates
Per cent
July April Change
2006 2007 (basis points)
Bank Rate 4.50 5.25 75
Borrowing rates
Mortgages 5.29 5.65 36
of which:
Variable 5.46 6.12 66
Fixed 5.06 5.13 7
Unsecured borrowing 9.43 9.82 39
of which:
Variable
(a)
9.69 10.44 75
Fixed 9.06 8.94 -12
Deposit rates
Sight 2.71 3.11 40
Time 4.07 4.81 74
(a) Includes credit card borrowing, overdrafts and variable-rate personal loans.
216 Quarterly Bulletin 2007 Q2
percentage is also consistent with people believing that recent
trends in interest rates will continue.
Chart 9 also shows that, since the inception of the survey in
1999, members of the public have never said, on balance, that
they expected interest rates to fall over the following
twelve-month period, even during periods of persistent cuts
in Bank Rate. But respondents do appear to be good at
judging the momentum in interest rate cycles. Chart 10
shows the net balance of respondents expecting retail interest
rates to increase over the next year, alongside the actual
percentage point change in effective household borrowing
and saving rates over the same period. The correlation
between the public’s expectations and these measures is high
(around 0.80). This suggests that on balance, respondents
have a reasonably good understanding of the MPC’s reaction
function and the relationship between Bank Rate and retail
rates.
The relationship between interest rates and inflation
An important question for analysing the links between interest
rate expectations and inflation expectations is the speed with
which people believe changes in interest rates can affect
inflation. Typical estimates suggest that the maximum effect
on inflation from changes in monetary policy occurs after
around 18–24 months (see, for example, Harrison et al
(2005)). But there is considerable uncertainty around this, and
some respondents might believe that interest rates affect
inflation much more rapidly or more slowly. Alternatively, if
people believe that interest rates have no effect on inflation
over the next year, then the survey measures of interest rate
and inflation expectations should be independent.
Question 9 asks respondents to indicate how strongly they
agree with the statements: (a) ‘a rise in interest rates would
make prices in the high street rise more slowly in the short
term — say a month or two’; and (b) ‘a rise in interest rates
would make prices in the high street rise more slowly in the
medium term — say a year or two’. On balance, more people
thought that higher interest rates will make prices rise more
slowly in the medium term than in the short term. In the
February 2007 survey, there was an increase in both net
balances (Chart 11).
The link between interest rate expectations and
inflation expectations
In an inflation-targeting environment with a credible central
bank, interest rate expectations and inflation expectations
should be closely linked. However this link is likely to be
complex and hard to identify.
0
5
10
15
20
25
30
2001 02 03 04 05 06 07
Net percentage balances
(a)
In the medium term (a year or two)
In the short term (a month or two)
Source: Bank/GfK NOP survey.
(a) The net percentage balances are constructed by subtracting the percentage of respondents
who disagreed with the statement from the percentage who agreed with it.
Chart 11 Higher interest rates will make prices rise more
slowly…
80
60
40
20
0
20
40
60
80
1999 2000 01 02 03 04 05 06 07
Net percentage balances
(a)
Expectations over the next year
Perceptions over the past year
+
–
Source: Bank/GfK NOP survey.
(a) The net percentage balances are constructed by subtracting the percentage who thought
rates had gone/would go down from the percentage who thought they had gone/would
go up.
Chart 9 Bank/GfK NOP interest rate perceptions and
expectations
0
10
20
30
40
50
60
70
80
2000 01 02 03 04 05 06 07
2.0
1.5
1.0
0.5
0.0
0.5
1.0
1.5
Net percentage balance
Household effective loan rate
(left-hand scale, lagged one year)
Expected future changes
in interest rates
(right-hand scale)
Annual percentage point changes
Household effective saving rate
(left-hand scale, lagged one year)
+
–
Sources: Bank/GfK NOP survey and Bank of England.
(a) The net percentage balance is constructed by subtracting the percentage who thought rates
would go down over the next twelve months from the percentage who thought they would
go up.
(b) The annual percentage point changes in effective household interest rates are calculated
using averages of the annual changes in the three months before the survey. The series are
lagged by four quarters to ensure comparability with the survey measure.
Chart 10 Bank/GfK NOP interest rate expectations
(a)
and changes in effective household interest rates
(b)
Research and analysis Public attitudes to inflation and interest rates 217
One hypothesis is that if people expect interest rates to be
higher, they might have lower inflation expectations.
Alternatively, if people have higher inflation expectations, they
may expect interest rates to go up. This highlights the
interdependencies between people’s inflation expectations and
interest rate expectations.
Chart 12, which uses the individual-level data to decompose
the distribution of people’s interest rate expectations by their
inflation expectations, shows that there is a higher
concentration of people who expect inflation to be higher
among those who expect interest rates to rise. This result may
support the latter hypothesis. But this could equally be
consistent with the first hypothesis: reported inflation
expectations may have been even higher had people not
factored in a policy response.
In summary, over the past year the net percentage balance of
respondents expecting interest rates to increase over the next
twelve months has picked up sharply, although that proportion
fell back slightly in the February 2007 survey. Members of the
public have always, on balance, expected interest rates to rise.
However, respondents are good at judging momentum in
interest rate cycles. A higher proportion of people think that
higher interest rates will make prices rise more slowly in both
the short term and the medium term.
The interaction of interest rate expectations and the speed
with which changes in interest rates are expected to affect
inflation are likely to play a role in influencing inflation
expectations. The results in February 2007 show that people
with higher interest rate expectations also have higher
inflation expectations. But interpreting this empirical finding is
difficult, given the interdependencies between the two.
Conclusions
Overall, it is essential for the effectiveness of monetary policy
that inflation expectations remain anchored to the target. The
Bank/GfK NOP survey suggests that the general public’s
inflation expectations have picked up somewhat since 2005. A
key issue for policy is how long households expect that higher
inflation to persist, and the extent to which those expectations
are built into wages and prices.
In the May 2007 Inflation Report the central projection
assumes that inflation expectations return to the target over
time. But assessing how rapidly this happens under alternative
monetary policy settings is complicated by the fact that
different households may form their inflation expectations in
different ways. This article has investigated some factors that
could have contributed to the rise in inflation expectations in
the Bank/GfK NOP survey since 2005 in order to understand
better how inflation expectations are formed.
One possibility is that expectations are formed mainly on the
basis of people’s perceptions of current inflation. These in turn
may have been influenced by the increases in observed
headline inflation, or the inflation rates of highly visible
subcomponents, such as food and gas and electricity. In
addition, discussion of inflation in the media could also have
played a role in shaping people’s expectations. As discussed in
the May 2007 Inflation Report, the MPC expects CPI inflation
to fall back during the remainder of 2007. So if expectations
are formed mainly on the basis of these factors, they might fall
back as energy price pressures ease. But if expectations are
more heavily influenced by observed rates of nominal demand
growth, money and asset prices, or remain focused on the
recent high inflation outturns, they may move back more
slowly. In the May 2007 Inflation Report the MPC placed some
weight on this latter possibility. But there remain significant
uncertainties in this area.
0
10
20
30
40
50
60
70
Rise a lot Rise a little Stay about
the same
Fall a little Fall a lot
Expect inflation greater than 3%
Expect inflation between 1% and 3%
Expect inflation less than 1%
Percentage of respondents
Expectations of interest rates over the next year
Sources: Bank/GfK NOP survey and Bank calculations.
(a) Based on the February 2007 survey. Respondents who answered either question ‘No idea’
are excluded.
Chart 12 Comparing inflation expectations across
groups with different interest rate expectations
(a)
218 Quarterly Bulletin 2007 Q2
Annex
Other economic conditions and attitudes to
monetary policy
This annex discusses the responses to the other questions in
the survey based on information up to February 2007.
The responses to Questions 3 and 10 help gauge public support
for maintaining low and stable inflation. Question 3 asks
whether Britain’s economy would be stronger or weaker as a
result of higher inflation. Over time the proportion of people
who think that higher inflation would weaken the British
economy has been steadily rising: at 56%, the February 2007
reading is the highest in the series. The proportion who thinks
higher inflation would make little difference to the economy
has declined, while the proportion who thinks the economy
would be stronger has remained broadly unchanged since the
survey’s inception.
Question 10 asks ‘If a choice had to be made, either to raise
interest rates to try to keep inflation down; or keep interest
rates down and allow prices in the shops to rise faster; which
would you prefer?’. In February 2007, 56% of respondents
preferred interest rates to be higher compared with only 21%
who said they would prefer higher inflation. Those
proportions have been broadly unchanged over the past four
years. The responses to Questions 3 and 10 suggest that
there is general support for low inflation among the general
public.
Question 4 asks whether people think that the inflation target
is too low or too high. In February 2007, 53% of respondents
thought that the target was ‘about right’. That is down a little
from a peak of 62% in May 2005.
Questions 7 and 8 ask respondents about their views on what
would be best for interest rates. The net balances show that
more people think that it would be best for both the economy
as a whole, and for them personally, if interest rates were
lower (Chart A1). Around 40% of respondents in February
2007 reported that it would be best for them personally if
interest rates went down, while around 20% reported that
they would benefit if rates rose.
The belief that it would be best for people individually if
interest rates were lower is possibly associated with the high
degree of mortgage-financed owner occupation in the
United Kingdom. Around 40% of respondents in
February 2007 were mortgagors, and indeed 58% of these
people reported it would be best for them if interest rates were
lower. A further 18% of mortgagors reported that it would be
best for them if rates stayed where they were, and 13% of
them said it would make no difference. By contrast those
people who own their homes outright may be more likely to
have more financial assets than liabilities. In February 2007,
27% of respondents reported that they owned their homes
outright, and within that subsample, around 40% reported
that it would be best for them if interest rates rose.
Questions 11 and 12 assess whether people are aware of the
way monetary policy works in the United Kingdom.
Question 11 asks whether people know which group of people
meets to set the level of interest rates. The interviewer does
not present respondents with a series of options in this
question. The proportion of respondents who offer an answer
has been rising slightly in recent years, although around half
the respondents still say they do not know. In the February
2007 survey, 36% of respondents answered ‘Bank of England’,
and a further 5% answered ‘the MPC’. These two proportions
have been almost unchanged throughout the history of the
survey.
Question 12 also asks the general public to identify which
group sets interest rates, but in this case the respondents are
asked to choose from a series of possible responses. In
February 2007, 70% of respondents correctly thought that the
Bank of England sets interest rates. But 12% thought rates
were set by government ministers, and 11% had no idea.
These proportions are also little changed since 2003.
Question 13 asks ‘In fact, the decisions are taken by the
Monetary Policy Committee of the Bank of England. Which of
these do you think best describes the Monetary Policy
Committee?’. In the February 2007 survey, 34% of
respondents thought that the MPC is an independent body,
partly appointed by the government. The proportion of
respondents who thought that the MPC is part of the
government fell slightly to 15% while 24% of respondents
thought that the MPC is a completely independent body. But
25
20
15
10
5
0
5
10
1999 2000 01 02 03 04 05 06 07
Net percentage balances
(a)
The economy as a whole
Individuals’ personal situations
+
–
Source: Bank/GfK NOP survey.
(a) The net percentage balances are constructed by subtracting the percentage who thought it
would be best for rates to go down from the percentage who thought it would be best for
them to go up.
Chart A1 Respondents’ views on what would be best for
interest rates
Research and analysis Public attitudes to inflation and interest rates 219
8% still think that the MPC is a government-appointed quango
and 21% of respondents have no idea.
Question 14 asks whether participants are satisfied with the
way the Bank of England is doing its job of setting interest
rates to control inflation. Over the past few years, the
majority of respondents have been satisfied with the Bank,
although this majority has fallen a little since the start of 2006
(Chart A2). In February 2007, 50% reported they were very
satisfied or fairly satisfied, while 13% reported they were fairly
dissatisfied or very dissatisfied. The proportion who were
neither satisfied nor dissatisfied remained unchanged at 25%.
The net balance of respondents who are satisfied with how the
Bank is doing its job fell by 6 percentage points in
February 2007 to +37, its lowest since May 2000.
Chart A3 shows the distribution of responses to this question
by age. Respondents who said ‘no idea’ are excluded from this
analysis to account for the possibility that some groups are
more likely to express an opinion than others. The results
show that it is the youngest age groups that are most
dissatisfied with the Bank. This could in part reflect their
lifetime inflation experiences: the older age groups will have
had greater experience of the problems associated with high
inflationary episodes in the past. It is also possible that the
younger age groups have more debt (both secured and
unsecured) relative to their older counterparts, such that they
have been more directly affected by the interest rate increases
of 2006 and 2007.
Chart A2 Public satisfaction with the Bank of England
0
10
20
30
40
50
60
Very
dissatisfied
Fairly
dissatisfied
Neither
satisfied
nor dissatisfied
Fairly
satisfied
Very
satisfied
Don’t
know
2005 average
2006 average
February 2007
Percentages of respondents
Source: Bank/GfK NOP survey.
0
10
20
30
40
50
60
15–24 25–34 35–44 45–54 55–64 65+ Whole
sample
Net percentage balance
(b)
Source: Bank/GfK NOP survey.
(a) Respondents who answered ‘No idea’ are excluded.
(b) The net percentage balance is calculated by subtracting the percentage of people who were
fairly or very dissatisfied from the percentage who were fairly or very satisfied.
Chart A3 Public satisfaction with the Bank of England by
age group in February 2007
(a)
220 Quarterly Bulletin 2007 Q2
Public attitudes to inflation
Per cent
2003 2004 2005 2006 2007
Feb. May Aug. Nov. Feb. May Aug. Nov. Feb. May Aug. Nov. Feb. May Aug. Nov. Feb.
Q.1 Which of these options best describes how prices of goods and services have changed over the past twelve months?
Gone down 6 5 8 43334554533332
Not changed 11 14 13 12 10 11 11 13 12 14 11 14 9 10 9 8 7
Up by 1% or less 6 7 7 6 7 7 6 6 6 7 6 7 5 5 6 5 5
Up by 1% but less than 2% 12 13 10 10 14 15 16 13 14 17 13 12 10 12 12 11 11
Up by 2% but less than 3% 20 20 19 20 19 21 20 20 20 19 21 19 20 19 20 19 19
Up by 3% but less than 4% 13 11 13 13 13 13 12 12 12 9 13 13 14 13 13 14 16
Up by 4% but less than 5% 7 7 5 6 7 6 8 7 7 7 6 7 9 9 7 9 10
Up by 5% or more 10 9 11 12 11 10 9 11 9 8 9 10 16 16 18 19 17
No idea 14 14 13 18 15 15 15 13 15 15 18 14 14 13 13 13 11
Median 2.4 2.2 2.2 2.5 2.4 2.3 2.3 2.3 2.3 2.0 2.4 2.3 2.8 2.7 2.8 2.9 2.9
Q.2 How much would you expect prices in the shops generally to change over the next twelve months?
Go down 33422222335422222
Not change 7 10 11 5 7 6 8 8 8 9 8 9 7 7 6 6 6
Up by 1% or less 7 8 9 8 89999129968986
Up by 1% but less than 2% 15 18 15 16 17 17 18 18 17 20 18 18 13 15 15 14 14
Up by 2% but less than 3% 20 21 20 20 22 21 23 22 20 20 20 21 21 22 21 21 20
Up by 3% but less than 4% 12 11 11 15 11 12 12 10 12 9 12 10 14 13 13 13 16
Up by 4% but less than 5% 8 6 6 7 7 6 7 7 6 6 6 7 8 7 8 9 9
Up by 5% or more 13 8 9 11 11 12 8 11 8 7 8 10 16 14 14 16 14
No idea 15 15 14 17 14 14 12 14 16 13 15 12 13 13 12 11 12
Median 2.5 2.2 2.2 2.6 2.4 2.4 2.3 2.4 2.2 2.0 2.2 2.2 2.7 2.5 2.5 2.7 2.7
Q.3 If prices started to rise faster than they do now, do you think Britain’s economy would…
end up stronger 777810897889887898
or make little difference 22 26 24 24 22 28 27 27 27 27 24 25 23 23 24 21 21
or weaker 53 47 48 48 49 45 47 49 48 49 49 53 54 55 53 55 56
don’t know 18 19 21 20 19 19 16 17 18 15 18 14 15 15 15 14 16
Q.4 The Government has set an inflation target of 2% (2.5% until November 2003). Do you think this target…
is too high 21 21 22 23 19 20 23 18 18 17 19 20 21 20 23 22 21
or too low 10 8 9 8 8 10 10 10999101110111312
or about right 54 55 52 51 57 56 55 57 58 62 56 57 56 57 55 54 53
no idea 15 15 17 18 16 14 13 16 15 13 16 13 12 13 11 12 13
Q.5 How would you say interest rates on things such as mortgages, bank loans and savings have changed over the past twelve months?
Risen a lot 5 6 4 7 8 13 25 19 15 12 10 10 12 10 12 18 26
Risen a little 12 12 11 28 46 47 45 45 43 39 27 29 29 26 43 50 46
Stayed about the same 14 20 13 23 16 14 9 11 16 23 21 26 29 33 21 13 9
Fallen a little 34 31 35 18 10 5 3 5 6 6 21 15 10 9 4 2 2
Fallen a lot 15 12 17 5 3 2111221111**
No idea 19 19 20 18 17 19 16 19 19 19 21 19 19 22 19 16 16
All saying ‘risen’ 17 18 15 35 54 60 70 64 58 51 37 39 41 36 55 68 72
All saying ‘fallen’ 49 43 52 23 13 7 4 6 7 8 23 16 11 10 5 2 2
Net risen -32 -25 -37 12 41 53 66 58 51 43 14 23 30 26 50 66 70
Q.6 How would you expect interest rates to change over the next twelve months?
Rise a lot 8 5 4 15 12 17 19 10 9 8 5 7 9 7 12 16 17
Rise a little 33 33 32 56 57 54 54 47 47 44 29 39 38 41 53 56 51
Stay about the same 28 33 33 11 12 11 11 20 23 24 28 27 28 28 17 13 14
Fall a little 11 10 9 2 3 2 2 4 5 8 17 10 7 4 2 2 3
Fall a lot 2 1 1*******11*****
No idea 18 18 20 16 16 16 13 17 17 16 19 17 17 18 15 13 14
All saying ‘rise’ 41 38 36 71 69 71 73 57 56 52 34 46 47 48 65 72 68
All saying ‘fall’ 13 11 10 2 3 2 2 4 5 8 18 11 7 4 2 2 3
Net rise 28 27 26 69 66 69 71 53 51 44 16 35 40 44 63 70 65
Research and analysis Public attitudes to inflation and interest rates 221
Per cent
2003 2004 2005 2006 2007
Feb. May Aug. Nov. Feb. May Aug. Nov. Feb. May Aug. Nov. Feb. May Aug. Nov. Feb.
Q.7 What do you think would be best for the British economy — for interest rates to go up over the next few months, or to go down, or to stay where they are now, or would it
make no difference either way?
Go up 17 14 17 22 23 21 20 14 13 11 10 12 11 11 15 14 13
Go down 1719151515172021212329262622242627
Stay where they are 36 40 38 37 36 36 38 39 41 42 34 39 38 41 37 36 36
Make no difference 11 8 10 8 8 9 8 9 8999101010119
No idea 19 19 20 19 18 17 13 16 17 14 19 15 15 16 14 13 15
Q.8 And which would be best for you personally, for interest rates to…
go up 24 22 23 20 22 19 21 18 19 18 19 19 18 18 19 19 18
go down 29292830 31343735353937383636364139
stay where they are 20 22 20 21 20 20 19 18 20 19 17 20 20 21 19 16 17
make no difference 18 19 18 19 19 19 16 21 17 17 19 17 18 18 20 19 19
no idea 10 9 10 10 9 8 7 8 10 7 9 6 8 7 6 5 7
Q.9 How strongly do you agree with the following statements?
(a)
(a) A rise in interest rates would make prices in the high street rise more slowly in the short term — say a month or two
Agree strongly 2 1 3 3 4
Agree 3535333435
Neither 18 19 17 17 17
Disagree 19 20 22 22 20
Disagree strongly 2 1 3 2 3
Don’t know 24 23 21 22 22
All agree 37 36 36 37 39
All disagree 21 21 25 24 23
Net agree 16 15 11 13 16
(b) A rise in interest rates would make prices in the high street rise more slowly in the medium term — say a year or two
Agree strongly 1 2 3 2 3
Agree 38 37 37 38 39
Neither 18 19 17 17 17
Disagree 16 16 17 18 15
Disagree strongly 1 1222
Don’t know 25 25 24 24 24
All agree 39 39 40 40 42
All disagree 17 17 19 20 17
Net agree 22 22 21 20 25
Q.10 If a choice had to be made, either to raise interest rates to try to keep inflation down; or keep interest rates down and allow prices in the shops to rise faster, which would
you prefer:
(a)
Interest rates to rise 62 57 55 57 56
Prices to rise faster 16 19 20 19 21
No idea 23 24 25 24 23
Q.11 Each month, a group of people meets to set Britain’s basic interest rate level. Do you know what this group is?
(a)
Monetary Policy Committee 44445
Bank of England 35 36 38 36 36
The Government 3 4 3 4 4
The Treasury 1 1 2 1 2
Parliament*****
Other 12222
Don’t know 56 54 50 53 50
Q.12 Which of these groups do you think sets the interest rates?
(a)
Government ministers 12 13 12 14 12
Civil servants * 1 2 1 1
Bank of England 69 69 70 68 70
High street banks 32223
European Central Bank 23332
No idea 13 12 12 12 11
222 Quarterly Bulletin 2007 Q2
Per cent
2003 2004 2005 2006 2007
Feb. May Aug. Nov. Feb. May Aug. Nov. Feb. May Aug. Nov. Feb. May Aug. Nov. Feb.
Q.13 In fact, the decisions are taken by the Monetary Policy Committee of the Bank of England. Which of these do you think best describes the Monetary Policy Committee?
(a)
Part of the Government 13 13 13 18 15
A quango, wholly appointed
by the Government 7 8 7 6 8
An independent body, partly
appointed by the Government 36 38 36 37 34
A completely independent body 24 23 25 22 24
No idea 19 18 18 17 21
Q.14 Overall, how satisfied or dissatisfied are you with the way the Bank of England is doing its job to set interest rates in order to control inflation?
Very satisfied 8 9 12 10 8 9 8 8 11 13 11 11 10 10999
Fairly satisfied 47 46 40 45 46 43 43 44 45 46 45 49 47 44 44 45 41
Neither satisfied nor dissatisfied 24 22 22 22 24 23 24 21 23 21 22 21 23 23 25 25 25
Fairly dissatisfied 7 7 6 6 7 9 10 7 7 6 6 5 6 7 8 8 9
Very dissatisfied 32223233222223334
No idea 11 14 17 15 12 14 12 17 12 12 15 12 12 13 11 11 12
Total satisfied 55 55 52 55 54 52 51 52 56 59 56 60 57 55 53 54 50
Total dissatisfied 10 9 8 8 10 11 13 10 9 8 8 7 8 10 11 11 13
Net satisfied 45 46 44 47 44 41 38 42 47 51 48 53 49 45 42 43 37
Note: * indicates less than 0.5%. Figures may not add to 100 due to rounding. Sampling error depends on the percentage response and the sample size. For example, given the sample of 3,967 in the February 2007 survey, the
sampling error on a 20% response is 0.64.
(a) These questions are only asked in the February survey.
References
Brazier, A, Harrison, R, King, M and Yates, T (2006), ‘The danger of
inflating expectations of macroeconomic stability: heuristic switching
in an overlapping generations monetary model’, Bank of England
Working Paper no. 303.
Carroll, C (2001), ‘The epidemiology of macroeconomic
expectations’, NBER Working Paper no. 8695.
Ellis, C (2006), ‘Public attitudes to inflation’, Bank of England
Quarterly Bulletin, Summer, pages 181–89.
Erceg, C and Levin, A (2003), ‘Imperfect credibility and inflation
persistence’, Journal of Monetary Economics, Vol. 50, pages 915–44.
Farmer, R, Waggoner, D and Zha, T (2007), ‘Understanding the
New Keynesian model when monetary policy switches regimes’,
NBER Working Paper no. 12965.
Feige, E and Pearce, D (1976), ‘Economically rational expectations:
are innovations in the rate of inflation independent of innovations in
monetary and fiscal policy?’, Journal of Political Economy, Vol. 84,
No. 3, pages 499–522.
Harrison, R, Nikolov, K, Quinn, M, Ramsay, G, Scott, A and
Thomas, R (2005), The Bank of England Quarterly Model,
Bank of England.
Howe, G (1981), ‘The fight against inflation’, Mais Lecture.
Lombardelli, C and Saleheen, J (2003), ‘Public expectations of UK
inflation’, Bank of England Quarterly Bulletin, Autumn, pages 281–90.
Office for National Statistics (2004), ‘The new inflation target: the
statistical perspective’, Economic Trends, No. 602, pages 24–46.
Orphanides, A and Williams, J (2003), ‘Imperfect knowledge,
inflation expectations and monetary policy’, NBER Working Paper
no. 9884.
Sargent, T (1993), Bounded rationality in macroeconomics,
Clarendon Press.
Research and analysis Public attitudes to inflation and interest rates 223