Báo cáo khoa học: Amino acid biosynthesis and metabolic flux profiling of Pichia pastoris ppt
Bạn đang xem bản rút gọn của tài liệu. Xem và tải ngay bản đầy đủ của tài liệu tại đây (242.33 KB, 9 trang )
Amino acid biosynthesis and metabolic flux profiling of
Pichia pastoris
Aina Sola
`
1,2
, Hannu Maaheimo
2,3
, Katri Ylo¨ nen
3
, Pau Ferrer
1
and Thomas Szyperski
2
1
Department of Chemical Engineering, Escola Te
`
cnica Superior d’Enginyeria (E.T.S.E), Universitat Auto
`
noma de Barcelona,
Bellaterra, Spain;
2
Department of Chemistry, University at Buffalo, The State University of New York at Buffalo, NY, USA;
3
NMR-laboratory and Structural Biology and Biophysics Program, VTT Biotechnology, Helsinki, Finland
Amino acid biosynthesis and central carbon metabolism of
Pichia pastoris were studied using biosynthetically directed
fractional
13
C labeling. Cells were grown aerobically in a
chemostat culture fed at two dilution rates (0.05 h
)1
,
0.16 h
)1
) with glycerol as the sole carbon source. For
investigation of amino acid biosynthesis and comparison
with glycerol cultivations, cells were also grown at 0.16 h
)1
on glucose. Our results show that, firstly, amino acids are
synthesized as in Saccharomyces cerevisiae. Secondly, bio-
synthesis of mitochondrial pyruvate via the malic enzyme
is not registered for any of the three cultivations. Thirdly,
transfer of oxaloacetate across the mitochondrial membrane
appears bidirectional, with a smaller fraction of cytosolic
oxaloacetate stemming from the mitochondrial pool at the
higher dilution rate of 0.16 h
)1
(for glucose or glycerol cul-
tivation) when compared to the glycerol cultivation at
0.05 h
)1
. Fourthly, the fraction of anaplerotic synthesis of
oxaloacetate increases from 33% to 48% when increasing
the dilution rate for glycerol supply, while 38% is detected
when glucose is fed. Finally, the cultivation on glucose also
allowed qualitative comparison with the flux ratio profile
previously published for Pichia stipitis and S. cerevisiae
grown on glucose in a chemostat culture at a dilution rate of
0.1 h
)1
. This provided a first indication that regulation of
central carbon metabolism in P. pastoris and S. cerevisiae
might be more similar to each other than to P. stipitis.
Keywords:
13
C NMR; central metabolism; flux profiling;
metabolic engineering; Pichia pastoris.
The methylotrophic yeast Pichia pastoris has emerged as an
important host for heterologous protein expression in both
biomedical research and industrial biotechnology [1,2]. As a
eukaryotic organism, P. pastoris offers well known advan-
tages for protein expression, such as facilitated proteolytic
processing as well as efficient protein folding, disulfide bond
formation and glycosylation. Very recently, the capability of
P. pastoris to produce complex human glycoproteins has
been demonstrated in a paradigmatic study [3], indicating
that this organism might well become the premier choice for
future expression of human proteins for medical applica-
tions. Specific advantages of P. pastoris are due to (a) the
availability of an unusually tightly regulated promoter from
the methanol-regulated alcohol oxidase I gene (AOX1)(b)
the system’s efficient protein secretion which, combined with
the very low secretion levels of endogenous proteins, is a
major advantage for their purification, and (c) P. pastoris’
preference to grow in a respiratory mode, which tends to
reduce the excretion of fermentation byproducts such as
ethanol or acetic acid and allows one to reach exceptionally
high cell densities. Furthermore, P. pastoris expresses pro-
teins at high levels when grown on a minimal medium, which
also makes this yeast strain attractive for the production of
stable isotope labeled proteins [4,5] for NMR-based struc-
tural biology and structural genomics [6].
The level of protein expression in P. pastoris depends
critically on the growth conditions, and the attainment of
high cell densities has been shown to improve protein yields
substantially [7]. Typically, aerobic growth is achieved in
two phases. First, the cells are grown in a batch culture with
glycerol. Subsequently, a mixture of glycerol and methanol
Correspondence to P. Ferrer, Department of Chemical Engineering,
Escola Te
`
cnica Superior d’Enginyeria (E.T.S.E), Universitat
Auto
`
noma de Barcelona, 08193-Bellaterra, Spain.
Fax: +34 935 812013, Tel.: +34 935 812141,
E-mail: and Thomas Szyperski,
Department of Chemistry, University at Buffalo, The State University
of New York at Buffalo, NY 14260, USA.
Fax: + 1 716 6457338, Tel.: + 1 716 6456800 ext. 2245,
E-mail: ffalo.edu
Abbreviations:[
13
C,
1
H]-COSY, [
13
C,
1
H] correlation NMR
spectroscopy; BDF, biosynthetically directed fractional;
METAFoR, metabolic flux ratio; ROL, Rhizopus oryzae lipase;
D,dilutionrate;l
max
, maximum specific growth rate;
cyt, cytosolic; mt, mitochondrial; TCA, tricarboxylic acid;
PEP, phosphoenolpyruvate; PPP, pentose phosphate pathway;
PYR, pyruvate; OAA, oxaloacetate; SHMT, serine hydroxymethyl-
transferase; GCV, glycine cleavage pathway; ICL, isocitrate lyase;
MS, malate synthase.
Enzymes: alanine:glyoxylate amino transferase (EC 2.6.1.44), glycine
cleavage system (EC 2.1.2.10), glycerol kinase (EC 2.7.1.30),
FAD-dependent glycerol-3-phosphate dehydrogenase (EC 1.1.99.5),
isocitrate lyase (EC 4.1.3.1), lipase [triacylglycerol acylhydrolase]
(EC 3.1.1.3), malic enzyme (EC 1.1.1.39/1.1.40), malate synthase
(EC 2.3.3.9), pyruvate carboxylase (EC 6.4.1.1), phosphoenolpyruvate
carboxykinase (EC 4.1.1.49), serine hydroxymethyltransferase
(EC 2.1.2.1), succinate dehydrogenase (EC 1.1.1.42), threonine aldo-
lase (EC 4.1.2.5), transaldolase (EC 2.2.1.2), transketolase
(EC 2.2.1.1).
(Received 19 December 2003, revised 23 March 2004,
accepted 20 April 2004)
Eur. J. Biochem. 271, 2462–2470 (2004) Ó FEBS 2004 doi:10.1111/j.1432-1033.2004.04176.x
is fed to the culture in a fed-batch mode. During this second
growth phase, the production of the recombinant protein is
induced by methanol, which activates the AOX1 promoter
controlling the heterologous gene. Notably, adaptation to
growth on methanol leads to the induction of several key
enzymes, e.g. alcohol oxidase, catalase, formaldehyde
dehydrogenase and dihydroxyacetone synthase, as well as
peroxisome biosynthesis [8]. Although methanol assimil-
ation is rather strongly repressed by multicarbon sources
such as glucose and glycerol, coassimilation of a multicar-
bon source and methanol can be triggered at certain growth
conditions [9]. In turn, this allows one to generate a
significant fraction of the heterologous protein from the
cheap C1 source methanol.
Although the central metabolic bioreaction network is
quite similar for all yeast strains, important variations exist
with respect to its regulation [10,11]. It is, for example, well
documented that during aerobic growth of Saccharomyces
cerevisiae, catabolism of glucose and related sugars causes
a strong impairment in respiratory capacity (the so called
ÔCrabtreeÕ-effect). In contrast, most non-Saccharomyces
yeasts grow under aerobic conditions in a respiratory mode,
that is, reduction equivalents are used to reduce oxygen to
water. In fact, variations in the regulation of central carbon
metabolism in non-S. cerevisiae genera are essentially
unexplored. Moreover, even more comprehensive investi-
gations of amino acid metabolism have so far been pursued
only for S. cerevisiae (for example [12]). In view of the
outstanding role of P. pastoris for biotechnology research,
this organism represents an obvious target for studies of its
metabolism.
Stable isotope labeling experiments employed in con-
junction with NMR spectroscopy and/or mass spectrometry
[13] are a powerful tool for metabolic studies. In particular,
biosynthetically directed fractional (BDF)
13
C labeling of
proteinogenic amino acids has been developed into a cost-
effective approach to assess the topology of active bioreac-
tions (i.e. the active pathways) and to quantify metabolic
flux ratios [14]. BDF labeling has been applied to study
central carbon metabolism of eubacteria [14–16] as well as
eukaryotic yeast cells [17,18]. Moreover, when feeding
glycerol as the sole carbon source, such labeling enabled one
to explore amino acid biosynthesis pathways in the halo-
philic archaeon Haloarcula hispanica [19].
In this publication, we employ BDF
13
C-labeling to
elucidate the central carbon metabolism of P. pastoris cells
growing under different dilution rates in chemostat cultures.
Specifically, this study focuses on characterizing P. pastoris
cells growing on glycerol. For comprehensive investigation
of amino acid biosynthesis and comparison with flux ratios
obtained for growth on glycerol, P. pastoris was also grown
with glucose as the sole carbon source.
Materials and methods
Strain and media
A prototrophic P. pastoris strain expressing a heterologous
protein – a Rhizopus oryzae lipase (ROL) – under the
transcriptional control of the AOX1 promoter has been
chosen for metabolic flux ratio profiling. Pichia pastoris
x-33/pPICZaA-ROL [20] is the wild type x-33 strain
(Invitrogen, Carlsbad, CA, USA) with the pPICZaA-derived
expression vector (Invitrogen) containing the ROL gene,
pPICZaA-ROL, integrated in its AOX1 locus. Chemostat
cultures were fed with a defined minimal medium containing
per litre of deionized water: yeast nitrogen base (YNB;
Difco, Detroit, MI, USA), 0.17 g; (NH
4
)
2
SO
4
, 5 g; glycerol
or glucose, 10 g; Antifoam Mazu DF7960 (Mazer Chem-
icals, PPG Industries, Gurnee, IL, USA), 0.1 mL. The YNB
components were sterilized separately by microfiltration
and then added to the bioreactor. The medium used for
starter cultures was YPD medium containing 1% (w/v)
yeast extract, 2% (w/v) peptone, 2% (w/v) dextrose.
Chemostat cultivations
Continuous cultivations were carried out at a working
volume of 0.8 L in a 1.5 L bench-top bioreactor (BiofloIII,
New Brunswick, NJ, USA) at 30 °C, and a minimum of
30% dissolved oxygen tension. Cultivations using glycerol
as the sole carbon source were performed at two different
dilution rates, D (defined as volumetric flow rate/working
volume) of 0.05 h
)1
and 0.16 h
)1
. The cultivation using
glucose as sole carbon source was performed at
D ¼ 0.16 h
)1
. The maximum specific growth rates, l
max
,
of P. pastoris on excess glycerol or glucose are virtually
identical (0.17 and 0.18 h
)1
, respectively). Hence, at
D ¼ 0.16 h
)1
cells are growing at around 90% of l
max
,
for both the glycerol and the glucose cultivation. This
ensures comparability of metabolic flux ratios. Medium
feeding was controlled by a Masterflex pump (Cole-Parmer,
Vernon Hills, IL, USA). The working volume was kept
constant by removal of effluent from the center of the
culture volume by use of a peristaltic pump (B. Braun
Biotech Int., Melsungen, Germany). The pH of the culture
was maintained at 5.5 by addition of 1
M
KOH, and the
airflow was maintained at 1 LÆmin
)1
with filter-sterilized air
using a mass flow controller (Brooks Instruments B.V.,
Veenendaal, the Netherlands). The agitation speed was set
to 500 r.p.m. Starter cultures (100 mL) were grown in 1 L
baffled shake flasks at 200 r.p.m., 30 °C for 24 h. Cells were
harvested by centrifugation (4000 g,10mins)andresus-
pended in fresh medium prior to the inoculation of the
bioreactor.
Analytical procedures
Cell biomass was monitored by measuring the attenuance at
600 nm. For cellular dry weight, a known volume of
cultivation broth was filtered using preweighted filters; these
were washed with two volumes of distilled water and dried
to constant weight. Samples for extracellular metabolite
analyses were centrifuged at 12 000 g for 2 min in a
microcentrifuge to remove the cells. Glycerol, glucose,
organic acids and ethanol were analyzed by HPLC (Hewlett
Packard 1050, Wilmington, DE, USA) analysis using an
ionic exchange column, Aminex HPX-87H (Bio-Rad,
Hercules, CA, USA). The mobile phase was 15 m
M
sulfuric
acid. The injection volume was 20 lL. Data was quantified
by the
MILLENIUM
2.15.10 software (Waters, Milford, MA,
USA). The exhaust gas of the bioreactor was cooled in a
condenser at 2–4 °C (Frigomix R; B. Braun Biotech Int.,
Melsungen, Germany) and dried through a silica gel
Ó FEBS 2004 Metabolic flux profiling of Pichia pastoris (Eur. J. Biochem. 271) 2463
column. Concentrations of oxygen and carbon dioxide in
the exhaust gas of bioreactor cultivations were determined
on line with a mass spectrometer (Omnistar; Balzers
Instruments, Liechtenstein).
Biosynthetically directed fractional (BDF)
13
C-labeling
P. pastoris cells were fed with a minimal medium containing
either 10 gÆL
)1
glycerol or glucose for five volume changes to
reach a metabolic steady state, as is indicated by a constant
cell density and constant oxygen and carbon dioxide
concentrations in the bioreactor exhaust gas. BDF
13
C-
labeling was achieved as described [16,18], that is, by feeding
the medium containing about 10% (w/w) of uniformly
13
C-
labeled and 90% (w/w) unlabeled substrate for one volume
change. Uniformly
13
C-labeled glycerol and glucose (isotopic
enrichment of > 98%) were purchased from Martek
Biosciences (Columbia, MD, USA) and Spectra Stable
Isotopes (Columbia, MD, USA), respectively. Cells were
then harvested by centrifugation at 4000 g for 10 min,
resuspended in 20 m
M
Tris/HCl (pH 7.6) and centrifuged
again. Finally, the washed cell pellets were lyophilized
(Benchtop 5L Virtis Sentry, Virtis Co., Gardiner, NY,
USA), of which 200 mg were resuspended in 3 mL of 20 m
M
Tris/HCl (pH 7.6). After addition of 6 mL of 6
M
HCl, the
biomass was hydrolyzed in sealed glass tubes at 110 °Cfor
24 h, the solutions were filtered using 0.2 lm filters (Millex-
GP, Millipore, Bedford, MA, USA) and lyophilized.
NMR spectroscopy and data analysis
The lyophilized hydrolysates were dissolved in 0.1
M
DCl
in D
2
O, and 2D [
13
C,
1
H]-COSY spectra were acquired for
both aliphatic and aromatic resonances as described [14] at
40 °C on a Varian Inova spectrometer (Varian, Inc., Palo
Alto, CA, USA) operating at a
1
H resonance frequency of
600 MHz. The spectra were processed using the program
PROSA
[21] or standard Varian spectrometer software
VNMR
(version 6.1, C). The program
FCAL
2.3.1 [22] was used for
the integration of
13
C-
13
C scalar fine structures in 2D
[
13
C,
1
H]-COSY, for the calculation of relative abundances
(f-values) of intact carbon fragments arising from a single
carbon source molecule [14], and for the calculation of the
resulting flux ratios through several key pathways in central
metabolism [14,17].
As described previously [13–19], the calculation of the
flux ratios when using fractional
13
C-labeling of amino acids
is based on assuming both a metabolic (see above) and an
isotopomeric steady state. To establish an affordable
protocol for
13
C-labeling, it has been proposed to feed a
chemostat, which is operating in metabolic steady state, for
the duration of one volume change with the medium
containing the
13
C-labeled substrate [16,18] before harvest-
ing the biomass. Then, the fraction of unlabeled biomass
produced prior to the start of the supply with
13
C-labeled
medium can be calculated following simple wash-out
kinetics [16,18,23–25]. When chemostats are fed in a Ôcarbon
limitedÕ manner, one usually finds that (a) the steady-state
concentration of labeled carbon source in the bioreactor is
small (or even zero), and (b) only small metabolic byprod-
ucts, which could be potentially re-imported into the cell
after some time, are synthesized. Both conditions are met
for the chemostat cultivations of the present study. Hence,
after the supply was switched from unlabeled to labeled
substrate, only smaller intracellular pools of metabolites
had to reach isotopic steady state, which is usually attained
for yeast within about half an hour or less [25]. (Notably,
bacterial cells reach isotopic steady state within a few
minutes or even faster [26], except when very large
intracellular pools are present in high-yield overproducing
strains [24,27–29].) At D ¼ 0.16 h
)1
(0.05 h
)1
) one volume
change requires 6.25 (20) hours, and we thus find that only a
small fraction of the labeled biomass is generated while
intracellular metabolism is far from isotopic equilibrium. In
fact, van Winden et al. [25] determined in their experimental
setup that the slowest Ôwash-inÕ rate in yeast cells growing in
achemostatwas0.63· 10
)3
s
)1
.EvenatD ¼ 0.16 h
)1
this
is much faster than the turnover rate of biomass
(4.4 · 10
)5
h
)1
). Hence, the errors of flux ratios resulting
from biomass that was fractionally labeled under isotopic
nonsteady state conditions were neglected. In agreement
with this proposition, we do not observe inconsistencies for
labeling patterns that serve to validate the bioreaction
network (Fig. 1). Such inconsistencies are expected if
isotopomeric steady state was not reached before the
majority of fractional
13
C labeled biomass was generated,
as the pools of different metabolite approach isotopic steady
state at different rates [25].
A special technical comment relates to the fact that the
formalism developed for calculating flux ratios for cells that
were grown on glucose is also readily applicable for
experiments where glycerol is fed. This is because the
catabolic breakdown of uniformly labeled [
13
C]glycerol does
not generate isotopomers which differ from those created
when glucose is fed. A more detailed discussion can be
found in a recent article describing a study in which
fractional labeling of biomass was achieved with glycerol as
the sole carbon source [19].
Biochemical reaction network model for
P. pastoris
Because the central carbon metabolism of P. pastoris has so
far not been comprehensively characterized, the biochemical
reaction network model taken for data interpretation was
the one recently identified for S. cerevisiae [17,18], which
has also been shown to be suitable for Pichia stipitis [18].
Following consideration of published data [10,30], only the
pathway for glycerol metabolism was added (Fig. 1). This
involves glycerol phosphorylation by a cytosolic glycerol
kinase to 3-phosphoglycerol which is subsequently oxidized
by a mitochondrial (membrane) FAD-dependent glycerol
phosphate ubiquitone oxidoreductase in order to yield
dihydroxyacetone phosphate. The thus generated dihyd-
roxyacetone phosphate serves for both pyruvate synthesis
and gluconeogenesis [10]. In principle, the glyoxylate cycle
also had to be included (and is thus indicated in grey in
Fig. 1). The two characteristic reactions of this cycle are
catalyzed by malate synthase (MS) and isocitrate lyase
(ICL), which are subject to catabolite repression in S. cere-
visiae [31]. Notably, repression occurs to a lesser extent
when S. cerevisiae grows on a medium containing a
nonfermentable carbon source such as glycerol as the sole
carbon source [32,33]. Although ICL and MS are most
probably cytosolic in S. cerevisiae [10], they are assumed to
2464 A. Sola
`
et al.(Eur. J. Biochem. 271) Ó FEBS 2004
be located in peroxisomes in methylotrophic yeasts such as
P. pastoris [34]. However, the
13
C-labeling pattern arising
from the action of the glyoxylate cycle and the efflux of
oxaloacetate (OAA) from the mitochondria cannot be
distinguished [18]. Hence, the exchange of OAA between
the cytosol and mitochondria was likewise considered to
be bidirectional, as discussed for yeast cells growing in
glucose-limited chemostat cultivations [18]. (Note, that
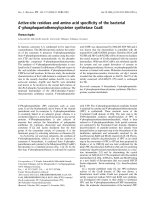
Fig. 1. Network of active biochemical pathways constructed for P. pastoris cells grown with either glycerol or glucose as the sole carbon source. The
network is based on the networks recently identified for S. cerevisiae [17] and P. stipitis [18] and on the literature on P. pastoris metabolism [10,30]
(see text). The central carbon metabolism of P. pastoris is dissected into cytosolic and mitochondrial subnetworks. In addition, the glyoxylate cycle
reactions are supposed to reside in peroxisomes in methylotrophic yeast like P. pastoris. Because the reactions of the glyoxylate cannot be identified
with the currently employed
13
C-labeling strategy (see text), its reactions are depicted in grey. The amino acids and the carbon fragments originating
from a single intermediate of the central carbon metabolism are represented in rectangular boxes. Thin lines between the amino acid carbon atoms
denote carbon bonds that are formed between fragments originating from different precursor molecules, while thick lines indicate the intact carbon
connectivities in the fragments arising from a single precursor molecule. The carbon skeletons of the intermediates of the glycolysis, TCA cycle and
pentose phosphate pathway are represented by circles, squares and triangles, respectively. The numbering of the carbon atoms refers to the
corresponding atoms in the precursor molecule. Abbreviations: AcCoA, Acetyl-Coenzyme A; DHAP, dihydroxyacetone phosphate; E4P,
erythrose 4-phosphate; F6P, fructose 6-phosphate; Fum, fumarate; G6P, glucose 6-phosphate; Glc, glucose; Glyox, glyoxylate; G3P, glyceralde-
hyde 3-phosphate; 3PG, 3-phosphoglycerate; Mae, malic enzyme; Mal, malate; OAA, oxaloacetate; 2Og, 2-oxoglutarate; PYR, pyruvate; PEP,
phosphoenolpyruvate; S7P, seduheptulose-7-phosphate; Ser, serine; Succ, succinate. For AcCoA, Fum, OAA, PYR and Succ cytosolic (cyt) and
mitochondrial (mt) pools are indicated separately.
Ó FEBS 2004 Metabolic flux profiling of Pichia pastoris (Eur. J. Biochem. 271) 2465
exchange of C4 intermediates in cytosol and mitochondria
may occur via either shuttle transport mechanisms of the
tricarboxylic acid (TCA) cycle intermediates, e.g. succinate-
fumarate shuttle [35,36], or mitochondrial redox shuttles,
e.g. malate-oxaloacetate shuttle, malate-aspartate shuttle
and malate-pyruvate shuttle [37]).
Results and discussion
P. pastoris cultivations in aerobic chemostats using glycerol
as the sole carbon source were performed at dilution rates of
D ¼ 0.16 h
)1
, which is slightly below the maximum specific
growth rate of the organism previously observed in a batch
culture on glycerol (0.17 h
)1
,A.Sola
`
, unpublished results),
and D ¼ 0.05 h
)1
, where the glycerol supply is growth-
limiting (Table 1). Consistently, some residual glycerol
(3.0 gÆL
)1
) was detected in the chemostat operating at
D ¼ 0.16 h
)1
, while no glycerol was found at D ¼ 0.05 h
)1
.
Biomass yield per gram of glycerol was 0.63 g (cell dry
weight) in both cases. An aerobic chemostat cultivation
using glucose as sole carbon source was performed at
D ¼ 0.16 h
)1
(Table 1). In this case, the biomass yield was
0.57 g (cell dry weight) per gram of glucose, slightly lower
than for cells grown on glycerol. Moreover, cells growing on
glucose exhibited higher CO
2
production rates compared
with cells growing on glycerol at the same growth rate. The
residual glucose concentration in the corresponding culti-
vation was 0.5 gÆL
)1
, indicating that the cells were likewise
growing close to the maximum specific growth rate (which
was 0.18 h
)1
for P. pastoris grown in a batch culture with
excess glucose). Notably, ethanol, acetate, succinate and
pyruvate were not detected by HPLC in any of the
cultivations, and carbon balances closed within 5%. Hence,
P. pastoris used both glycerol and glucose entirely to
generate biomass and CO
2
. This supports the notion that
P. pastoris cells grow exclusively in a respiratory manner
and are thus efficient biomass and protein producers.
The metabolic flux ratio analyses were performed with
hydrolyzed biomass samples that were harvested from these
chemostat cultures in physiological steady-state. 2D
[
13
C,
1
H]-COSY data were analyzed as described [17],
yielding the desired relative abundances (f-values) of intact
carbon fragments arising from a single source molecule of
glycerol or glucose (Table 2).
Biosynthesis of proteinogenic amino acids and C1
metabolism in
P. pastoris
As expected, the f-values obtained for the glucose and
glycerol cultivations (Table 2) show that the proteinogenic
amino acids are primarily synthesized in P. pastoris accord-
ing to the pathways documented for S. cerevisiae
[12,17,38,39]. In particular, the data confirm that (a) Lys
synthesis occurs primarily via the a-aminoadipate pathway,
(b) Ser is (primarily) synthesized from 3-phosphoglycerate,
and (c) the pool of Ser molecules is affected by reversible
cleavage by serine hydroxymethyltransferase (SHMT;
about 40% were cleaved in all three cultivations). For Gly
synthesis, yeasts can cleave either Ser (via SHMT) or Thr
(via threonine aldolase). Due to near degeneracy of f-values,
however, it is not possible to accurately determine the
relative contribution of the two pathways, or to distinguish
between cytosolic and mitochondrial SHMT activity.
Nonetheless, the data prove that the SHMT pathway is
active. This is consistent with recent
13
C-labeling experi-
ments with S. cerevisiae cells growing on glucose batch
cultures, where the threonine aldolase pathway accounts for
only about one-third of the Gly biosynthesis, leaving the
SHMT pathway as the major route to Gly in these cells [40].
In contrast to the SHMT pathway, Thr cleavage reaction
via threonine aldolase is, if present, irreversible. This can be
readily inferred from the fact that nearly identical f-values
were obtained from Thr and Asp. Gly may also be
synthesized from a C1 unit and CO
2
via the mitochondrial
glycine cleavage (GCV) pathway. In contrast to the previous
study with S. cerevisiae [17] and the present glucose
cultivation of P. pastoris, we find in the glycerol cultivations
no evidence for the efflux into cytosol of Gly which has been
reversibly cleaved by GCV. Hence, it may either be that the
mitochondrial GCV pathway is operating irreversibly, or
that Gly is not exported into the cytosol when cells are
grown on glycerol. In principle, yeasts can also synthesize
Gly from TCA cycle intermediates via ICL and the alanine,
glyoxylate aminotransferase [41]. However, our data suggest
that the activity of the glyoxylate cycle is low (see below), so
that this route for Gly synthesis is, if active at all, likely to be
of minor importance.
Central carbon metabolism of
P. pastoris
growing
on glycerol in chemostats
The use of the C3 source glycerol for BDF
13
C-labeling of
proteinogenic amino acids enabled the determination of the
flux ratios for reactions associated with the TCA cycle, while
those related to glycolysis and the pentose phosphate
pathway (PPP) cannot be assessed (Table 3). This is because
labeled glycerol being metabolized through gluconeogenesis
and oxidative PPP does not produce labeling patterns that
are sufficiently distinct from those generated when glycerol
is channeled through the nonoxidative PPP. In fact, the only
information that can be derived with respect to the
operation of the PPP is obtained from the f-values of His
Table 1. Growth parameters at steady state chemostat cultivations of P. pastoris. Y
s/x
represents the biomass yield, q
glyc
,q
glc
and q
O2
are specific
utilization rates; q
CO2
specific production rates, where glyc and glc indicate glycerol and glucose, respectively. ND, not determined.
Carbon source and
dilution rate
(D,[h
)1
])
Residual substrate
concentration
(gÆL
)1
)
Y
s/x
(g (dry wt)Æg
)1
)
q
glyc
,q
gluc
(mmolÆg
)1
Æh
)1
)
q
CO2
(mmolÆg
)1
Æh
)1
)
q
O2
(mmolÆg
)1
Æh
)1
)
Glycerol (0.05) 0.0 0.63 0.86 0.9 ND
Glycerol (0.16) 3.0 0.63 2.72 2.55 1.29
Glucose (0.16) 0.5 0.57 1.55 3.18 2.73
2466 A. Sola
`
et al.(Eur. J. Biochem. 271) Ó FEBS 2004
Cb (Table 2). These reveal the reversible activity of the
transketolase and transaldolase reactions when P. pastoris
is grown on glycerol. On the other hand, the wealth of
information obtained for pathways associated with the
TCA intermediates can be summarized as follows (Fig. 2):
(a) Gluconeogenesis from cyt-OAA via phosphoenolpyru-
vate (PEP) carboxykinase is not registered. (b) Synthesis of
mitochondrial pyruvate (mt-PYR) from malate via malic
Table 2. Relative abundances of intact C2 and C3 fragments in proteinogenic amino acids. The first column indicates the carbon position for which
the
13
C fine structure was observed. The f-values were calculated as described [14], and are given for the glycerol chemostat cultivation at
D ¼ 0.05 h
)1
in columns 2–5, for the glycerol chemostat cultivation at D ¼ 0.16 h
)1
in columns 6–9 and for the glucose chemostat cultivation at
D ¼ 0.16 h
)1
in columns 10–13. Note, first, that for terminal carbons f
(2
*
)
and f
(3)
are not defined, second, that in cases where f
(2
*
)
is not given for a
mid-chain carbon, the carbon-carbon scalar coupling constants are similar and the two doublets cannot be distinguished, and third, that for Tyr the
two carbons d
1
and d
2
,ande
1
and e
2
, respectively, give rise to only one
13
C fine structure each [14]. ND, not determined.
Carbon atom
Relative abundance of intact carbon fragments
Glycerol (0.05 h
)1
) Glycerol (0.16 h
)1
) Glucose (0.16 h
)1
)
f
(1)
f
(2)
f
(2
*
)
f
(3)
f
(1)
f
(2)
f
(2
*
)
f
(3)
f
(1)
f
(2)
f
(2
*
)
f
(3)
Ala-a 0.02 0.06 0 0.92 0.01 0.07 0 0.92 0 0.14 0.01 0.85
Ala-b 0.05 0.95 – – 0.02 0.98 – – 0.01 0.99 – –
Arg-b 0.71 0.29 – 0 0.56 0.43 – 0.01 0.60 0.39 – 0.01
Arg-d 0.08 0.92 – – 0.10 0.90 – – 0.089 0.91 – –
Asp-a 0.26 0.09 0.42 0.23 0.14 0.04 0.18 0.64 0.12 0.12 0.16 0.60
Asp-b 0.26 0.23 0.42 0.09 0.14 0.65 0.17 0.04 0.13 0.71 0.14 0.02
Glu-a 0.24 0.21 0.45 0.10 0.15 0.32 0.39 0.14 0.22 0.27 0.41 0.10
Glu-b 0.68 0.32 – 0 0.50 0.50 – 0 0.61 0.39 – 0
Glu-c 0 0 1 0 0 0 1 0 0 0.02 0.96 0.02
Gly-a 0.06 0.94 – – 0.08 0.92 – – 0.17 0.83 – –
His-a 0.04 0 0 0.96 0.06 0 0 0.94 0.06 0 0.04 0.9
His-b 0.06 0.92 0.02 0 0.06 0.94 0 0 0.13 0.53 0 0.34
His-d
2
0.55 0.45 – – 0.55 0.45 – – 0.23 0.77 – –
Ile-a 0.38 0 0.62 0 0.21 0 0.79 0 0.23 0 0.77 0
Ile-c
1
0.46 0.51 – 0.03 0.76 0.21 – 0.03 0.74 0.19 – 0.07
Ile-c
2
0.07 0.93 – – 0.06 0.94 – – 0.06 0.94 – –
Ile-d 0.52 0.48 – – 0.79 0.21 – – 0.84 0.16 – –
Leu-a 0.06 0 0.94 0 0.05 0 0.95 0 0.06 0 0.94 0
Leu-b 0.93 0.02 – 0.05 0.95 0 – 0.05 0.94 0.06 – 0
Leu-d
1
0.07 0.93 – – 0.07 0.93 – – 0.71 0.29
Leu-d
2
0.99 0.01 – – 1 0 – – 1 0 – –
Lys-a 0.03 0.07 0.87 0.03 0.03 0.1 0.81 0.06 0.06 0 0.92 0.02
Lys-b 0.76 0.24 – 0 0.56 0.42 – 0.02 0.63 0.37 – 0
Lys-c 0.68 0.29 – 0.03 0.56 0.44 – 0 0.66 0.34 – 0
Lys-d 0.05 0.95 – 0 0.07 0.93 – 0 0.06 0.94 – 0
Lys-e 0.02 0.98 – – 0.04 0.96 – – 0.1 0.9 – –
Met-a 0.23 0.13 0.39 0.25 0.12 0.08 0.22 0.58 0.14 0 0.21 0.65
Phe-a 0.04 0 0 0.96 0.03 0 0 0.97 0.03 0.1 0.01 0.86
Phe-b 0.03 0.97 0 0 0.03 0.97 0 0 0.06 0.80 0.14 0
Pro-a 0.29 0.15 0.42 0.14 0.27 0.29 0.27 0.17 0.29 0.28 0.37 0.06
Pro-b 0.72 0.28 – 0 0.57 0.43 – 0 0.65 0.35 – 0
Pro-c 0.06 0.90 – 0.04 0.13 0.85 – 0.02 0.12 0.86 – 0.02
Pro-d 0.15 0.85 – – 0.15 0.85 – – 0.11 0.89 – –
Ser-a 0.01 0 0.42 0.57 0.03 0 0.40 0.57 0.13 0.04 0.36 0.47
Ser-b 0.46 0.54 0.45 0.55 – – 0.47 0.53 – –
Thr-a 0.27 0.09 0.40 0.24 0.13 0.05 0.17 0.65 0.16 0.09 0.13 0.62
Thr-b 0.24 0.66 0.10 0.12 0.84 – 0.04 0.14 0.85 – 0.01
Thr-c
2
0.49 0.51 – – 0.76 0.24 – – 0.82 0.18 – –
Tyr-a 0.06 0 0.01 0.93 0.06 0 0.01 0.93 0.03 0.11 0 0.86
Tyr-b 0.02 0.98 0 0 0.04 0.96 0 0 0.05 0.95 0 0
Tyr-d
x
0.03 0.97 – 0 0.05 0.95 – 0 ND ND ND ND
Tyr-e
x
0.56 0 – 0.44 0.54 0 – 0.46 0.33 0.21 – 0.46
Val-a 0.04 0 0.96 0 0.05 0 0.95 0 0.13 0 0.87 0
Val-c
1
0.04 0.96 – – 0.04 0.96 – – 0.05 0.95 – –
Val-c
2
0.96 0.04 – – 0.99 0.01 – – 0.97 0.03 – –
Ó FEBS 2004 Metabolic flux profiling of Pichia pastoris (Eur. J. Biochem. 271) 2467
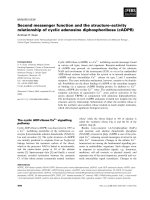
enzyme is likewise not observed. (c) The fraction of
mt-OAA reversibly interconverted to fumarate is about
the same at high and low dilution rates. (d) The fraction of
cytosolic-OAA that stems from the mitochondrial pool of
C4 intermediates, e.g. via malate-Asp and/or malate-OAA
shuttles [37] (or has possibly been synthesized via the
glyoxylate cycle) is about twice as high at the lower dilution
rate. This indicates that at close to maximal growth rates, a
largely unidirectional flux of OAA from the cytosol to the
mitochondria occurs. (e) Significant variations were also
identified for the anaplerotic supply of the TCA cycle – a
higher fraction of mt-OAA arising from PEP at a higher
growth rate reflects the increased demand for biosynthetic
building blocks.
Comparative profiling of
P. pastoris
grown on glycerol
and glucose
At D ¼ 0.16 h
)1
, P. pastoris cells grow at about 90% of the
maximum specific growth rate with both glycerol and
glucose provided as the sole carbon source. Hence, the
comparison of flux ratios at this dilution rate allows one to
assess the impact of the different chemical nature of the two
molecules (Fig. 1) on metabolic regulation when the same
Ôbiomass production objectiveÕ is reached. Overall, flux
ratios turn out to be rather similar (Table 3), as could be
expected due to the very similar oxidation state of glycerol
and glucose. The only notable difference is detected for the
anaplerotic supply of the TCA cycle: for cells grown on
glycerol, the fraction of mt-OAA arising from PEP is about
10% higher than on glucose. The ratio [biomass/(bio-
mass + CO
2
)] formation changes accordingly, that is, cells
growing on glucose produce CO
2
at higher rates with
slightly less biomass being formed when compared to cells
grown on glycerol. Among the invariant flux ratios, we find
that mt-PYR synthesis from malate is negligible in all
chemostat cultures. Consistently, malic enzyme activities
were found only at low basal levels in P. pastoris cultures
grown on either glycerol or glucose. This finding is in
contrast to the important role of the malic enzyme for mt-
PYR metabolism in respiro-fermentative glucose batch
cultures of S. cerevisiae [17]. Due to degeneracy of the
labeling patterns, the glyoxylate cycle activity cannot be
Table 3. Origins of metabolic intermediates during aerobic growth of P. pastoris in glycerol chemostat cultures at D = 0.05 h
-1
and D = 0.16 h
-1
,and
in glucose chemostat culture at D = 0.16 h
-1
. For comparison, corresponding data previously reported for P. stipitis and S. cerevisiae glucose-
limited chemostat aerobic cultures at D ¼ 0.10 h
)1
[18] are given in the two right-most columns.
Metabolites
Fraction of total pool [%] (mean ± SD)
P. pastoris P. stipitis S. cerevisiae
Glycerol
0.05 h
)1
Glycerol
0.16 h
)1
Glucose
0.16 h
)1
Glucose
a
0.10 h
)1
Glucose
a
0.10 h
)1
Cytosol
PEP derived from PPP through at least one
transketolase reaction (upper bound)
ND ND 41 ± 9 61 ± 11 40 ± 8
P5P from glucose (lower bound) – – 34 ± 2 28 ± 2 41 ± 2
R5P from G3P and S7P (TK reaction) ND ND 66 ± 2 72 ± 2 59 ± 2
R5P from E4P (TK and TA reactions) ND ND 23 ± 2 43 ± 2 33 ± 2
E4P from F6P (lower bound) ND ND 6 ± 5 27 ± 5 6 ± 6
PEP from cyt-OAA (PEP carboxykinase reaction) 0–3 0–6 0–6 0–3 0–10
cyt-OAA from cyt-PYR
b
32 ± 2 68 ± 4 63 ± 4 24 ± 3 62 ± 4
cyt-OAA reversibly converted to fumarate at least once
(cytosolic or intercompartmental exchange)
56 ± 13 12 ± 6 6 ± 5 47 ± 16 0–8
Mitochondria
mt-PYR from malate 0–4 0–4 0–7 0–7 0–13
mt-OAA from PEP (anaplerotic supply of TCA cycle) 33 ± 2 48 ± 2 38 ± 2 32 ± 2 31 ± 2
mt-OAA reversibly converted to fumarate at least once 65 ± 14 61 ± 14 52 ± 14 58 ± 14 56 ± 14
a
Data taken from [18].
b
Values assuming absence of cytosolic-OAA from fumarate conversion.
Fig. 2. Summary of flux information involving the pools of TCA inter-
mediates when P. pastoris cells are grown in a chemostat. The top,
middle and bottom values in the boxes correspond, respectively, to the
glycerol cultivation at D ¼ 0.05 h
)1
, the glycerol cultivation at
D ¼ 0.16 h
)1
and the glucose cultivation at D ¼ 0.16 h
)1
.Notethat
values associated with arrows pointing at the same metabolite pool add
up to 100%. For abbreviations see the legend of Fig. 1.
2468 A. Sola
`
et al.(Eur. J. Biochem. 271) Ó FEBS 2004
reliably identified from the NMR data. However, to
confirm the previously established view that the glyoxylate
cycle is low when yeast cells grow aerobically on glucose
[17,18], we have measured ICL activities in the P. pastoris
cultures. Indeed, about the same low ICL activities
(0.018 UÆmg
)1
of protein and 0.019 UÆmg
)1
of protein,
respectively) were detected in the glucose (D ¼ 0.16 h
)1
)
and glycerol (D ¼ 0.05 h
)1
) limited cultures. For cells
grownonglycerolatD ¼ 0.16 h
)1
, the ICL activities were
further reduced (5.07 · 10
)3
UÆmg
)1
of protein). Glucose is
known to repress the glyoxylate pathway in S. cerevisiae
[42], and our enzyme assays show that a similar degree of
repression is induced by glycerol in P. pastoris.
Comparison of
P. pastoris
with
P. stipitis
and
S. cerevisiae
The central carbon metabolism of S. cerevisiae and P. stip-
itis cells grown on glucose in chemostat cultures at
D ¼ 0.1 h
)1
has been previously characterized [18]. Here
we compare (Table 3) these earlier studies with the new data
for P. pastoris growing in glucose chemostat cultures at
D ¼ 0.16 h
)1
.TheS. cerevisiae and P. stipitis glucose
limited continuous cultivations were carried out at about
one-third of the l
max
, whereas for the present P. pastoris
cultivation about 90% of the l
max
was reached. Moreover,
the medium composition was somewhat different in the
earlier studies [18]. Nonetheless, in all cultivations we find
that cells exhibit a respiratory metabolism operating to
support comparably fast cell growth with very little or no
byproduct formation. Moreover, the same approach for flux
ratio profiling was used [17], which facilitates comparison.
Remarkably, we find that, overall, flux ratios of P. pas-
toris at D ¼ 0.16 h
)1
are more similar to those of S. cere-
visiae than P. stipitis (both at D ¼ 0.1 h
)1
). For example,
the fraction of cyt-OAA stemming from cyt-PYR is the
same for P. pastoris and S. cerevisiae, but about 2.5 times
larger in P. stipitis. This might indicate that in P. pastoris
and S. cerevisiae the cytosolic and mitochondrial PYR
pools are less well equilibrated in the aerobic growth regime.
Similarly, the fraction of cyt-OAA reversibly converted to
fumarate is very low for P. pastoris and S. cerevisiae, while
about half of the cyt-OAA molecules in P. stipitis have
undergone such an interconversion at least once. Consistent
with the faster growth, a somewhat increased anaplerotic
supply is detected for P. pastoris. Although any generalized
conclusion is hampered by the fact that the dilution rate and
the growth media were not the same for all cultivations, our
findings might possibly provide a first indication that
regulation of central carbon metabolism in P. pastoris
and S. cerevisiae are more similar to each other than to
P. stipitis.
Conclusions
This is the first comprehensive study of amino acid
biosynthesis and central carbon metabolism of the yeast
P. pastoris. In the framework of this study, we have
established the BDF
13
C-labeling approach of proteinogenic
amino acids as an analytical tool to study intermediary
metabolism of yeast cells grown on glycerol. This approach
allows one to accurately map the metabolic state of the TCA
cycle and associated pathways, thus being an important
methodological expansion for investigating the metabo-
lism of eukaryotic cells grown with carbon sources other
than glucose. Specifically, we have shown that (a) the
common amino acids are synthesized in P. pastoris as
previously described for S. cerevisiae, and that (b) growth
on glucose and glycerol results in rather similar flux ratio
profiles. Our investigation can be expected to become a
valuable Ôbaseline studyÕ for future experiments that are
geared towards profiling P. pastoris cells growing on
mixtures of glycerol and methanol. Such studies will
probably also support the optimization of the larger-scale
production of glycosylated human proteins for biomedical
applications.
Acknowledgements
This work was supported by the University at Buffalo, The State
University of New York, the Spanish Ministry of Science and
Technology (CICYT project PPQ2001-1908), and the Academy of
Finland (projects 52311 and 202409). The authors thank J. M. Cregg
and C. Gancedo for useful comments, and O. Cos for technical
assistance with cultivation off-gas analyses.
References
1. Lin Cereghino, J. & Cregg, J.M. (2000) Heterologous protein
expression in the methylotrophic yeast Pichia pastoris. FEMS
Microbiol. Rev. 24, 45–66.
2. Lin Cereghino, G.P., Lin Cereghino, J., Ilgen, C. & Cregg, J.M.
(2002) Production of recombinant proteins in fermenter cultures
of the yeast Pichia pastoris. Curr. Opin. Biotechnol. 13, 329–332.
3. Hamilton, S.R., Bobrowicz, P., Bobrowicz, B., Davidson, R.C.,
Li,H.,Mitchell,T.,Nett,J.H.,Rausch,S.,Stadheim,T.A.,
Wischnewski, H., Wildt, S. & Gerngross, T.U. (2003) Production
of complex human glycoproteins in yeast. Science 301, 1244–1246.
4. Wood, M.J. & Komives, E.A. (1999) Production of large quan-
tities of isotopically labeled protein in Pichia pastoris by fermen-
tation. J. Biomol. NMR 13, 149–159.
5. de Lamotte, F., Boze, H., Blanchard, C., Klein, C., Moulin, G.,
Gautier, M.F. & Delsuc, M.A. (2001) NMR monitoring of
accumulation and folding of
15
N-labeled protein overexpressed in
Pichia pastoris. Prot. Express. Purif. 22, 318–324.
6. Montelione, G.T., Zheng, D., Huang, Y., Gunsalus, K.C. &
Szyperski, T. (2000) Protein NMR spectroscopy for structural
genomics. Nat. Struct. Biol. 7, 982–984.
7. Stratton, J., Chiruvolu, V. & Meagher, M. (1998) High cell-density
fermentation. Methods Mol. Biol. 103, 107–120.
8. Harder, W. & Veenhuis, M. (1989) Metabolism of one-carbon
compounds. In The Yeasts, Metabolism and Physiology of Yeasts
(Rose, A.H. & Harrison, J.S., eds), Vol. 3, pp. 289–316. Academic
Press, London.
9. Egli, T., Ka
¨
ppeli, O. & Fiechter, A. (1982) Mixed substrate growth
of methylotrophic yeasts in chemostat culture: Influence of the
dilution rate on the utilization of a mixture of glucose and me-
thanol. Arch. Microbiol. 131, 8–13.
10. Gancedo, C. & Serrano, R. (1989) Energy-yielding metabolism. In
The Yeasts, Metabolism and Physiology of Yeasts (Rose, A.H. &
Harrison, J.S., eds), Vol. 3, pp. 205–259. Academic Press, London.
11. Flores, C L., Rodrı
´
guez, C., Petit, T. & Gancedo, C. (2000)
Carbohydrate and energy-yielding metabolism in non-conven-
tional yeasts. FEMS Microbiol. Rev. 24, 507–529.
12. Jones, E.W. & Fink, G.R. (1982) Regulation of amino acid and
nucleotide biosynthesis in yeast. In The Molecular Biology of the
Yeast Saccharomyces, Metabolism and Gene Expression
Ó FEBS 2004 Metabolic flux profiling of Pichia pastoris (Eur. J. Biochem. 271) 2469
(Strathern, J.N., Jones, E.W. & Broach, J.R., eds), pp. 181–299.
Cold Spring Harbor Laboratory Press, Cold Spring Harbor, NY.
13. Szyperski, T. (1998)
13
C-NMR, MS and metabolic flux balancing
in biotechnology research. Q. Rev. Biophys. 31, 41–106.
14. Szyperski, T. (1995) Biosynthetically directed fractional
13
C-labe-
ling of proteinogenic amino acids. An efficient analytical tool to
investigate intermediary metabolism. Eur. J. Biochem. 232, 433–
448.
15. Sauer, U., Lasko, D.R., Fiaux, J., Hochuli, M., Glaser, R.,
Szyperski, T., Wu
¨
thrich, K. & Bailey, J.E. (1999) Metabolic flux
ratio analysis of genetic and environmental modulations of
Escherichia coli central carbon metabolism. J. Bacteriol. 181,
6679–6688.
16. Sauer, U., Hatzimanikatis, V., Bailey, J.E., Hochuli, M., Szyper-
ski, T. & Wu
¨
thrich, K. (1997) Metabolic fluxes in riboflavin-pro-
ducing Bacillus subtilis. Nat. Biotechnol. 15, 448–452.
17. Maaheimo,H.,Fiaux,J.,C¸ akar, Z.P., Bailey, J.E., Sauer, U. &
Szyperski, T. (2001) Central carbon metabolism of Saccharomyces
cerevisiae explored by biosynthetic fractional
13
C labeling of
common amino acids. Eur. J. Biochem. 268, 2464–2479.
18. Fiaux, J., C¸ akar, Z.P., Sonderegger, M., Wu
¨
thrich, K., Szyperski,
T. & Sauer, U. (2003) Metabolic flux profiling of the yeasts
Saccharomyces cerevisiae and Pichia stipitis. Eukaryotic Cell 2,
170–180.
19. Hochuli, M., Patzelt, H., Oesterhelt, D., Wu
¨
thrich,K.&
Szyperski, T. (1999) Amino acid biosynthesis in the halophilic
archaeon Haloarcula hispanica. J.Bacteriol. 181, 3226–3237.
20. Minning, S., Serrano, A., Ferrer, P., Sola
`
,C.,Schmid,R.D.&
Valero, F. (2001) Optimisation of the high-level production of
Rhyzopus oryzae lipase in Pichia pastoris. J. Biotechnol. 86, 59–70.
21. Gu
¨
ntert, P., Do
¨
tsch, V., Wider, G. & Wu
¨
thrich, K. (1992) Pro-
cessing of multi-dimensional NMR data with the new software
PROSA. J. Biomol. NMR 2, 619–629.
22. Szyperski, T., Glaser, R.W., Hochuli, M., Fiaux, J., Sauer, U.,
Bailey, J. & Wu
¨
thrich, K. (1999) Bioreaction network topology
and metabolic flux ratio analysis by biosynthetic fractional
13
C-
labeling and two dimensional NMR spectroscopy. Metab. Eng. 1,
189–197.
23. Gombert, A.K., Moreira dos Santos, M., Christensen, B. &
Nielsen, J. (2001) Network identification and flux quantification in
the central metabolism of Saccharomyces cerevisiae under different
conditions of glucose repression. J. Bacteriol. 183, 1441–1451.
24. Marx, A., de Graaf, A.A., Wiechert, W., Eggeling, L. & Sahn, H.
(1996) Determination of the fluxes in the central carbon metabo-
lism of Corynebacterium glutamicum by nuclear magnetic reso-
nance spectroscopy combined with metabolite balancing.
Biotechnol. Bioeng. 49, 111–129.
25. van Winden, W., Schipper, D., Verheijen, P. & Heijnen, J. (2001)
Innovations in generation and analysis of 2D [
13
C,
1
H] COSY
NMR spectra for metabolic flux analysis purposes. Metab. Eng. 3,
322–343.
26. Walsh, K. & Koshland, D.E. (1984) Determination of flux
through the branch point of two metabolic cycles. The tri-
carboxylic acid cycle and the glyoxylate shunt. J. Biol. Chem. 259,
9646–9654.
27. Sonntag, K., Eggeling, L., de Graaf, A.A. & Sahm, H. (1993) Flux
partitioning in the split pathway of lysine synthesis in Coryne-
bacterium glutamicum: Quantification by
13
C- and
1
H-NMR
spectroscopy. Eur. J. Biochem. 213, 1325–1331.
28. Wiechert. W., Siefke, C., de Graaf, A.A. & Marx, A. (1997)
Bidirectional reaction steps in metabolic networks. II. Flux esti-
mation and statistical analysis. Biotechnol. Bioeng. 55, 118–135.
29. Klapa, M.I., Aon, J C. & Stephanopoulos, G. (2003) Systematic
quantification of complex metabolic flux networks using stable
isotopes and mass spectrometry. Eur. J. Biochem. 270, 3525–3542.
30. Gancedo, C., Gancedo, J.M. & Sols, A. (1968) Glycerol meta-
bolism in yeasts. Pathways of utilization and production. Eur. J.
Biochem. 5, 165–172.
31. Gancedo, J.M. & Gancedo, C. (1997) Gluconeogenesis and
catabolite inactivation. In Yeast Sugar Metabolism: Biochemistry,
Genetics, Biotechnology and Applications (Zimmermann, F.K. &
Entian, K D., eds), pp. 359–377. Technomic Publishing,
Lancaster, PA.
32. Ferna
´
ndez, E., Ferna
´
ndez,M.,Moreno,F.&Rodicio,R.(1993)
Transcriptional regulation of the isocitrate lyase encoding gene in
Saccharomyces cerevisiae. FEBS. Lett. 333, 238–242.
33. Scho
¨
ler, A. & Schu
¨
ller, H J. (1994) A carbon-source-responsive
promoter element necessary for activation of the isocitrate lyase
gene ICL1 is common to genes of the gluconeogenic pathway in
the yeast Saccharomyces cerevisiae. Mol. Cell. Biol. 14, 3613–3622.
34. Bruinenberg, P.G., Blaauw, M., Veenhuis, M. & Ab, G. (1989)
Purification and some properties of malate synthase from the
methylotrophic yeast Hansenula polymorpha. FEMS Microbiol.
Lett. 61, 11–16.
35. Palmieri, L., Vozza, A., Agrimi, G., De Marco, V., Runswick,
M.J., Palmieri, F. & Walker, J.E. (1999) Identification of the yeast
mitochondrial transporter for oxalacetate and sulfate. J. Biol.
Chem. 274, 22184–22190.
36. Palmieri, L., Lasorsa, F.M., De Palma, A., Palmieri, F., Runs-
wick, M.J. & Walker, J.E. (1997) Identification of the yeast ACR1
gene product as a succinate-fumarate transporter essential for
growth on ethanol or acetate. FEBS Lett. 417, 114–118.
37. Bakker, B.M., Overkamp, K.M., van Maris, A.J.A., Ko
¨
tter, P.,
Luttik, M.A.H., van Dijken, J.P. & Pronk, J.T. (2001) Stoichio-
metry and compartmentation of NADH metabolism in Sacchar-
omyces cerevisiae. FEMS Microbiol. Rev. 25, 15–37.
38. Voet, D. & Voet, J.G. (1995) Biochemistry. John Wiley & Sons,
New York.
39. Michal, G. (1998) Biochemical Pathways: an Atlas of Biochemistry
and Molecular Biology. John Wiley & Sons, New York.
40. Woldman, Y. & Appling, D.R. (2002) A general method for
determining the contribution of split pathways in metabolite
production in the yeast Saccharomyces cerevisiae. Metab. Eng. 4,
170–181.
41. Takada, Y. & Noguchi, T. (1985) Characteristics of alanine:
glyoxylate aminotransferase from Saccharomyces cerevisiae,a
regulatory enzyme in the glyoxylate pathway of glycine and serine
biosynthesis from tricarboxylic acid-cycle intermediates. Biochem.
J. 231, 157–163.
42. Gancedo, J.M. (1998) Yeast carbon catabolite repression.
Microbiol. Mol. Biol. Rev. 62, 334–361.
Supplementary material
The following material is available from http://blackwell
publishing.com/products/journals/suppmat/EJB/EJB4176/
EJB4176sm.htm
Fig. S1.
13
C Scalar coupling fine structures of BDF
13
C-labeled amino acids from the P. pastoris cells grown
in glycerol chemostat cultivations at the dilution rates
0.05 h
)1
and 0.16 h
)1
.
Fig. S2.
13
C Scalar coupling fine structures of BDF
13
C-labeled amino acids from the P. pastoris cells grown
in glucose chemostat cultivation at dilution rate of 0.16 h
)1
.
2470 A. Sola
`
et al.(Eur. J. Biochem. 271) Ó FEBS 2004